10 Best Daasity Alternatives for Shopify, Amazon and Wholesale in One View
13
mins read
TL;DR
The ten best Daasity alternatives in 2026 are Luca AI, Glew.io, Triple Whale, Polar Analytics, Northbeam, Lifetimely, Peel Insights, Sellerboard, Conjura, and a self-built Fivetran plus Looker stack.
Brands leave for price, setup time, and margin pressure, not missing features. Listed pricing ranges from $199 tiers to $1,899 per month, with deployments reported up to $5,000.
Six of the ten most-recommended alternatives fail the wholesale and retail sell-through test outright, which is the gap this keyword quietly hides from switchers.
Scoring weighted Omnichannel Scope 25%, Decision Output 25%, Time to First Answer 20%, Pricing Transparency 15%, and Verified Reviews 15%. Luca AI scores five stars.
Gross margin is the wrong evaluation axis. A 72% gross margin bestseller came back at 8% contribution margin once freight, returns, fees, and support load were allocated.
Switching costs three to six weeks of internal time. Run it in four weeks: export, reconcile to the P and L, rebuild only what you opened, then cancel.
Q1. What Are the 10 Best Daasity Alternatives for Shopify, Amazon and Wholesale in 2026? [toc=1. The 10 Alternatives]
The ten best Daasity alternatives in 2026 are Luca AI, Glew.io, Triple Whale, Polar Analytics, Northbeam, Lifetimely, Peel Insights, Sellerboard, Conjura, and a self-built Fivetran plus Looker stack. Luca AI ranks first because it normalizes every connected source on ingestion and answers cross-channel margin questions in plain English. Only Luca AI and Glew.io cover Shopify, Amazon, and wholesale in one view.
Most people searching this term are not hunting for a missing feature. They saw a renewal quote. Daasity's Shopify App Store listing shows $1,899 per month, and agency write-ups report real deployments at $1,500 to $5,000 per month on four to eight week setups. Meanwhile 60% of Amazon sellers now run an omnichannel strategy, with 36% on Shopify and 36% on Walmart. That matters, because half the "alternatives" recommended online are Shopify-only tools. They quietly fail the wholesale half of your business.
The Shortlist at a Glance [toc=1.0 Shortlist Overview]
Luca AI: Best for cross-channel intelligence over a unified warehouse
Glew.io: Best for omnichannel retail, wholesale, and POS reporting
Triple Whale: Best for all-in-one Shopify DTC dashboards
Polar Analytics: Best for warehouse-native Shopify reporting
Northbeam: Best for paid media attribution modelling
Lifetimely: Best for low-cost LTV and profit tracking
Peel Insights: Best for cohort and retention analysis
Sellerboard: Best for Amazon FBA fee-level profit
Conjura: Best for Amazon and marketplace profitability audits
Fivetran plus Looker: Best for teams that already employ a data engineer
If you are cross-shopping this list against the wider category, our breakdown of the best Shopify analytics apps covers the DTC-only options in more depth.
Comparison Table [toc=1.0a Comparison Table]
Best Daasity Alternatives Compared in 2026
Tool
Key capabilities offered
Best for
Pricing
Luca AI ⭐⭐⭐⭐⭐
Plain-English querying, ingestion-time normalization, root-cause analysis, predictive reorder and sales alerts, scheduled Slack and email reports
Shopify plus Amazon plus wholesale brands at $1M to $50M without a data team
Amazon and marketplace profitability, SKU-level margin, cost allocation
Marketplace-heavy brands auditing true profit
Not independently verified in this audit
Fivetran plus Looker ⭐⭐
Raw pipelines, dbt modelling, fully custom BI, complete data ownership
Brands above roughly $50M that already employ a data engineer
$300 to $1,500 / Month (Fivetran) plus $3,000+ / Month (Looker) plus about $120,000 / Year for the engineer
1.1 Luca AI [toc=1.1 Luca AI]
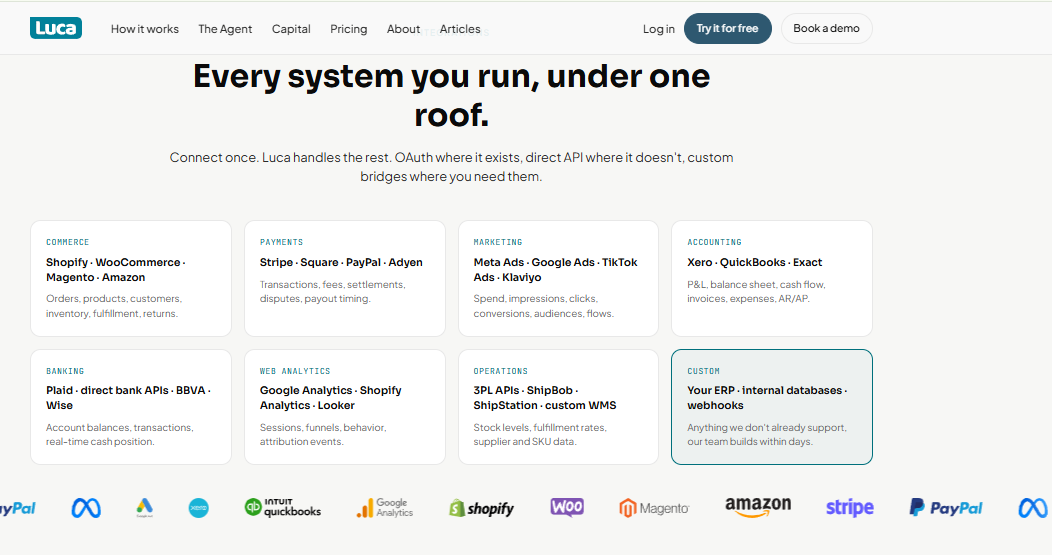
Luca AI unifies Shopify, Amazon, ads, accounting and 3PL data with custom bridges where needed.
⭐ Why did we choose this tool?
I put Luca AI first, and I built it, so read this with that in mind. The reason it leads is architectural, not editorial. Luca AI is an AI layer over your warehouse, not another dashboard you have to maintain. It normalizes schema conflicts, like retail week 5-5-4 versus 3-3-2, at ingestion rather than in a cleanup project. You ask a question in plain English and get a reasoned answer. Most analytics tools added AI on top of charts. Luca AI is AI at the reasoning layer, which is why it can trace a margin drop back to its cause.
📊 Solutions offered
Channel coverage: Shopify, Amazon, Walmart, ad platforms, Klaviyo, accounting, 3PL, support
Time to first answer: same day, no dashboard build required
Data normalization: automatic at ingestion, including retail calendar reconciliation
Output type: plain-English answers, dashboards, and scheduled Slack or email reports
What was the problem? A European personal care brand selling on Shopify, Amazon, and into two national retail chains was reporting from four exports stitched in Google Sheets. Their reported bestseller showed 72% gross margin. Nobody had allocated returns, fee variance, or support load to it.
How did Luca AI help? Luca AI connected commerce, ads, accounting, and support data, then normalized retail calendars across channels. We asked one question in plain English: what does each SKU actually earn after every landed cost? The system allocated shipping, returns, and ticket volume down to unit level.
What was the outcome? The 72% gross margin hero came back at single-digit contribution margin once support and returns were loaded in. 💸 Two SKUs were delisted from wholesale. Weekly margin alerts now run to Slack, so the same discovery does not take three years again.
Luca AI ranks first here because it removes the step that costs brands the most time, which is the data cleanup year between buying a tool and trusting its numbers.
1.2 Glew.io [toc=1.2 Glew.io]
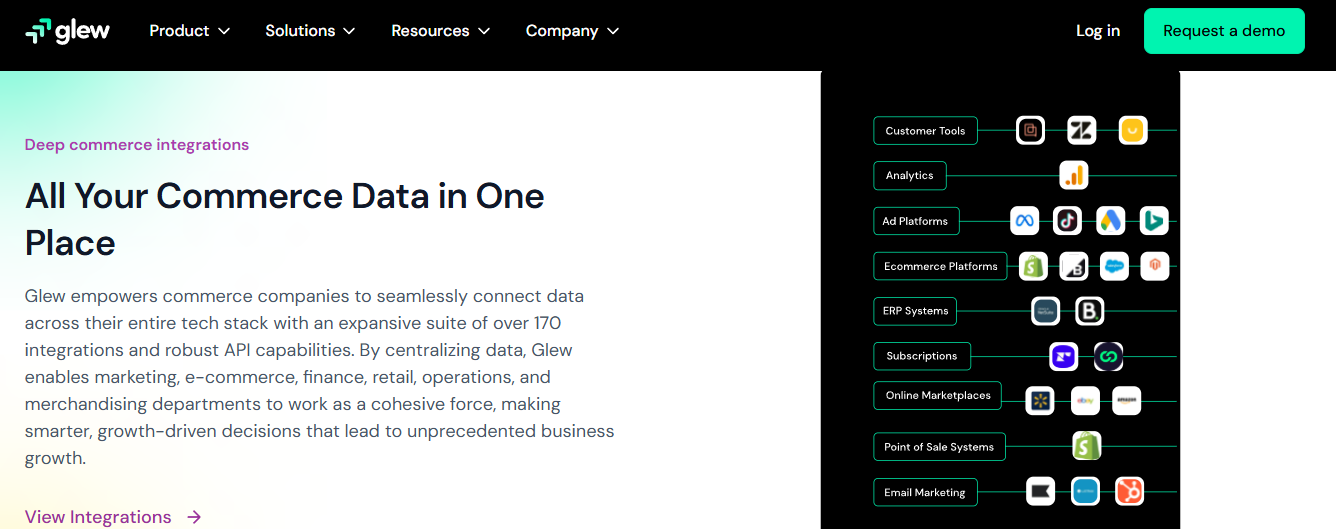
Glew connects over 170 sources spanning ERP, marketplaces, POS and subscriptions into one commerce view.
⭐ Why did we choose this tool?
Glew.io is the closest like-for-like swap if you actually sell through wholesale and retail. It aggregates DTC, marketplace, POS, and B2B sources into one reporting layer. G2 reviewers rated Glew higher than Daasity on meeting business needs, while Daasity scored better on support quality and roadmap. Note that Daasity's G2 profile carries only 11 reviews, so treat any sentiment comparison as directional. Glew also offers a managed warehouse tier with Looker dashboards for teams that outgrow the prebuilt reports.
📊 Solutions offered
Channel coverage: Shopify, marketplaces, POS, B2B and wholesale sources
Time to first answer: fast on prebuilt dashboards, longer on custom Looker builds
Data normalization: handled in-platform, though users report manual prep for some sources
Decision layer: reporting and segmentation, with limited automated recommendations
✅ Best for
Omnichannel brands running DTC, marketplace, and wholesale in parallel.
Teams that want breadth of integrations more than depth of reasoning.
Operators comfortable owning their own interpretation of the numbers.
❌ Where it falls short
Reviewers flag accuracy and speed issues, plus gaps in automated insight. If you want the tool to tell you what changed and why, this is a reporting layer, not a reasoning layer.
😊 Reviews
"Glew reports are easy to segment and export. Data is displayed in easily digestible results with points of reference to previous period and year. For a Shopify-based business, Glew offers more powerful analytical solutions than available to us in Shopify. Sometimes the software is slow to load or glitchy with realtime results. I think the software could also offer better automatic & actionable insights (similar to Google Analytics) base don performance by audience, channel, and product." Verified User, 3.5/5, Glew - G2 Verified Review
"The ease of all of your data being fed into one place. Data was often not accurate and adding new data sources was hard. The visualization was also subpar." Verified User, 1.5/5, Glew - G2 Verified Review
Luca AI differs from Glew.io on one axis that matters at 11pm on a Sunday: Glew hands you the dashboard, and Luca AI hands you the answer plus the reason behind it. If Amazon reporting is the half of your business that keeps breaking, that difference shows up first there.
1.3 Triple Whale [toc=1.3 Triple Whale]
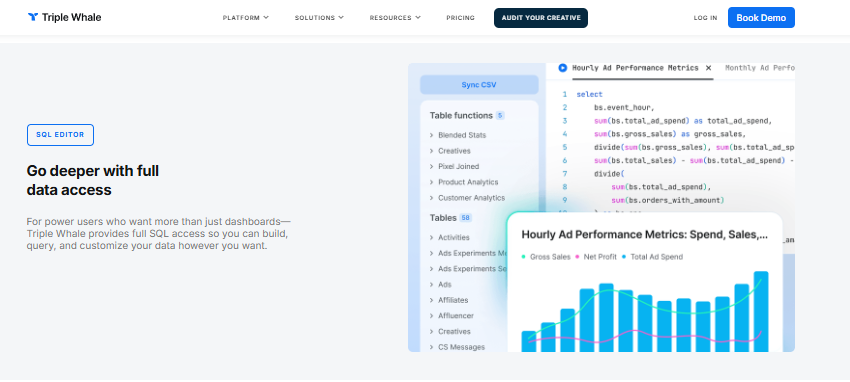
Triple Whale gives power users full SQL access beyond dashboards for deeper ad performance queries.
⭐ Why did we choose this tool?
Triple Whale is the default swap for Shopify-first brands leaving an expensive warehouse contract. It runs its own first-party pixel, blends ad and store data, and layers Moby, its AI assistant, on top. There is a free plan, then revenue-tiered pricing. Be clear about what it is, though. Triple Whale is a marketing attribution and dashboard product. It is not built to reconcile wholesale sell-through or retailer portal data.
Time to first answer: fast, most dashboards work within a day
Data normalization: handled in-platform, users report periodic sync mismatches
Output type: dashboards, creative reports, Moby AI chat summaries
Decision layer: attribution modelling and alerts, marketing scope only
✅ Best for
Shopify DTC brands spending heavily on paid social and search.
Teams whose main question is which ad drove which order.
Operators who want a free tier before committing budget.
❌ Where it falls short
Attribution numbers often disagree with Shopify and with email platforms. Reviewers repeatedly flag this. It also gives you no view of wholesale, retail sell-through, or accounting data. If that gap is your real problem, our comparison of Triple Whale alternatives goes deeper on the trade-off.
😊 Reviews
"Triple Whale is very user-friendly and easy to navigate to find the data you need across multiple channels. Relevant channels like emails, ads, organic, etc are already broken down for you and when looking at the specific channel, you have the option to customize the table displaying the data to choose which metrics are most relevant for your needs. Some data we still notice discrepancies between platforms, for example, tracking ads, and differences in the reported metrics like revenue." Verified User, 4/5, Triple Whale - G2 Verified Review
"Its very easy to use and works good for a multichannel solution. Sometimes it does not update the numbers correctly and has errors with synchronisation." Verified User, 3/5, Triple Whale - G2 Verified Review
1.4 Polar Analytics [toc=1.4 Polar Analytics]
Polar Analytics claims 4,000-plus ecommerce brands and agencies, mostly Shopify-first direct to consumer teams.
⭐ Why did we choose this tool?
Polar Analytics gives Shopify brands warehouse-native reporting without hiring an engineer. You get custom metrics and no-code dashboards on your own data layer. Pricing starts around $300 per month and scales with revenue. One warning before you shortlist it. Polar is Shopify-centric, so Amazon and wholesale coverage is thin. If your title question is "one view across three channels," this tool answers roughly one of them.
📊 Solutions offered
Channel coverage: Shopify plus major ad and email platforms, limited marketplace
Time to first answer: moderate, setup and metric definition take real effort
Data normalization: warehouse-native, some integrations still maturing
Support responsiveness and pricing transparency both draw criticism. Several reviewers describe quoted prices that differ from the Shopify app listing, plus slow integration fixes.
😊 Reviews
"Shortly after onboarding we were assigned an account manager. About a month later, she was laid off and we were never assigned a new account manager. I have the direct email of a support specialist, but the response time has been less than ideal, especially when real-time data is important for our team. We've been attempting to get a handful of other data sources connected (ShipHero and Walmart at this moment) and the process has been long and drawn about because it can take up to a week to hear back from the Polar team." Ben S., Director of Commercial Operations, 4/5, Polar Analytics - G2 Verified Review
"Not impressed compared to price point. I believe this is a great product, and solves many problems for brands with more complex reporting. However, from the get go there were some discrepancy in the pricing. The pricing communicated when installing the app via Shopify was completely different from the one provided by sales after the installation (which was much higher)" Maja, Polar Analytics - TrustPilot Verified Review
1.5 Northbeam [toc=1.5 Northbeam]
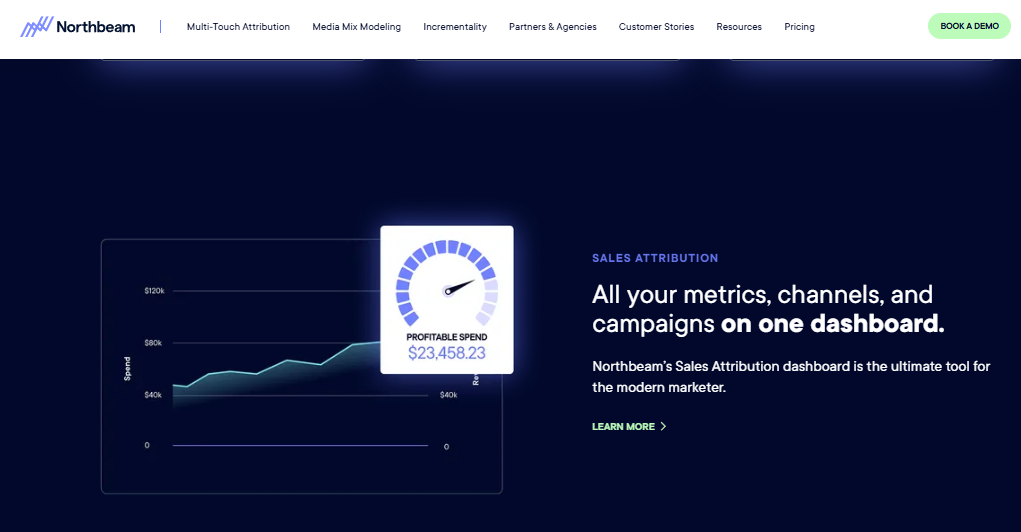
Northbeam models multi-touch attribution and profitable spend, though it stops short of wholesale margin reporting.
⭐ Why did we choose this tool?
Northbeam earns its place if paid media is your biggest controllable cost. It runs multi-touch attribution and media mix modelling to guide spend reallocation. Pricing is quote-based, and it sits at the premium end. Understand the scope limit, though. Northbeam models where credit for a sale belongs. It does not compute landed cost, wholesale margin, or your cash position.
📊 Solutions offered
Channel coverage: ad platforms plus Shopify, no wholesale or retail sources
Time to first answer: slower, models need a data history window to stabilize
Data normalization: attribution-focused, not a general business data layer
Output type: attribution dashboards, media mix reports, spend recommendations
Decision layer: strong on budget allocation, absent on finance and operations
✅ Best for
Brands spending six figures monthly on paid acquisition.
Growth teams who need defensible channel-level credit assignment.
Operators already comfortable with modelled, not deterministic, numbers.
❌ Where it falls short
It is an attribution tool, not a Daasity replacement. If you bought Daasity for omnichannel reporting, Northbeam solves a different problem at a similar price point.
1.6 Lifetimely [toc=1.6 Lifetimely]
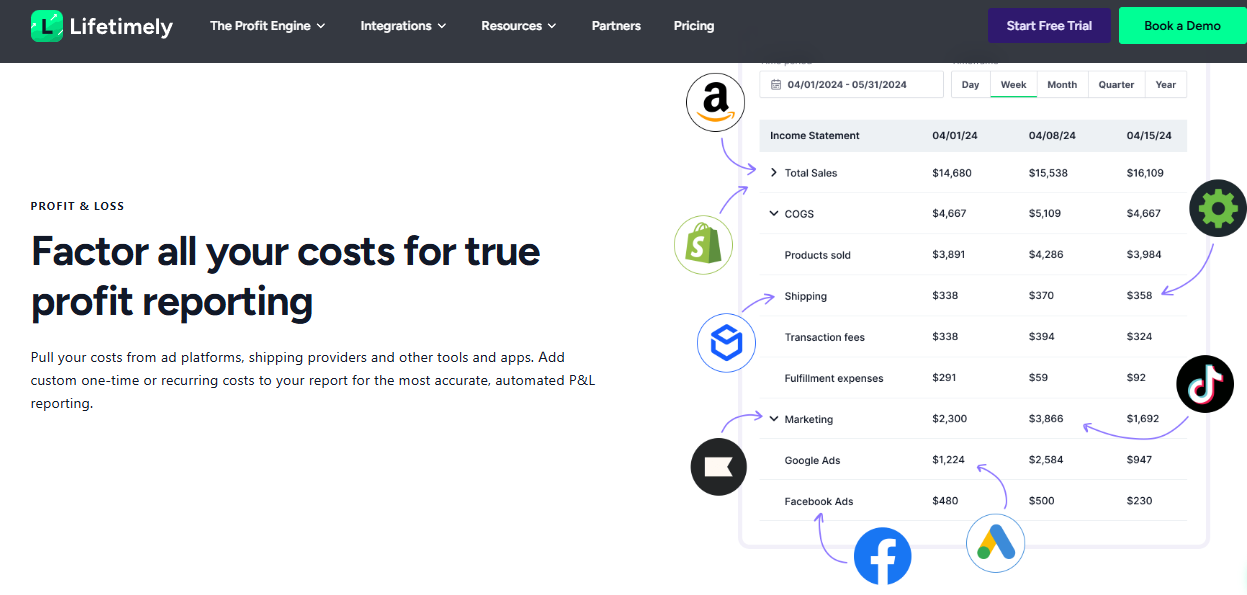
Lifetimely pulls costs from ad platforms, shipping providers and apps into automated profit and loss reporting.
⭐ Why did we choose this tool?
Lifetimely is the cheapest credible option on this list. It is free up to 50 orders per month and tops out near $299 per month, with Amazon data available for about $75 extra. You get lifetime value cohorts and a working profit and loss view. For a brand under $2M, that covers most of what a warehouse contract was doing badly.
📊 Solutions offered
Channel coverage: Shopify core, Amazon via paid add-on, main ad platforms
Time to first answer: fast, dashboards populate shortly after connection
Data normalization: handled in-platform, limited to supported sources
Output type: LTV cohort charts, profit and loss dashboard, email digests
Decision layer: reporting only, no root-cause or recommendation engine
✅ Best for
Shopify brands under $2M watching every software line item.
Teams that mainly need LTV, payback, and a clean profit view.
Operators willing to trade depth for a low monthly cost.
❌ Where it falls short
No wholesale, no retail sell-through, and no syndicated data. Custom reporting is limited, so growing brands outgrow it within a year or two.
1.7 Peel Insights [toc=1.7 Peel Insights]
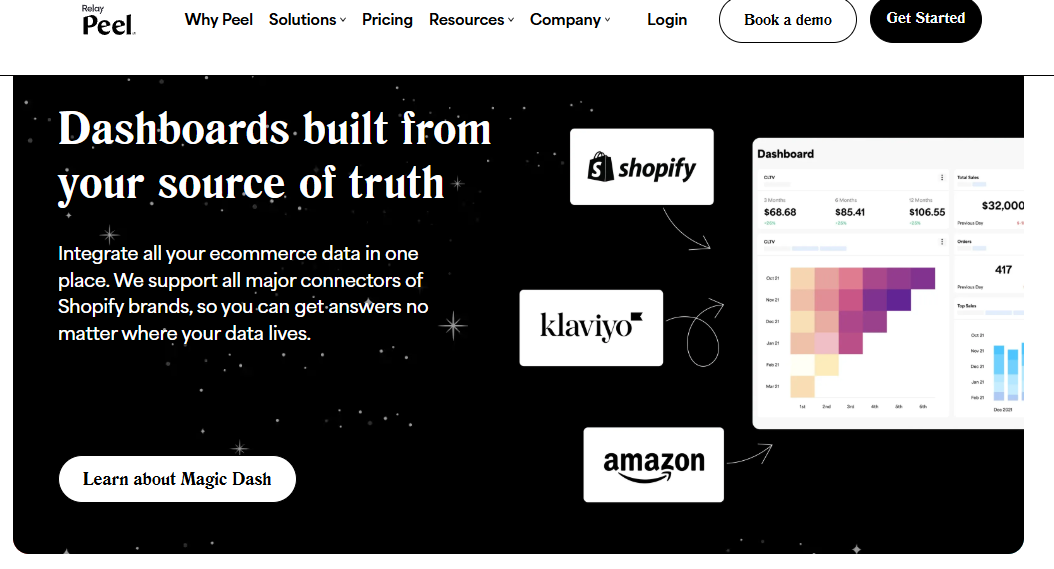
Peel builds dashboards from Shopify, Klaviyo and Amazon connectors, focused on cohort retention and lifetime value.
⭐ Why did we choose this tool?
Peel Insights automates the cohort work most operators never get around to doing. It builds retention curves, repeat-purchase views, and RFM segments without SQL. Pricing runs from free to about $899 per month. Pick it if your product is genuinely repeat-purchase. Skip it if your margin problem lives in fees, freight, and returns.
📊 Solutions offered
Channel coverage: Shopify plus email and SMS platforms, minimal marketplace
Time to first answer: fast on retention questions, narrow beyond them
Data normalization: handled in-platform for supported ecommerce sources
Decision layer: descriptive analytics with alerting, limited prescription
✅ Best for
Consumables and subscription brands with high repeat rates.
Retention leads who need cohort views without an analyst.
Teams layering it alongside a broader reporting tool.
❌ Where it falls short
It is a specialist. Peel will not replace omnichannel reporting, and pairing it with a second tool erodes the cost saving that made you leave in the first place.
1.8 Sellerboard [toc=1.8 Sellerboard]
⭐ Why did we choose this tool?
Sellerboard is the Amazon-side answer that most DTC-focused lists forget. It tracks fee-level profit, FBA reimbursements, and PPC cost per unit. If Amazon is where your margin quietly disappears, this is the sharpest lens on that channel. It will not give you a Shopify plus wholesale view, so treat it as one half of a two-tool setup.
Brands recovering FBA reimbursements they never claimed.
Operators who already have separate Shopify reporting.
❌ Where it falls short
Single-channel by design. Buying it plus a DTC tool recreates the fragmented stack you were trying to consolidate.
1.9 Conjura [toc=1.9 Conjura]
⭐ Why did we choose this tool?
Conjura positions itself around profit rather than vanity metrics, with a stated focus on Amazon and marketplace brands. It allocates costs down to SKU level so you can see which products actually earn. That framing is closer to Daasity's intent than most cheaper tools manage. Verify channel coverage against your own retailer list before signing anything.
📊 Solutions offered
Channel coverage: Amazon and marketplaces primary, DTC secondary
Time to first answer: moderate, cost allocation setup takes configuration
Data normalization: cost and fee mapping across marketplace sources
Decision layer: margin diagnostics with recommendations on product mix
✅ Best for
Marketplace-heavy brands auditing true profit by SKU.
Finance leads who need cost allocation rather than traffic reporting.
Operators comparing Amazon performance against DTC on equal terms.
❌ Where it falls short
Wholesale and retail sell-through coverage is not the focus. Pricing is not publicly listed, which makes budgeting harder than it should be.
1.10 Fivetran plus Looker (Build It Yourself) [toc=1.10 Fivetran plus Looker]
⭐ Why did we choose this tool?
This is the honest ceiling of the list. Fivetran moves your data, dbt models it, and Looker visualizes it. You own everything and you can model wholesale however you like. The arithmetic is the catch. Budget roughly $300 to $1,500 per month for Fivetran, $3,000 or more for Looker, plus about $120,000 a year for the engineer who maintains it.
📊 Solutions offered
Channel coverage: anything with an API, including EDI and retailer feeds
Time to first answer: slowest, measured in months not days
Data normalization: fully manual, you write and maintain the models
Output type: whatever you build, dashboards and SQL-driven reports
Decision layer: none out of the box, your team supplies the reasoning
✅ Best for
Brands above roughly $50M with a data engineer already on payroll.
Teams with unusual data requirements no vendor supports.
Connectors break, schemas drift, and the maintenance never ends. Below $50M, the salary line alone usually costs more than the decisions it improves. Teams in that band usually get further with an AI-powered BI layer than with a pipeline they have to staff.
😊 Reviews
"It seems to have the potential of being useful. This potential isn't easily realized, but it's there. It is incredibly complex and difficult to use. I get thwarted at every step when I'm trying to create reports. I am a power user of Excel and can generally pick up software very easily. Looker Studio is completely unintuitive. Every single thing is a challenge, adding data sources, adding new calculated fields, and, god forbid, blending data." Verified User, 0/5, Looker Studio - G2 Verified Review
Luca AI sits at position one for a structural reason, not a scoring one. Every other tool here hands you a reporting surface and leaves the interpretation to you at 11pm on a Sunday. Luca AI normalizes sources at ingestion, then answers the margin question directly and pushes the next anomaly to Slack before you think to look.
Q2. What Should a Daasity Replacement Actually Compute, and How Did We Score Each Tool? [toc=2. Scoring Criteria]
Every tool was scored out of 100: Omnichannel Scope 25%, Decision Output 25%, Time to First Answer 20%, Pricing Transparency 15%, and Verified Reviews 15%. Zero to 20 earns one star, 21 to 40 earns two, and 81 to 100 earns five. Decision Output tests three things: contribution margin per SKU after every landed cost, blended CAC, and inventory turnover by channel. Luca AI scores five stars.
⭐ The weighting, and why each criterion earns its share
Scoring Rubric for Daasity Alternatives
Criterion
Weight
Why it carries this much
Omnichannel Scope
25%
60% of Amazon sellers run omnichannel, so DTC-only coverage fails most readers
Decision Output
25%
A report you cannot act on costs the same as one you can
Time to First Answer
20%
Daasity's four to eight week setup is the second most cited leave trigger
Pricing Transparency
15%
Five ranking pages publish five different Daasity prices
Verified Reviews
15%
Weighted low on purpose, because the review pools here are thin
💸 Gross margin is the wrong scoring axis
I sat with a founder who slid an invoice across the table. Her bestseller showed 72% gross margin. She was proud of it, and she had every right to be.
Twenty minutes later, she was crying. Once we loaded in freight, returns, fee variance, and support time, contribution margin came back at 8%. Gross margin only tells you what the thing cost to make. It says nothing about what it costs to sell.
📊 The three numbers operators retreat to
One operator on Reddit described drowning in dashboards and still making bad calls. The fix was not a better chart. It was three numbers tracked monthly.
Margin per SKU after all fees. Blended CAC. Inventory turnover. Luca AI is scored on Decision Output because it allocates support load, shipping, and returns down to unit level, which is where that 8% number lives.
"Calculate your expenses first, then determine your ACOS to check if it's exceeding your profit margin." r/ecommerce Reddit Thread
✅ Monitoring versus recommending, as a testable question
Ask any vendor one thing on the demo. Does this tool tell me something I did not ask it? Monitoring is the old game. The move worth paying for is from descriptive to prescriptive.
Most tools on this list answer no. Ask Luca AI to watch a metric and it pushes the anomaly to Slack or email without you opening anything.
📈 The scoring table
Star Ratings Across All Ten Alternatives
Tool
Stars
Luca AI
⭐⭐⭐⭐⭐
Glew.io
⭐⭐⭐⭐
Triple Whale
⭐⭐⭐⭐
Polar Analytics
⭐⭐⭐
Northbeam
⭐⭐⭐
Lifetimely
⭐⭐⭐
Peel Insights
⭐⭐⭐
Sellerboard
⭐⭐⭐
Conjura
⭐⭐⭐
Fivetran plus Looker
⭐⭐
⚠️ What this scoring cannot tell you
Two disclosures. First, I built Luca AI, so read its placement with that in mind. Second, review pools here are small, and thin samples make sentiment scores unreliable.
"Its very easy to use and works good for a multichannel solution. Sometimes it does not update the numbers correctly and has errors with synchronisation." Verified User, 3/5, Triple Whale - G2 Verified Review
Luca AI carries five stars on Decision Output for one reason worth checking yourself. The 72% gross margin product that is really an 8% contribution margin product arrives as an alert, not as a discovery you make in year three. That is the difference between reporting and reasoning.
Q3. Why Are Brands Leaving Daasity in 2026, and Who Should Stay? [toc=3. Why Brands Leave]
Brands leave for price, time, and economics, not for missing features. The Shopify App Store listing shows $1,899 per month, while agency write-ups report real deployments at $1,500 to $5,000 per month on four to eight week implementations with annual contracts. Ecommerce net profit fell from 17.7% to 10.6% over a decade. Stay if you are a $20M-plus omnichannel brand without a data team.
💰 Five sources, five different prices
Nobody on this search results page agrees on what Daasity costs. That alone should slow your evaluation down.
Published Daasity Pricing, Reconciled
Source
Published price
Note
Knowi, citing Shopify App Store
$1,899 / month
Verified June 2026
Attn Agency
$199 / $399 / $699 tiers
Scales on rolling three-month revenue average, 14-day trial
ShelfMerge
$499 / month
Starting price
Niblin
$1,000+ / month
Starting price
d-dat
$1,500 to $5,000 / month
Real deployments, annual contracts
Treat every figure here as directional. Pricing scales with your topline, so the number you get is the number your revenue earns.
⏰ The second trigger is time, not money
Four to eight weeks of implementation is the part buyers underestimate. That window is not passive. Someone on your team is mapping fields and reconciling exports while the annual contract clock runs.
Pricing surprises compound the frustration. Operators evaluating this category run into quoted numbers that do not match the app listing.
"Not impressed compared to price point. I believe this is a great product, and solves many problems for brands with more complex reporting. However, from the get go there were some discrepancy in the pricing. The pricing communicated when installing the app via Shopify was completely different from the one provided by sales after the installation (which was much higher)" Maja, Polar Analytics - TrustPilot Verified Review
📉 Why a five-figure reporting line looks different now
At 17.7% net margin, a $1,899 monthly tool is a rounding error. At 10.6%, it is a real decision. That is the whole story behind this keyword's search volume.
Stop saying you are reinvesting profits as a reason not to track net contribution margin. If you cannot name your margin per SKU after fees, the tool is not the problem.
✅ Who should not switch
Some brands should renew and stop reading. The honest profile looks like this.
You run $20M-plus across DTC, marketplace, and physical retail.
You need Nielsen or SPINS syndicated data, which almost nothing else carries.
You have no analyst, and the managed service is doing that job well.
"Shopify, FB, GA and more... this business seems overwhelmed with reporting tools. Yet requirements for reports that cut across retail, wholesale, marketing, ..." r/ecommerce Reddit Thread
⚠️ The trap in switching for price alone
Cheaper tools win the subscription comparison and lose the scope one. Most of them cannot see wholesale at all. Moving to save $1,200 a month and losing your retail sell-through view is not a saving. Weigh it against your full ecommerce tech stack before you sign.
Luca AI prices on flat monthly tiers rather than a rolling revenue average. A data layer that bills more as your topline grows charges you hardest in the exact quarter your margin is thinnest.
Q4. What Does "Shopify, Amazon and Wholesale in One View" Actually Require? [toc=4. Omnichannel Data Requirements]
Six things: Shopify order and fee data, Amazon Seller Central including FBA and referral fees, Walmart Marketplace, retailer portal or EDI sell-through, syndicated data such as Nielsen or SPINS, and a normalization layer that reconciles conflicting retail calendars. Polar Analytics is Shopify-only. Triple Whale is Shopify-first. Among the popular alternatives, only Glew.io and Luca AI clear the wholesale bar.
✅ The six-item checklist, and how each one breaks
Run this list against any vendor before you look at pricing.
Shopify orders plus fees, or your margin math starts wrong.
Amazon Seller Central with FBA, referral, and storage fees, not just revenue.
Walmart Marketplace, since 36% of Amazon sellers also sell there.
Retailer portal or EDI sell-through, which is where wholesale actually lives.
Syndicated data like Nielsen or SPINS, rare outside Daasity.
Here is the failure that eats implementation timelines. One brand books retail weeks on a 5-5-4 calendar. Its retail partner uses 3-3-2. Neither is wrong.
Your tool now has two definitions of "week" and no opinion about which to trust. Luca AI resolves this at ingestion, so the reconciliation happens before you ask your first question, not during a four week cleanup.
📊 Raw access is not an answer
Warehouse access sounds like the win. It usually is not. Operators describe getting exactly what they asked for and still being stuck, because what arrives is logs, not decisions.
Shopify says this quietly in its own guidance. Use Sales by channel for revenue reality, and GA4 model comparison for attribution influence. That is the platform admitting native reporting does not unify anything.
❌ Pass and fail across the list
Channel Coverage Pass and Fail by Tool
Tool
Shopify
Amazon
Wholesale / Retail
Luca AI
✅
✅
✅
Glew.io
✅
✅
✅
Triple Whale
✅
⚠️ Limited
❌
Polar Analytics
✅
⚠️ Limited
❌
Northbeam
✅
❌
❌
Lifetimely
✅
⚠️ Paid add-on
❌
Peel Insights
✅
❌
❌
Sellerboard
❌
✅
❌
Conjura
⚠️ Secondary
✅
❌
Fivetran plus Looker
✅
✅
✅ if you build it
Six of the ten most-recommended alternatives fail the wholesale column outright. That is the gap this whole keyword hides, and it is the reason omnichannel platform selection deserves more scrutiny than price.
⏰ Three questions for the demo call
Ask these before anyone shows you a dashboard. They take four minutes and save four weeks.
Show me Amazon referral and FBA fees landing at SKU level, live.
How do you reconcile my retailer's 3-3-2 calendar with my 5-5-4 books?
What happens to a report when a connector schema changes next quarter?
If a vendor cannot answer the second question cleanly, you are buying a Shopify tool with an omnichannel label.
Luca AI clears the wholesale bar because it normalizes every connected source on ingestion, including retail calendar conflicts. Ask it what a retailer's sell-through did against your DTC margin last month, and the answer comes back reconciled, not as two exports you stitch yourself.
Q5. Which Alternative Fits Your Revenue Band and Channel Mix? [toc=5. Fit by Revenue Band]
Under $2M on Shopify alone, Triple Whale's free tier or Lifetimely is enough. Between $2M and $20M across Shopify and Amazon, Polar Analytics or Triple Whale's paid tiers fit. Above $20M with wholesale or retail distribution, Glew.io is the closest like-for-like replacement. G2 reviewers rated Glew higher on meeting business needs, while Daasity won on support quality and roadmap direction.
📊 The three-way head-to-head
Glew.io, Triple Whale, and Polar Analytics Compared
Factor
Glew.io
Triple Whale
Polar Analytics
Channel scope
DTC, marketplace, POS, B2B
Shopify-first, limited Amazon
Shopify-only
Pricing model
Quote-based
Free tier, then revenue-tiered
From about $300/month, revenue-tiered
AI layer
Reporting, light automation
Moby assistant, marketing scope
Custom metrics, no reasoning layer
Support signal
Praised when named reps stay
Mixed on data reconciliation
Reviewers report slow response times
Luca AI belongs in a fourth column on scope, since it reads commerce, ads, accounting, and support data in the same query rather than marketing alone. That is the practical difference between a dashboard and an intelligence layer.
⭐ The router: revenue band against channel count
Pick your row, not your favorite brand.
Under $2M, one channel: Lifetimely or Triple Whale free. Spend the saved money on inventory.
$2M to $20M, two channels: Polar Analytics or Triple Whale paid. Add Sellerboard if Amazon fees are the mystery.
$2M to $50M, two or three channels, no analyst: an intelligence layer beats a dashboard. Ask Luca AI to run the weekly margin report instead of building it.
$20M-plus with wholesale: Glew.io, or stay on Daasity.
⚠️ Where each one breaks as you grow
Every tool here has a ceiling, and vendors rarely tell you where it sits.
Lifetimely breaks when you add a second sales channel. Triple Whale breaks when finance asks a question marketing data cannot answer. Polar breaks the day Walmart or a retailer portal enters your mix. Glew breaks when you want the tool to interpret, not just display.
"I really like how we can do most everything that I can do in Excel, but have it automated to avoid having to run into occasional formula or pivot table errors when updating data in dashboards there. The Looker dashboard build is very functional, flexible, and relatively user friendly that provides me with the real time insights I need to be able to pivot my business quickly." Verified User, 5/5, Glew - G2 Verified Review
❌ The bolt-on AI problem
Most of these products added AI to an existing dashboard. That ordering matters. Legacy BI has fallen behind on how AI-ready it actually is, and a chat box on top of old architecture inherits the old limits.
Luca AI was built the other way around, with reasoning first and the dashboard as one output among several. If you are comparing that model across the category, our roundup of AI-powered BI tools lays out the architectural split.
"Very useful for top down view for a very fast reporting. Supports and tracks many different platforms as well. almost a no brainer for pulling out stats quickly. However, some stats are not so accurate in pulling in data; they do not tally with shopify" Verified User, 4/5, Triple Whale - G2 Verified Review
💸 Read the sample size before you trust the rating
Daasity's G2 profile carries 11 reviews. Glew and Polar sit in the dozens. Triple Whale sits far higher.
Any "users prefer X" claim built on 11 responses is not evidence. It is a vibe with a star icon attached.
Luca AI fits the $2M to $50M band where the alternatives hand you a faster dashboard. It simulates the scenario, traces the root cause, and pushes the finding to Slack or email on the schedule you set.
Q6. Should You Build It Yourself With Fivetran and Looker Instead? [toc=6. Build vs Buy]
Build only if you already employ a data engineer. The stack runs roughly $300 to $1,500 per month for Fivetran, $3,000 or more per month for Looker, plus dbt and about $120,000 a year for the person maintaining it. That crossover typically clears only above roughly $50M in revenue. What you buy is ownership, not speed.
💰 The arithmetic, laid out honestly
Run the numbers before the architecture debate starts.
Annual Cost of a Self-Built Data Stack
Line item
Annual cost
Fivetran ingestion
$3,600 to $18,000
Looker licensing
$36,000-plus
dbt and warehouse compute
Variable, rarely zero
Data engineer
About $120,000
Total
Roughly $160,000-plus
Against a $1,899 monthly managed contract, the build costs seven times more before it produces a single answer.
⚠️ What you own versus what you maintain
Ownership is real. So is the maintenance nobody scopes.
Connectors break when platforms change their APIs. Schemas drift as you add SKUs and channels. Someone has to notice, fix, and re-test the model, every quarter, forever. That someone is your engineer, and they are not building anything new while they do it.
Tools such as Daasity, Glew, and similar sit between the raw pipeline and the answer, which is exactly the layer a DIY stack asks you to staff yourself. The same trade-off shows up when teams evaluate reverse ETL tools against a managed layer.
💸 The founder who paid eight figures for this lesson
Ari Tulla, who ran ELO Health, spent roughly $10 million building an internal system to turn data into meaning. His conclusion afterwards was blunt. Language models arrived and were ten times better than what the money bought.
I find that story more persuasive than any cost table. The build was not incompetent. The ground moved.
⏰ Speed is the hidden cost
A build takes months. A managed layer takes weeks. An intelligence layer takes days.
Manual data manipulation that used to take two weeks now runs in about 90 seconds when the reasoning sits on top of clean data. Luca AI targets that gap, which is why it suits brands without an engineer rather than those with one.
"Glew helps us acheive accurate channel revenue attribution. Not only can we view by channel, but even by campaign. This helps us see what channel/campaign is working and put our dollars in the right place. With many different features, it's seems difficult to find the exact report I'm looking for, and to be able to get channel revenue for a whole segment of products, rather than have to go through each product indiviudually" Verified User, 5/5, Glew - G2 Verified Review
❌ When the DIY answer is still wrong
Even teams with engineers hit the interpretation wall. The pipeline delivers, and the reports still go unread.
"It seems to have the potential of being useful. This potential isn't easily realized, but it's there. It is incredibly complex and difficult to use. I get thwarted at every step when I'm trying to create reports." Verified User, 0/5, Looker Studio - G2 Verified Review
✅ The crossover rule
State it plainly. Below $50M with no engineer, buy. Above $50M with unusual data needs and an engineer already on payroll, build.
Everyone in between should buy, then revisit in eighteen months. Sunk-cost pride is the most expensive line in this whole comparison. Sequence the decision against the rest of your analytics platform choices rather than in isolation.
Luca AI is built for the band between spreadsheet triangulation and a real data team. In that band, the engineer maintaining your connectors costs more than the decisions the pipeline was supposed to improve.
Q7. What Does Switching Actually Cost, and How Do You Migrate in 30 Days? [toc=7. Switching Cost and Migration]
Subscription price is half the bill. Budget for data export, lost historical modeling, dashboard rebuild, and retraining, typically three to six weeks of internal time. Then run the switch in four weeks. Export 24 months of order, ad, and cost data, reconcile one month against your P&L to the dollar, rebuild only the reports you opened last quarter, set alert thresholds, and cancel. Luca AI removes the rebuild week entirely.
💸 The switching cost nobody publishes
Every ranking page compares monthly price. None of them price the move itself.
Hidden Costs of Switching Analytics Vendors
Cost line
Typical load
Notes
Data export
2 to 5 days
Do this before the contract lapses
Historical modeling loss
Ongoing
Modeled history rarely transfers
Dashboard rebuild
1 to 3 weeks
The single biggest hidden line
Team retraining
3 to 5 days
New definitions, same arguments
For an $8M Shopify plus Amazon brand, that internal time often costs more than the first year of the cheaper subscription.
⏰ The four-week plan
Give each week one owner and one output.
Four-Week Migration Plan
Week
Owner
Output
1
Ops
24 months of order, ad, fee, and cost data exported
2
Finance
One month reconciled against the P&L, to the dollar
3
Growth
Only the reports actually opened last quarter, rebuilt
4
Founder
Alert thresholds set, old contract cancelled
Ask Luca AI to reconcile week two by comparing connected accounting data against channel revenue, rather than doing it by hand in Sheets.
⚠️ Three things that go wrong
I have watched all three happen, usually in the same month.
Historical data gets left behind because nobody exported before the contract lapsed. Amazon fee mapping does not match the old model, so margins shift and finance stops trusting the tool. Alerts get created and never assigned, so they fire into an empty channel. A clean data collection checklist prevents the first two.
✅ Keep a human on QA
Do not let automation grade its own homework. A premium bike brand once published a homepage image of a $20,000 bike with the rear derailleur mounted on the front wheel. Unsupervised automation put it there.
Verify your first month of alerts by hand. Luca AI pushes anomalies with the reasoning attached, which makes that check fast, but the check still belongs to a person.
"Mobile limitations and the platform isn't a plug-and-play solution, it requires time and effort to learn its advanced features and capabilities. There are instances that certain intergrations are not yet fully functioning so you have to always check with Customer Support." Charlene R., Head of Operations, HR & Culture, 5/5, Polar Analytics - G2 Verified Review
📊 Make it a monthly discipline, not a project
Migration is not the finish line. Unit economics move constantly. Shipping rates rise, return rates shift with seasons, and CAC drifts.
Put contribution margin per SKU, blended CAC, and inventory turnover on a monthly review. Whichever tool you pick should produce that in one click, or you picked wrong. Anchor the cadence to the KPIs that actually move cash.
"Occasionally, metrics between sources need a quick manual check to ensure alignment." Verified User, 5/5, Triple Whale - G2 Verified Review
⭐ What I am still watching
My read is that within eighteen months, the dashboard rebuild week disappears from migrations entirely. Reasoning layers make stored charts optional.
I could be wrong about the timing. If you run wholesale and you have tested this, I would genuinely like to hear what broke.
Luca AI collapses week three to an afternoon, because there is no dashboard layer to rebuild. What moves across is your connected data and the three questions you were going to ask those dashboards anyway.
FAQ's
How much does Daasity actually cost, and why do published prices disagree?
Published Daasity pricing is genuinely inconsistent across the web, and that inconsistency is worth understanding before you budget.
The Shopify App Store listing has been cited at $1,899 per month.
Agency tier breakdowns cite $199, $399, and $699 monthly plans with a 14-day trial.
Comparison sites publish $499 per month and $1,000-plus per month starting points.
Real deployments have been reported at $1,500 to $5,000 per month on annual contracts.
The reason for the spread is that pricing scales on a rolling three-month average of total revenue. Two brands on identical feature sets pay very different amounts. The published number is a starting point, not your number.
Our advice is simple. Treat every figure you read, including ours, as directional, and get a live quote against your own trailing revenue before you compare anything. Then compare the quote against the decisions the tool will actually change, not against the feature list.
Luca AI prices on flat monthly tiers rather than a rolling revenue average, which matters because a revenue-scaled bill peaks in the exact quarter your margins are thinnest.
What is the cheapest credible Daasity alternative for a smaller brand?
Lifetimely is the cheapest credible option on our list. It is free up to 50 orders per month, tops out near $299 per month, and adds Amazon data for roughly $75 extra. Triple Whale offers a free plan, and Polar Analytics starts around $300 per month.
Before you switch on price alone, check three things.
Channel scope. None of these three match Daasity on wholesale, retail sell-through, or syndicated data such as Nielsen and SPINS.
Ceiling. Lifetimely breaks the moment you add a second real sales channel.
Stacking cost. Buying a cheap DTC tool plus a separate Amazon tool rebuilds the fragmented stack you were trying to consolidate.
Cheapest is the right answer for a single-channel Shopify brand under $2M in revenue. Spend the savings on inventory rather than software.
Above that, the honest comparison is not subscription price. It is cost per decision changed. We walk through that framing in our guide to tracking ecommerce unit economics, because a $99 tool that never changes a purchase order is more expensive than a $499 tool that does.
Which Daasity alternatives actually handle Shopify, Amazon, and wholesale in one view?
Very few of them do, and this is the gap most comparison articles skip. A tool has to clear six requirements before it can honestly claim one unified view.
Shopify order and fee data.
Amazon Seller Central including FBA, referral, and storage fees.
Walmart Marketplace, since a large share of Amazon sellers also list there.
Retailer portal or EDI sell-through data.
Syndicated data such as Nielsen or SPINS, which is rare outside Daasity.
A normalization layer that reconciles conflicting retail calendars, such as 5-5-4 against 3-3-2.
Measured against that list, Polar Analytics is Shopify-only, Triple Whale is Shopify-first, Northbeam is attribution-only, and Sellerboard is Amazon-only. Glew.io clears the wholesale bar. A self-built Fivetran plus Looker stack clears it too, if you staff the build.
Luca AI normalizes every connected source at ingestion, including retail calendar conflicts, so the reconciliation happens before your first question rather than during a four-week cleanup. If channel breadth is your real constraint, our breakdown of omnichannel ecommerce analytics explains what to audit on a vendor call.
What is the difference between Glew.io and Daasity?
Both serve omnichannel brands, but they solve the problem at different layers.
Glew.io leads with breadth of integrations, prebuilt dashboards, and segmentation across DTC, marketplace, POS, and B2B sources. It also offers a managed warehouse tier with Looker dashboards.
Daasity leads with warehouse-native modelling, custom data infrastructure, and a managed service layer aimed at larger omnichannel brands.
On G2, reviewers rated Glew higher on meeting business needs, while Daasity scored better on support quality and roadmap direction. One caution: Daasity's G2 profile carries only 11 reviews, so treat any sentiment comparison as directional rather than conclusive.
The practical split is this. If you need more sources connected quickly and are comfortable interpreting the numbers yourself, Glew fits. If you need custom modelling and a managed team doing analyst work, Daasity earns its price at $20M-plus.
Neither is a reasoning layer. Both hand you a reporting surface and leave the interpretation to you on a Sunday night. That distinction, described in our piece on ecommerce business intelligence, is what separates monitoring from recommending.
What does switching away from Daasity actually cost in time and money?
The subscription saving is only half the picture. Every comparison article prices the new tool and ignores the move itself.
Data export: two to five days, and it must happen before the contract lapses.
Historical modeling loss: modeled history rarely transfers to a new vendor.
Dashboard rebuild: one to three weeks, the single biggest hidden line.
Team retraining: three to five days of new metric definitions.
For an $8M Shopify plus Amazon brand, that internal time frequently costs more than the first year of the cheaper subscription. Note also that Daasity implementations are reported at four to eight weeks, and most articles never publish the equivalent timeline for the tool they recommend.
Run the switch in four weeks. Export 24 months of order, ad, and cost data. Reconcile one month against your profit and loss statement to the dollar. Rebuild only the reports you actually opened last quarter. Set alert thresholds, verify the first month by hand, then cancel.
Luca AI removes the rebuild week because there is no dashboard layer to recreate, which is the same logic behind our approach to ecommerce data integration.
Enjoyed the read? Join our team for a quick 15-minute chat — no pitch, just a real conversation on how we’re rethinking Ecommerce with AI - Luca
Loading Schedule...
Your AI Co-Founder is here.
Here’s why:
Shopify, Meta, Xero - one brain.
"Should I scale?" Answered with real data.
Growth capital. No applications. One click.
Thank you! Your submission has been received! Please book a time slot for the Meeting
Oops! Something went wrong while submitting the form.