10 Best Self-Service Analytics Tools for Ecommerce Teams in 2026
14
mins read
TL;DR
The ten tools we rank are Luca AI, Triple Whale, Polar Analytics, Lifetimely by AMP, Peel Insights, Daasity, Metorik, Metabase, Looker Studio, and Microsoft Power BI.
Scoring used five weights: Cross-Functional Intelligence 25%, Depth of Reasoning 20%, Setup and Usability 20%, Pricing Transparency 20%, and User Reviews 15%. No vendor paid for placement.
Self service BI is the tooling category. Self service analytics is the outcome. BI shows blended ROAS, while self service analytics tells you which SKU to reorder and why.
Gross margin misleads reorder decisions. A 72 percent gross-margin bestseller landed at 8 percent contribution margin once shipping, returns, discounts, fees, and CAC were loaded in.
Budget by GMV, not by seat. Free stack under €500K, €100 to €500 monthly between €500K and €5M, consolidation above €5M, plus the hidden modelling tax.
Choose by who self-serves, connect six sources, agree ten metric definitions, then measure adoption by questions self-answered rather than logins.
Q1. What Are the 10 Best Self-Service Analytics Tools for E-commerce in 2026? [toc=1. Best Tools Ranked]
The 10 best self-service analytics tools for e-commerce in 2026 are Luca AI, Triple Whale, Polar Analytics, Lifetimely by AMP, Peel Insights, Daasity, Metorik, Metabase, Looker Studio, and Microsoft Power BI. Luca AI ranks first because it sits as an AI reasoning layer over your store data, extracting the relevant slice, naming the root cause, and simulating the alternative instead of rendering another chart.
I picked these ten after watching operators try to answer one question without an analyst: which SKU is actually making money. Most tools on this list answer part of it. Some chart your ad spend. Some rebuild your P&L. A few can reason across both. The gap between those groups is wider in 2026 than it was two years ago, and price is not what separates them. Reasoning depth is. Here is the list, then the table, then the detail.
Looker Studio Best for free dashboards on Google data
Microsoft Power BI Best for general business intelligence at low seat cost
📊 Comparison Table
10 Best Self-Service Analytics Tools for E-commerce in 2026
Tool
Key Capabilities
Best For
Pricing
Luca AI ⭐⭐⭐⭐⭐
Plain English querying, root cause analysis, predictive reorder and sales alerts, automated Slack and email reports, unified data across commerce, ads, and accounting
Shopify brands at €1M to €5M revenue with data nobody has time to read
Open source querying, dashboards, SQL and no code question builder
Teams with a warehouse and light SQL skills
Free (self hosted) to paid cloud plans
Looker Studio ⭐⭐
Free dashboards, GA4 and Google Ads connectors, sharing
Stores validating reporting before paying for anything
Free to paid Pro tier
Microsoft Power BI ⭐⭐⭐
Enterprise BI, data modelling, DAX, Copilot features
Teams with an analyst and mixed business data
From $14 / user / Month
1.1 Luca AI [toc=1.1 Luca AI]
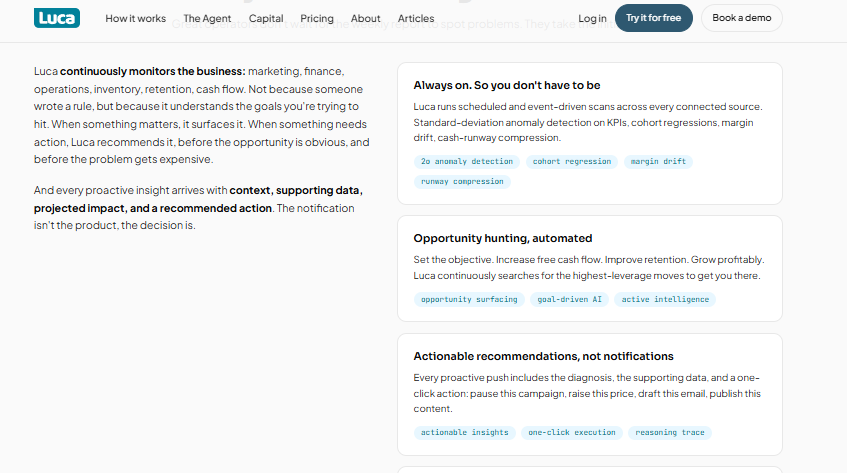
Luca AI continuously monitors marketing, finance, inventory and cash, surfacing recommended actions before problems get expensive.
⭐ Why Did We Choose This Tool?
I built Luca AI, so I will be direct about why it sits at position one. Luca AI is not another dashboard with a chat box bolted on. It is an AI layer over your store data that reasons across commerce, ads, inventory, and accounting in a single pass. Most analytics tools added AI. Luca is AI. That architecture is the reason it answers questions the other nine route to a human analyst. I could be wrong about the ranking order below us. I am not wrong about this distinction.
📊 Core Evaluation Metrics
Cross functional reasoning: Commerce, marketing, finance, accounting, banking, and ops in one model
Query method: Plain English chat, no SQL, no dashboard building
Proactive monitoring: 24/7 scanning with Slack, email, and app alerts on ROAS, CAC, and inventory
Root cause analysis that names the blockers behind a goal you set
Anomaly alerts pushed to Slack, email, or mobile without opening a dashboard
Scenario modelling for pricing, spend, and inventory decisions
😊 Best For
Shopify and WooCommerce brands in the €1M to €5M revenue band
Teams with no analyst, no data engineer, and no appetite for SQL
Operators sitting on years of unused data across eight to twelve tools
❤️ Case Study
What was the problem? A European womenswear brand doing roughly €3M a year ran denim buys on gut feel. Each new style meant a five figure commitment across sizes 23 to 32. Their margin reporting stopped at gross margin, so returns and shipping never entered the buy decision.
How Luca AI helped? Luca AI connected Shopify, Meta, Klaviyo, and Xero, then rebuilt margin at SKU level with returns, shipping, discounts, and fees loaded in. The team asked questions in plain English instead of waiting on a monthly export.
What was the outcome? ⏰ Their pre season analysis dropped from three weeks of manual work to a single afternoon. 💰 Two denim styles that looked healthy on gross margin were cut before the reorder, and the buy budget moved to styles with proven contribution margin.
You are under roughly €500K revenue with thin data to reason against
You already employ a data team running a governed warehouse
You need a marketing attribution pixel, which Luca AI is not and does not replace
Luca AI earns position one on architecture, not on my byline. It reasons across marketing, finance, and operations in one pass, then pushes what it finds to you before you think to ask.
1.2 Triple Whale [toc=1.2 Triple Whale]
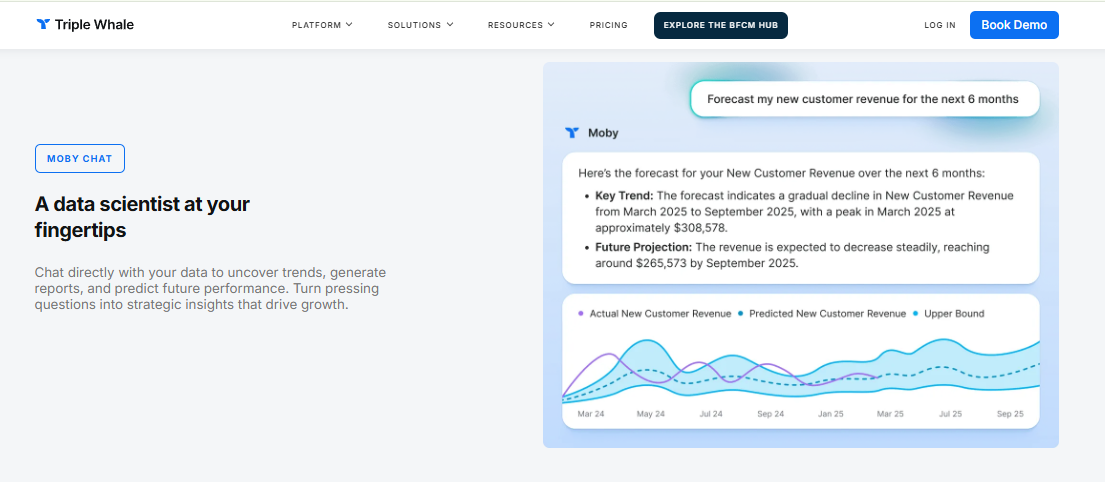
Triple Whale Moby Chat forecasts six months of new customer revenue from connected store data.
⭐ Why Did We Choose This Tool?
Triple Whale is the default answer when a DTC operator asks where their revenue came from. Its first party pixel reconstructs conversions that iOS and cookie loss break. That matters when Meta and Google both claim the same sale. It is on this list because it solves attribution better than anything else here.
It is also the tool most often oversold. Triple Whale sees marketing and commerce well. It does not see your accounting ledger, so it cannot answer a cash flow question.
📊 Core Evaluation Metrics
Cross functional reasoning: Commerce and marketing only, no accounting or banking layer
Query method: Dashboards plus Moby AI agents for automated analysis
Proactive monitoring: Threshold notifications on marketing metrics
Predictive layer: Marketing mix modelling for budget allocation
Data prep: Managed warehouse with first party pixel collection
✅ Solutions Offered
First party pixel attribution across Meta, Google, and TikTok
Real time profit dashboard for blended performance
Creative analytics for ad level decisions
Moby AI agents for scheduled marketing analysis
Marketing mix modelling for spend reallocation
😊 Best For
Shopify DTC brands running paid media across two or more channels
Stores spending $15,000 or more per month on ads, where the maths works
Marketing led teams whose main open question is channel attribution
💬 Reviews
"Triple Whale is our source of truth for marketing data. The integrations are solid, and we trust the data because we've verified its accuracy ourselves." — Verified User in Health, Wellness and Fitness, 5/5, Triple Whale - G2 Verified Review
"We tried Triple Whale too but it felt super bloated with useless features (we only need order attribution with custom pixel) and their pixel tracking is just a black box." — Shopify store owner, r/shopify Reddit Thread
💰 Pricing
Free plan available. Paid tiers run $1,490 to $4,489.97 per year on G2 listed pricing, roughly $124 to $374 per month.
⚠️ Not For You If
You spend under $15K per month on ads, where the price to value ratio gets hard to defend
Your open question is cash flow or SKU profitability rather than channel credit
You want one system covering finance and operations alongside marketing
Luca AI takes a different path here. It does not compete on pixel attribution, and it will not replace one. It reasons across the accounting and inventory layers that attribution tools never see.
1.3 Polar Analytics [toc=1.3 Polar Analytics]
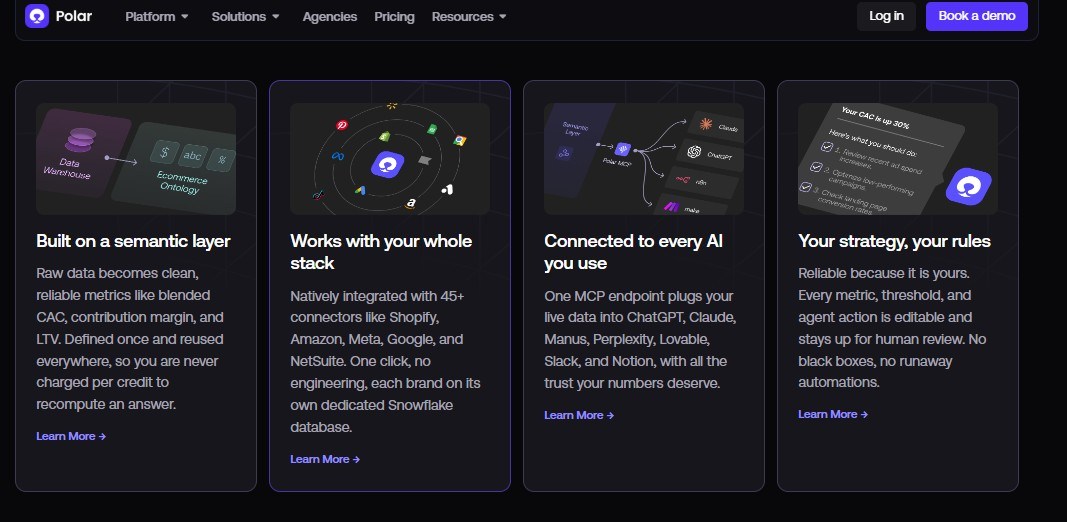
Polar Analytics builds blended CAC and contribution margin on a semantic layer across connectors.
⭐ Why Did We Choose This Tool?
Polar Analytics is the closest thing to a no code Shopify data team. It pulls Shopify, Meta, Google, and Klaviyo into one dashboard without a developer. Operators who hate building reports tend to stick with it.
It holds 4.7 out of 5 from 23 reviews on G2, and reviewers name the onboarding team as often as the product. That is a real signal for a lean store.
📊 Core Evaluation Metrics
Cross functional reasoning: Commerce and marketing, no accounting ledger
Query method: No code dashboards with custom metrics and dimensions
Proactive monitoring: Metric alerts on connected sources
"The setup and integration with our website was quick and easy. This was thanks both to the excellent account team and extremely easy to use and fast support." — Fergus M., Ecommerce and Digital Marketing Manager, 5/5, Polar Analytics - G2 Verified Review
"Slow to load sometimes between views and reports. Limited reports on mobile. Expensive." — Verified G2 reviewer, Polar Analytics - G2 Verified Review
💰 Pricing
Pricing on request.
⚠️ Not For You If
You need finance and inventory data in the same view
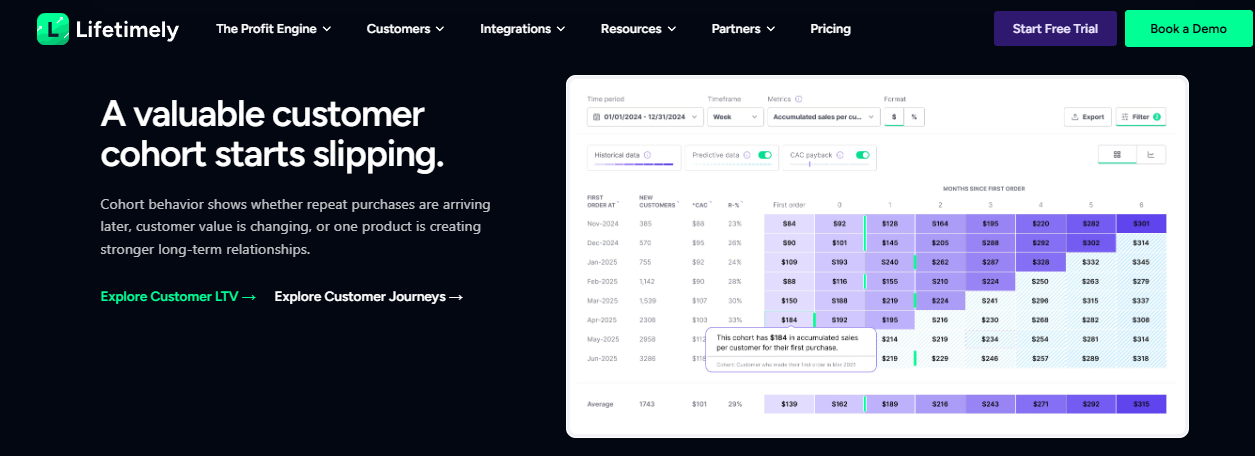
Lifetimely cohort table tracks accumulated sales per customer, CAC payback and repeat purchase timing monthly.
⭐ Why Did We Choose This Tool?
Lifetimely does one job better than almost anything on Shopify. It tells you what a customer is worth over time. Its cohort reporting is the reason operators buy it.
The app holds a 4.9 star rating across 459 reviews on the Shopify App Store, with roughly 97 percent at five stars. Ratings that lopsided usually mean a narrow product done well.
📊 Core Evaluation Metrics
Cross functional reasoning: Commerce plus P&L, no ops or banking layer
Query method: Prebuilt reports and custom dashboards
Proactive monitoring: Automated scheduled reports
Predictive layer: Predictive LTV modelling from historical patterns
Data prep: Native Shopify, Klaviyo, QuickBooks, and ad platform connectors
Founders who want a P&L that reconciles without a spreadsheet
Stores under $10M that cannot justify enterprise pricing
💬 Reviews
"Fantastic app and a fantastic customer service team. My queries have always been dealt with quickly and efficiently and have been answered very quickly. Would recommend this app to everyone!" — Shopify merchant, Lifetimely by AMP - Shopify App Store Verified Review
Tiered by store size, with higher plans around $299 / Month.
⚠️ Not For You If
Your open question is ad attribution rather than customer value
You need operational data like CS tickets or vendor performance
You want a system that pushes findings without you opening reports, which is where reasoning led alternatives differ
1.5 Peel Insights [toc=1.5 Peel Insights]
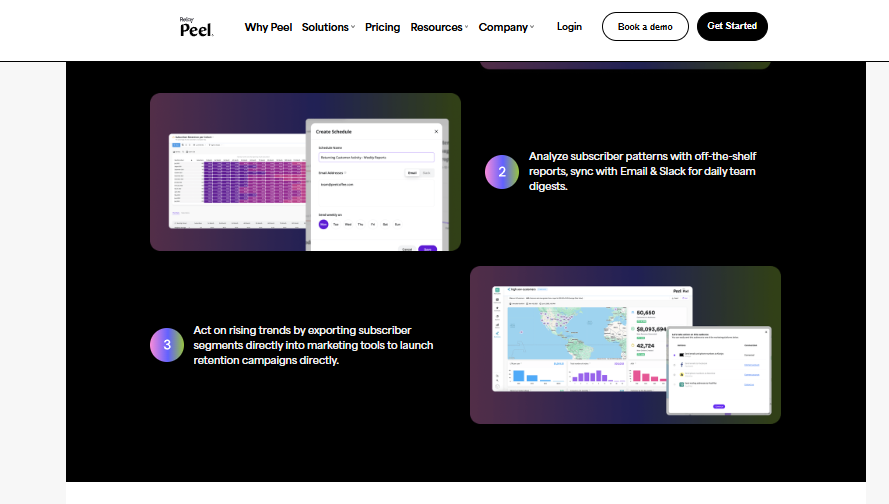
Peel Insights schedules subscriber cohort reports and exports retention segments straight into marketing tools for campaigns.
⭐ Why Did We Choose This Tool?
Peel automates the cohort work most teams never get around to. It builds retention, RFM, and repeat purchase views without setup effort. That saves a lot of manual pivoting.
Peel Analytics holds 4.5 out of 5 across 33 reviews on G2. Reviewers rate validation and data cleansing above the retail analytics category average.
📊 Core Evaluation Metrics
Cross functional reasoning: Customer and commerce data, no finance layer
Query method: Prebuilt automated reports and segments
Proactive monitoring: Scheduled report delivery
Predictive layer: Retention and repeat purchase trending
Daasity is the grown up option on this list. It builds and manages a real data warehouse with prebuilt ecommerce models. Multi channel brands with Amazon, retail, and DTC use it to reconcile everything.
It rates 4.8 out of 5 across 11 verified reviews on G2. Small sample, strong scores, narrow buyer.
📊 Core Evaluation Metrics
Cross functional reasoning: Broad, but depends on your analyst modelling it
Query method: BI tools on top of the warehouse, SQL friendly
Proactive monitoring: Whatever you build in your BI layer
Predictive layer: Not native, built by your team
Data prep: Managed ELT pipelines with prebuilt ecom schemas
"There are a few platforms that are not yet automated (we market in a few unique channels), so at times there is manual entry to create an overall marketing performance." — Verified G2 reviewer, Daasity - G2 Verified Review
💰 Pricing
Pricing on request.
⚠️ Not For You If
You do not have an analyst to model the data
You need answers this month, not a build, which is the core case for lighter weight options
Your store sits in the €1M to €5M band with a lean team
1.7 Metorik [toc=1.7 Metorik]
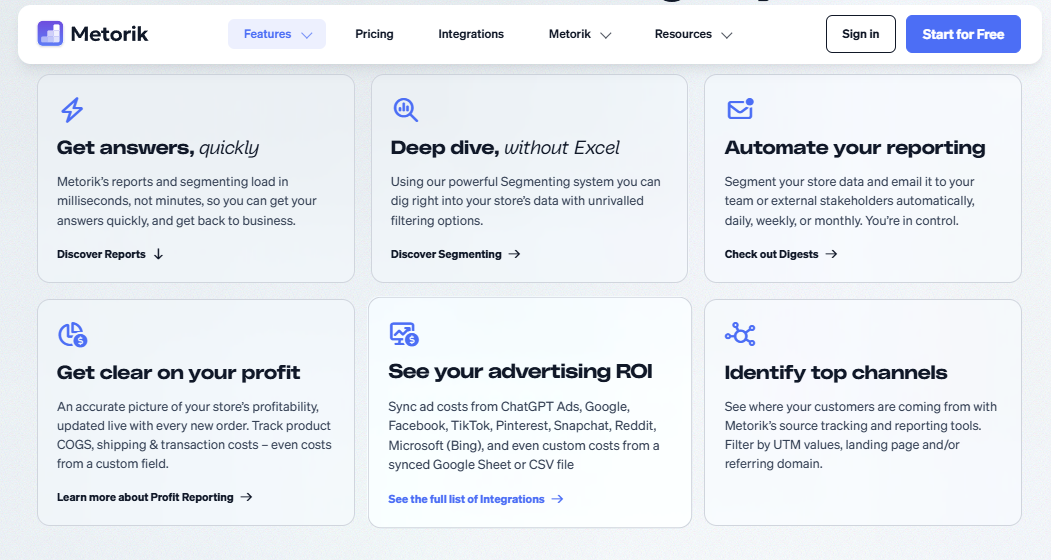
Metorik pairs millisecond reports and segmenting with automated email digests, profit tracking and ad ROI.
⭐ Why Did We Choose This Tool?
Metorik is the best reporting layer WooCommerce stores can buy. It also works on Shopify. Founded in 2016 in Melbourne, it serves tens of thousands of store owners.
It holds 4.8 out of 5 on G2 from 12 reviews and 4.9 across 200 plus reviews on WordPress.org, Shopify, and G2 combined. Support is the most cited strength.
📊 Core Evaluation Metrics
Cross functional reasoning: Commerce and email data, no ad or finance depth
Query method: Prebuilt reports plus a strong segmentation builder
Proactive monitoring: Email automation and report scheduling
Predictive layer: Trend reporting, no forecasting engine
Data prep: Native WooCommerce and Shopify sync
✅ Solutions Offered
Real time store reporting
Advanced customer and order segmentation
Subscription reporting
Email automation tied to segments
Product and refund analysis
😊 Best For
WooCommerce stores with no native reporting
Operators who segment customers manually today
Small teams wanting one tool for reports and email
💬 Reviews
"We utilize Metorik for all our websites and absolutely enjoy it." — r/woocommerce user, Reddit Thread
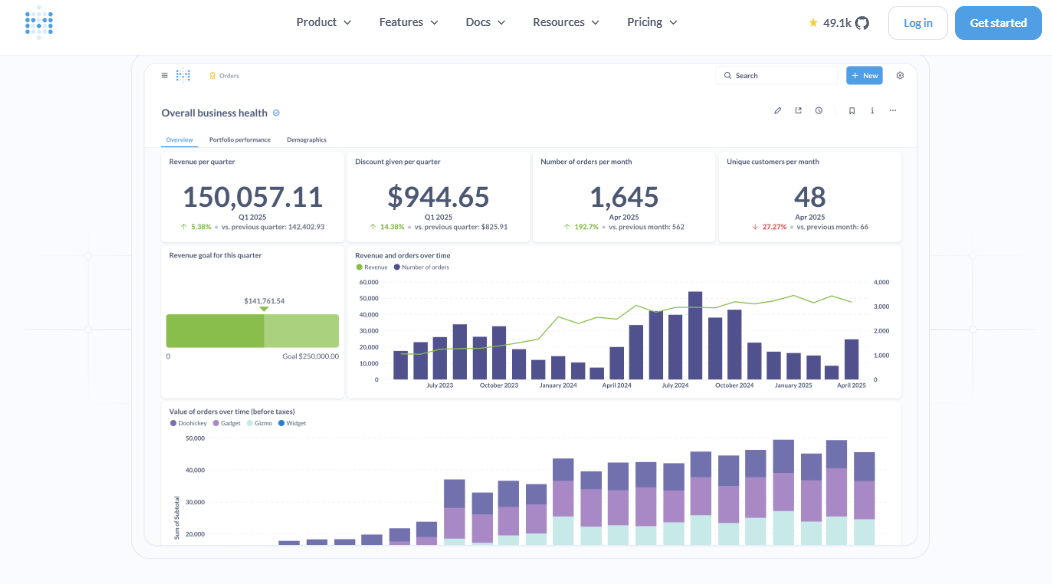
Metabase dashboard tracks quarterly revenue, discounts given, monthly orders and unique customers against a goal.
⭐ Why Did We Choose This Tool?
Metabase is the best open source route to self serve querying. Non technical users build questions without SQL. Analysts drop into SQL when they need to.
It rates 4.4 out of 5 across 147 reviews on G2. Reviewers praise the interface and price, then flag speed on big datasets.
📊 Core Evaluation Metrics
Cross functional reasoning: Only as broad as the warehouse you feed it
Query method: No code question builder plus full SQL
Proactive monitoring: Scheduled alerts and subscriptions
"What I like most about Metabase is its intuitive UI and overall ease of use." — Verified G2 reviewer, 4/5, Metabase - G2 Verified Review
"Performance can sometimes slow down when working with very large datasets, complex SQL queries, or heavily filtered dashboards." — Verified G2 reviewer, 4/5, Metabase - G2 Verified Review
💰 Pricing
Free self hosted. Starter around $100 / Month, Pro around $575 / Month.
⚠️ Not For You If
You have no warehouse and no one to build one
You need ecommerce logic out of the box
You want the tool to explain why a number moved
1.9 Looker Studio [toc=1.9 Looker Studio]
⭐ Why Did We Choose This Tool?
Looker Studio is genuinely free and it earns its place for that alone. Unlimited dashboards, unlimited sharing, no trial clock. For a store validating what it needs, that is the right first step.
It rates 4.4 out of 5 across 4,500 plus G2 reviews. Roughly 38 percent of recent reviewers flagged slow loads on large or blended datasets.
📊 Core Evaluation Metrics
Cross functional reasoning: Google data first, everything else via connectors
Query method: Drag and drop dashboard building
Proactive monitoring: None on the free tier
Predictive layer: None
Data prep: You blend sources manually, limited to five per blend
✅ Solutions Offered
Free unlimited dashboards and sharing
Native GA4, Google Ads, BigQuery, and Sheets connectors
Responsive report layouts
Live data links for clients and teams
Paid Pro tier for project ownership
😊 Best For
Stores running mostly on Google Ads and GA4
Teams testing reporting before paying for anything
One off analyses and simple shared views
💬 Reviews
"I like how I can access any of my data from any device just my logging in to my account." — Verified G2 reviewer, Looker Studio - G2 Verified Review
Third party connector breakage would cost you a decision
1.10 Microsoft Power BI [toc=1.10 Microsoft Power BI]
⭐ Why Did We Choose This Tool?
Power BI is the cheapest serious BI seat on the market at $14 per user per month. It handles mixed business data well beyond ecommerce. That breadth is why it stays on shortlists.
It rates 4.5 out of 5 across 1,659 G2 reviews. The recurring complaint is the DAX learning curve, which lands squarely on non technical teams.
📊 Core Evaluation Metrics
Cross functional reasoning: Wide, if someone models the data properly
Query method: Dashboards, DAX formulas, Copilot features
Proactive monitoring: Data alerts on tracked metrics
Predictive layer: Available through added modelling work
Data prep: Manual modelling and relationship building
✅ Solutions Offered
Enterprise grade dashboards and reports
Data modelling with DAX
Tight Microsoft 365 and Excel integration
Row level security and governance
Copilot assisted report building
😊 Best For
Teams with an analyst or a Microsoft heavy stack
Businesses reporting beyond ecommerce data
Organisations needing formal governance controls
💬 Reviews
"One thing I dislike about Power BI is that some of the more advanced features and custom visuals can have a steep learning curve, which may require extra time and training to fully master." — Verified G2 reviewer, Microsoft Power BI - G2 Verified Review
"At times, the software can be slow, especially when working with a very large database. Additionally, full functionality is only available through the paid features, while the limited version offers just the basic features needed." — Verified G2 reviewer, Microsoft Power BI - G2 Verified Review
These ten are not one category. They fall into three, and picking across categories is where operators waste money.
General BI covers Metabase, Looker Studio, and Power BI. They chart anything you model, and they model nothing for you.
Ecom point tools cover Triple Whale, Polar Analytics, Lifetimely, Peel, Metorik, and Daasity. Each owns one slice well, whether that is attribution, LTV, retention, or the warehouse itself.
Ecom reasoning layers are the newest group, and today that is a short list. The test is simple. Can it answer a question that crosses marketing, inventory, and accounting without a human stitching it together?
Luca AI belongs to that third group by design. It reasons across commerce, ads, inventory, and accounting in one pass, then pushes what it finds to Slack or email. That is the honest reason it sits at position one, not the byline on this article.
Q2. How Did We Score and Select These 10 Tools? [toc=2. Scoring Methodology]
Each tool scored out of 100 across five weighted criteria: Cross-Functional Intelligence 25%, Depth of Reasoning 20%, Setup and Usability 20%, Pricing Transparency 20%, and User Reviews 15%. Scores map to stars, with 0 to 20 earning one star and 81 to 100 earning five. No vendor paid for placement or review.
📊 Why the Weights Shifted in 2026
Two years ago, I would have weighted visualisation and connector count higher. That was when a chart was the deliverable. It is not the deliverable now.
Median DTC revenue grew 15.2 percent in H1 2026 while median ad spend grew 28 percent. When spend outruns revenue, the expensive thing is a slow answer, not a missing chart.
⭐ The Five Criteria and the Test Behind Each
Every tool faced the same question. Which SKU looks healthy on gross margin but loses money after shipping, returns, and customer acquisition cost, and why? Tools that needed an analyst to answer it lost points.
Scoring Criteria and Weights for Self-Service Analytics Tools
Criterion
Weight
The test applied
Cross-Functional Intelligence
25%
Can it join commerce, ad, inventory, and accounting data in one answer?
Depth of Reasoning
20%
Does it name the driver, or just show the number?
Setup and Usability
20%
Can a non technical operator get an answer in week one?
Pricing Transparency
20%
Is real pricing public, and does it scale with your store?
User Reviews
15%
Verified G2, Shopify App Store, and Reddit sentiment, weighted by volume
Luca AI measures the first criterion by tracing a single question across every connected source, then reporting which cost line moved the margin. That is the practical test of e-commerce business intelligence.
✅ What We Deliberately Ignored
Funding raised did not count. Logo walls did not count. Chart variety did not count either, because nobody has ever saved money by adding a chart type.
Reviews carried real weight but not the heaviest. The G2 Analytics Platforms category averages 4.51 out of 5, which means ratings alone barely separate anyone.
💬 What Operators Actually Said
"I utilize GA4 along with Shopify's built-in analytics, but I've found Hotjar to be incredibly valuable" — r/ShopifyeCommerce user, Reddit Thread
"One thing I dislike about Power BI is that some of the more advanced features and custom visuals can have a steep learning curve, which may require extra time and training to fully master." — Verified G2 reviewer, Microsoft Power BI - G2 Verified Review
That second quote is why usability carries 20 percent. A tool your merchandiser will not open is worth zero.
⚠️ Disclosed Conflicts
I founded Luca AI, and it sits at position one on this list. You should read the scoring with that in mind. I have published the exact criteria so you can rerun them yourself and disagree.
My read is that the reasoning weight is the defensible part. Business intuition and clear structured answers now matter more than technical depth, both in hiring and in tooling. I could be overweighting that shift by a few points.
Luca AI earned its five stars on the SKU profitability test, pulling the cost lines, isolating the driver, and stating the margin gap without an analyst in the loop. Every other tool needed a human somewhere in that chain, which is the case for an AI data analyst for e-commerce.
Q3. What Is Self-Service Analytics for an E-commerce Team, and How Is It Different From Self-Service BI? [toc=3. Definition vs Self-Service BI]
Self-service analytics lets non-technical operators get trusted answers without an analyst ticket. Self-service BI is the tooling category, meaning Power BI, Tableau, and Metabase. Self-service analytics is the outcome those tools are meant to produce. For an e-commerce team the difference is practical. BI shows you blended ROAS. Self-service analytics tells you which SKU to reorder and why.
🔍 The Definition, Then the Translation
Gartner defines self-service analytics as business professionals running their own queries and reports with nominal support from IT. That is the textbook version.
The store version is shorter. Your merchandiser should be able to answer a margin question at 4pm on a Tuesday without messaging anyone. That is the promise behind most self-service BI tools.
⏰ Where Most Brands Hit the Wall
Nearly every brand starts the same way. Shopify Analytics for orders, GA4 for traffic, and a spreadsheet to glue them together.
That stack holds until a question crosses two systems. Ask which denim size drives the most returns by channel, and it breaks instantly, which is where e-commerce data integration starts to matter.
📊 A Worked Example
Say size 26 returns at triple the rate of size 30. Shopify Analytics shows the returns. It does not show what you paid to acquire those orders.
Looker Studio will chart both if someone blends the sources first. Neither tool tells you to stop buying size 26.
One founder described the old way plainly. Waiting two days on an emailed answer meant the customer had already moved on.
🧭 The Three Access Models
There are only three ways operators self-serve today, and picking the wrong one wastes a year.
Dashboards. Prebuilt views you scroll. Fast to adopt, useless for a question nobody anticipated.
Drag and drop explorers. You build the view yourself. Powerful, but someone has to model the data first.
Conversational reasoning layers. You ask in plain language and get an answer with its drivers.
Ask Luca AI a cross domain question and it reasons over commerce, ad, and accounting data in one pass rather than one metric at a time. That is the working definition of conversational analytics tools.
⚠️ The Part the Category Gets Wrong
Self-service is not about handing everyone a chart builder. I have watched teams roll out dashboards and end up with more meetings, not fewer.
The real goal is deleting the wait state between a question and a decision. If the wait is still there, you bought e-commerce reporting, not self-service.
💡 The Windshield and the Gas Gauge
A good operator once framed it for me this way. Your dashboard is the gas gauge and the speedometer. It tells you how fast you are going.
The windshield is different. It shows you what is coming. Most tools in this category are gauges pretending to be windshields.
Luca AI operates in the third access model, returning the answer and the drivers behind it rather than a chart you still have to interpret. That distinction is the whole category shift.
Q4. What Has to Be True of Your Data Before Self-Service Works, Sources, Semantic Layer and Trust? [toc=4. Data Foundations and Governance]
Self-service works only when six sources are connected and normalised: Shopify orders and COGS, Meta and Google spend, Klaviyo retention, your 3PL or inventory system, Stripe, and Xero or QuickBooks. Then you need one governed metric definition per KPI. Skip either step and your team self-serves confidently wrong numbers faster than before.
🔌 The Six Connections and What Each Unlocks
Six Data Sources and the Decisions They Unlock
Source
Decision it unlocks
Shopify orders and COGS
True product level margin
Meta and Google spend
Real acquisition cost per channel
Klaviyo
Repeat rate and owned channel contribution
3PL or inventory system
Reorder timing and stockout risk
Stripe
Payment fees and settlement timing
Xero or QuickBooks
Cash position behind every growth call
Miss the last two and your team self-serves marketing metrics while cash flow decisions stay in a spreadsheet.
⚠️ The Normalisation Traps Nobody Warns You About
Retail calendars break first. One system uses 4-5-4 weeks, another uses 5-5-3, and neither matches your accounting month.
SKU keys break second. The same product carries three different identifiers across Shopify, your 3PL, and your ad feed, which is a core e-commerce data management problem.
Luca AI normalises and standardises data at the ingestion layer, which removes the cleanup phase most warehouse projects budget a year for.
📐 The Semantic Layer in Plain Words
A semantic layer is one agreed definition per metric that every question inherits. Revenue means the same thing in marketing and finance.
Without it, your growth lead and your finance director pull two different revenue numbers. Both are technically correct. That is the problem.
💸 Metric Drift and Dashboard Sprawl
Metric drift is what happens when everyone builds their own view. Within six months, you have four definitions of CAC and no one remembers which is right.
Three controls fix it. Name one owner per metric definition, retire any dashboard nobody opened in 60 days, and ban store data on unpaid AI tiers.
That last one is not paranoia. Uploading customer records to a free tool puts your customer data somewhere you do not control.
❌ Attribution Honesty Before You Trust a ROAS Number
Here is the uncomfortable part. Practitioners report Meta match rates of 70 to 85 percent with a first party pixel, versus 40 to 60 percent on a raw pixel.
Between 15 and 30 percent of conversions land in direct or unattributed. Your team is self-serving a number with a known error bar, which is the gap between platform ROAS and true profitability.
💬 What Operators Report
"We tried Triple Whale too but it felt super bloated with useless features (we only need order attribution with custom pixel) and their pixel tracking is just a black box." — r/shopify user, Reddit Thread
"Performance can sometimes slow down when working with very large datasets, complex SQL queries, or heavily filtered dashboards." — Verified G2 reviewer, 4/5, Metabase - G2 Verified Review
✅ The Rule I Would Hold
You cannot build a self-service layer on uncleaned data. Buy the tool that cleans on ingestion, not the one that assumes you already did.
Luca AI holds metric definitions centrally after normalising on ingestion, so a growth lead and a finance director asking the same margin question receive the same governed number. That is the boring foundation everything else sits on.
Q5. Which Questions Should Your Team Be Able to Answer Without an Analyst? [toc=5. Questions It Must Answer]
Gross margin tells you what it costs to make the product, not what it costs to sell it. Loaded with shipping, returns, discounts, fees, and CAC, a 72 percent gross-margin bestseller can land at 8 percent contribution margin. A self-service stack earns its price when your team can answer that unaided, plus reorder timing, cohort payback, and which channel is quietly subsidising the rest.
💸 The Invoice That Ended a Buying Plan
A founder slid an invoice across the table and told me it was her best seller. Seventy-two percent gross margin. They could not make them fast enough.
We pulled her P&L, her shipping data, her return rates, and her support tickets. Twenty minutes later, she was crying.
📉 The Teardown From 72 to 8
The number was not wrong. It was just answering a different question than she thought.
From 72 Percent Gross Margin to 8 Percent Contribution Margin
Cost line
What it removed
Gross margin
72% starting point
Inbound freight and duty
Product cost was never the whole product cost
Outbound shipping
Heavy item, flat rate checkout
Returns and restocking
Sizing driven, not quality driven
Discounts and payment fees
Site wide codes and card costs
Customer acquisition cost
Meta CAC on a low repeat SKU
Contribution margin
8%
Ask Luca AI to run that waterfall and it traces each cost line back to the source system, then names the two lines doing the damage. That is the practical difference between contribution margin and gross margin.
⚠️ Why Every Ranking Article Stops at Gross Margin
Because gross margin lives in one system. Contribution margin lives in five.
That is a data joining problem, not an analytics problem. Most BI listicles never mention it because their readers are enterprise data teams, not people buying denim, which is why tracking unit economics stays manual for so long.
✅ From Monitoring to Recommending
The shift I would bet on is simple. Descriptive dashboards tell you what happened. Prescriptive systems tell you what to do next.
A dashboard reporting a ROAS dip is a smoke alarm. A system that says the dip came from one campaign, quantifies the margin impact, and ranks the fix is a fire crew. Luca AI performs that root cause analysis over historical patterns, then pushes the finding into Slack or email before anyone opens a report, which is the working shape of decision intelligence tools.
📊 The Ten Questions, With Their Reference Points
Your team should answer these without a ticket. Each needs a benchmark beside it, or the answer floats.
Which SKUs are unprofitable after returns and shipping?
What is our real CAC by channel? Compare against $5 to $15 owned and $35 to $85 Meta.
Which cohort has the fastest payback?
Is revenue growth outpacing ad spend growth? Median DTC brands grew revenue 15.2 percent in H1 2026 while spend grew 28 percent.
What do we reorder in the next 30 days?
Which discount code costs us the most margin?
Which channel is subsidising the others?
What is our stockout risk on top ten SKUs?
Where is repeat rate falling by product?
What happens to cash if we scale spend 20 percent?
Recommendations still need a human check. A premium bike brand once published a homepage image with the rear derailleur mounted on the front wheel.
Do not remove the QA step. Do not let the AI be the QA.
Luca AI is built for this exact question set, isolating the influencing components behind a margin drop and simulating the alternative decision. The judgment call after that stays yours.
Q6. What Does Self-Service Analytics Actually Cost at Your GMV Tier? [toc=6. Real Cost by GMV]
Budget by GMV, not by seat. Under €500K, Shopify Analytics plus GA4 and Looker Studio is genuinely enough. Between €500K and €5M, expect €100 to €500 per month for an ecom-native platform. Above €5M, consolidation beats stacking. Then add the hidden line, which is the analyst or agency hours needed to model and maintain a general BI tool.
💰 Why Per-Seat Pricing Misleads Store Owners
Per-seat pricing was designed for companies where a few analysts build and everyone else consumes. Your store does not work that way.
The people who most need to ask questions are your merchandiser, your ops manager, and your finance lead. Charging per head taxes exactly the behaviour you are trying to create.
📊 The Three Tiers
Self-Service Analytics Cost by GMV Tier
Stage
Sensible stack
Realistic monthly cost
Under €500K GMV
Shopify Analytics, GA4, Looker Studio
Free
€500K to €5M GMV
One ecom-native platform, Luca AI from €299, Triple Whale around $124 to $374
€100 to €500
Above €5M GMV
Consolidate, or warehouse plus BI seats from $14 per user
€500 plus, rising with headcount
Luca AI prices by plan rather than by seat, so adding your ops manager costs nothing extra. You can compare the tiers on the pricing page.
💸 The Self-Service Tax Nobody Quotes
The licence is the cheap part. The expensive part is the modelling work underneath.
One operator described rebuilding the same report every month. Two days and three pivot tables, every single time. Price that at your team's hourly cost and the free tool stops looking free, which is the argument for automated e-commerce reporting.
⚠️ What Operators Say About the Bill
"of course they upsell you and you have to go to 300 a month to get the attribution." — r/shopify user, Reddit Thread
"Slow to load sometimes between views and reports. Limited reports on mobile. Expensive." — Verified G2 reviewer, Polar Analytics - G2 Verified Review
"From a performance and ROI standpoint, Metabase offers excellent value, especially when compared with more expensive BI tools." — Verified G2 reviewer, 4/5, Metabase - G2 Verified Review
❌ Contract Terms to Refuse
Refuse multi-year lock-ins before you have proven adoption. Refuse pricing that jumps on tracked revenue rather than usage.
Also refuse anything that needs a six week implementation before your first answer. If a vendor cannot show you value inside a month, the risk is yours, not theirs.
⏰ The Threshold Test
Attribution platforms get thin below roughly $15,000 per month in ad spend. Below that, the fee eats the insight.
My read is that the same logic applies across this category. If a tool costs more than 1 percent of monthly revenue, it needs to change a decision every month to justify itself.
Luca AI removes the modelling phase that drives most of the hidden cost, since data is standardised on connection rather than shaped by an analyst first. That is where the total cost of an answer actually falls.
Q7. How Do You Choose the Right Tool and Get It Live in 30 Days? [toc=7. Choosing and Rollout]
Choose by who self-serves. Merchandisers need SKU and inventory depth, growth leads need channel and cohort data, and finance needs contribution margin and cash. Then run a four-week rollout: connect and audit in week one, agree ten metric definitions in week two, kill the Monday manual report in week three, and hand three people three recurring questions each in week four.
🧭 The Decision Tree
Pick the branch that matches your loudest question, not the tool with the best homepage.
Merchandising leads. Lifetimely or Metorik. Skip both if your main gap is paid channel performance.
Growth leads. Triple Whale or Polar Analytics. Skip both if you need accounting data in the same view.
Finance leads. Luca AI reasons across commerce, ad, and accounting data in one pass. Skip it if you already run a data team and a governed warehouse.
Analyst on staff. Metabase, Power BI, or Daasity. Skip these if nobody will model the data.
If you are still mapping the wider stack, start with the e-commerce tech stack before you shortlist anything.
⚠️ The Disqualifier Most People Miss
If your team is deeply invested in Excel models, expect resistance. One operator told me her team pushed back hard, saying their model already worked.
They were not wrong. Plan for that conversation before you buy, not after.
⏰ The Four-Week Plan
Week 1: Connect and audit. Plug in Shopify, ad accounts, and your accounting tool. Write down every number that disagrees across systems.
Week 2: Define ten metrics. Agree what revenue, CAC, margin, and repeat rate mean. One owner per definition, written down, no exceptions. Use a shortlist of top e-commerce KPIs as the starting set.
Week 3: Kill the Monday report. Replace one manual export with a live view. Time how long the old version took, then compare.
Week 4: Hand out questions. Give three named people three recurring questions each. Track how often they still ask someone else.
Ask Luca AI to send the week three report on a schedule, and it lands in Slack or email without anyone logging in.
✅ What Not to Do
Do not rebuild every legacy report before switching. Most of them nobody reads.
Pick the three reports that drive real decisions. Rebuild those. Let the rest die quietly.
📊 The Adoption Metric That Matters
Logins are a vanity number. Questions self-answered is the real one.
Count how many times someone got their own answer instead of pinging you. If that number is not rising by week four, the problem is incentives, not software. One retailer I know put AI usage on everyone's 2026 goals, tied to bonus. Blunt, but it worked.
⭐ Before You Trust the Output
Load context before you trust answers. Historical data, brand rules, and catalog structure all matter.
Hiring a brilliant analyst and asking for a report on day one produces garbage. The same principle applies to evaluating AI data agents.
Luca AI compresses week one to an afternoon because data is standardised on connection rather than cleaned by hand first. The rest of the plan is still yours to run.
💬 The Question I Am Sitting With
My read right now is that the dashboard era ends inside 18 months. Not because dashboards are bad, but because reading one is a job nobody wanted.
What I am less sure about is where the human check lands. If your team stopped opening dashboards tomorrow, what would you still want a person to verify before money moved? Tell me what that list looks like in your store.
FAQ's
What are self service analytics tools, and how are they different from self service BI?
Self service analytics tools let non technical operators get trusted answers from store data without filing a request with an analyst. Self service BI is the tooling category, meaning platforms like Power BI, Tableau, and Metabase. Self service analytics is the outcome those tools are supposed to produce.
For an e-commerce team, the difference is practical rather than academic:
Self service BI charts blended ROAS once someone has modelled the data.
Self service analytics answers which SKU to reorder, and names the cost line driving the decision.
There are only three access models in the market today. Dashboards give you prebuilt views you scroll. Drag and drop explorers let you build views yourself, provided someone modelled the underlying data first. Conversational reasoning layers let you ask in plain language and return the answer with its drivers attached.
Luca AI operates in that third model, reasoning across commerce, ad, inventory, and accounting data in a single pass instead of one metric at a time. If you want the wider category map before shortlisting anything, our breakdown of self-service BI tools covers where each architecture fits and where it stops.
Which self service analytics tool is best for a Shopify brand with no data analyst?
It depends entirely on who in your team needs to self-serve, and the honest answer is that no single tool wins every scenario. We recommend choosing by the loudest open question in your business.
Merchandising led. Lifetimely by AMP or Metorik, for SKU, LTV, and cohort depth.
Growth led. Triple Whale or Polar Analytics, when channel attribution is the open question.
Finance led. A reasoning layer that reads accounting data alongside commerce and ad data.
Analyst on staff. Metabase, Power BI, or Daasity, since all three assume someone models the data.
The disqualifier most brands miss is internal resistance. Teams with mature Excel models push back hard, and they are often not wrong about their existing workflow. Plan that conversation before you sign anything.
Luca AI fits Shopify and WooCommerce brands in the €1M to €5M revenue band with no analyst, no data engineer, and no appetite for SQL. It is not the right pick if you already run a governed warehouse with a data team, or if you specifically need a marketing attribution pixel. Our guide to the best AI tools for Shopify owners maps the rest of the stack around that choice.
How much do self service analytics tools cost for an ecommerce team in 2026?
Budget by GMV rather than by seat. Per seat pricing was designed for companies where a few analysts build and everyone else consumes, which is the opposite of how a lean store works.
Under €500K GMV. Shopify Analytics, GA4, and Looker Studio, genuinely free.
€500K to €5M GMV. Roughly €100 to €500 per month for one ecom-native platform.
Above €5M GMV. €500 plus per month, and consolidation usually beats stacking three tools.
Published pricing gives useful anchors. Power BI starts around $14 per user per month, Metabase runs free self hosted with paid tiers from roughly $100, and Triple Whale's listed annual plans work out to roughly $124 to $374 monthly. Luca AI is priced by plan rather than per seat, starting at €299 per month, so adding your ops manager costs nothing extra.
The line nobody quotes is the modelling tax. One operator described rebuilding the same report monthly, two days and three pivot tables every time. Price that against your team's hourly cost and the free tool stops looking free. Our note on automated ecommerce reporting shows how that recurring cost compounds.
What data sources do we need connected before self service analytics actually works?
Six sources, connected and normalised, before anyone self-serves anything:
Shopify orders and COGS for true product level margin.
Meta and Google spend for real acquisition cost per channel.
Klaviyo for repeat rate and owned channel contribution.
3PL or inventory system for reorder timing and stockout risk.
Stripe for payment fees and settlement timing.
Xero or QuickBooks for the cash position behind every growth call.
Miss the last two and your team self-serves marketing metrics while cash decisions stay trapped in a spreadsheet.
Then expect normalisation traps that enterprise BI guides never mention. Retail calendars break first, because one system runs 4-5-4 weeks, another runs 5-5-3, and neither matches your accounting month. SKU keys break second, since the same product carries different identifiers across Shopify, your 3PL, and your ad feed.
Luca AI normalises and standardises data at the ingestion layer, which removes the cleanup phase most warehouse projects budget a year for. The uncomfortable rule holds either way: you cannot build a self service layer on uncleaned data, so buy the tool that cleans on connection rather than one that assumes you already did. Our primer on ecommerce data integration covers the connector sequence in detail.
Why do gross margin dashboards mislead reorder decisions, and what should we track instead?
Gross margin tells you what it costs to make the product. It tells you nothing about what it costs to sell the product. That single gap has cost more reorder budgets than any bad creative ever did.
One founder showed us an invoice for her best seller at 72 percent gross margin. Loading the real cost lines took twenty minutes and the number landed at 8 percent contribution margin:
Inbound freight and duty, because product cost was never the whole product cost.
Outbound shipping on a heavy item with flat rate checkout.
Returns and restocking, sizing driven rather than quality driven.
Site wide discount codes and card processing fees.
Meta CAC on a SKU with a low repeat rate.
Track contribution margin at SKU level instead, and pair every metric with a reference point. Median DTC brands grew revenue 15.2 percent in the first half of 2026 while median ad spend grew 28 percent, so margin compression is the operating condition, not an anomaly.
Luca AI runs that waterfall by tracing each cost line back to its source system, then names the two lines doing the damage. Our comparison of contribution margin versus gross margin includes the full cost line checklist.
Enjoyed the read? Join our team for a quick 15-minute chat — no pitch, just a real conversation on how we’re rethinking Ecommerce with AI - Luca
Loading Schedule...
Your AI Co-Founder is here.
Here’s why:
Shopify, Meta, Xero - one brain.
"Should I scale?" Answered with real data.
Growth capital. No applications. One click.
Thank you! Your submission has been received! Please book a time slot for the Meeting
Oops! Something went wrong while submitting the form.