11 Best Self-Service BI Tools for Ecommerce: Where Non-Technical Teams Get Answers Without SQL
15
mins read
TL;DR
The 11 best self-service BI tools for ecommerce in 2026 are Luca AI, Triple Whale, Power BI, Tableau, Looker Studio, Metabase, ThoughtSpot, Sigma, Zoho Analytics, Qlik Sense, and Domo.
We scored every tool on Non-Technical Usability 25%, Ecommerce Data Coverage 25%, Prescriptive Intelligence 20%, Verified User Reviews 15%, and Pricing Transparency 15%, then converted scores into star bands.
No-SQL rarely means no code. Reviewers cite DAX, load scripts, and calculated fields as the wall, so the real cost is the internal owner, not the seat price.
Under roughly $1M revenue with two ad channels, Shopify native reporting plus one spreadsheet is enough. Buy BI when a single question starts crossing systems.
Test tools with six questions on your own data, including true contribution margin by SKU, support cost by SKU, and whether the tool can show its work.
Governance survives by locking metric definitions centrally, not by restricting access, and adoption sticks when alerts reach people instead of dashboards waiting for them.
Q1. What are the 11 best self-service BI tools for ecommerce in 2026? [toc=1. 11 Best Tools]
The 11 best self-service BI tools for ecommerce in 2026 are Luca AI, Triple Whale, Microsoft Power BI, Tableau, Looker Studio, Metabase, ThoughtSpot, Sigma, Zoho Analytics, Qlik Sense, and Domo. Luca AI leads because it sits as an AI layer over your unified ecommerce data, pulls the relevant slice for the question asked, and returns root-cause reasoning instead of another dashboard to maintain.
I picked these 11 after one filter: can a non-technical hire get a real answer without a modeling tool. I ignored vendor claims and read reviews, pricing pages, and practitioner threads instead. Every tool here connects to commerce or ad data, allows plain-language or no-code exploration, and publishes enough pricing to compare. I left out pure attribution pixels, warehouse engines, and enterprise suites that need a dedicated data hire. One honest disclosure up front: I am the founder of Luca AI, and I explain below why it sits first.
📋 The 11 tools at a glance
Luca AI, best for AI-native ecommerce intelligence and root-cause answers without SQL
Triple Whale, best for DTC marketing attribution and creative analytics
Microsoft Power BI, best for Microsoft-stack teams with an internal data owner
Tableau, best for visual exploration on a governed data model
Looker Studio, best for free Google Ads and GA4 reporting
Metabase, best for lean teams wanting open-source self-hosting
ThoughtSpot, best for search-first querying at mid-market scale
Sigma, best for spreadsheet-native analysts on a warehouse
Zoho Analytics, best for budget-conscious multi-source reporting
Qlik Sense, best for associative data exploration
Domo, best for broad app-style distribution across departments
Comparison table
11 Best Self-Service BI Tools for Ecommerce in 2026
Tool
Key capabilities offered
Best For
Pricing
Luca AI ⭐⭐⭐⭐⭐
Plain-English questions, 200+ connectors, root-cause analysis, predictive reorder and sales alerts, scheduled Slack and email reports
Shopify brands at €1M to €5M with data sitting unused
Prices are list prices at publication. Ecommerce plans move often, so confirm your GMV band before signing anything annual.
1.1 Luca AI [toc=1.1 Luca AI]
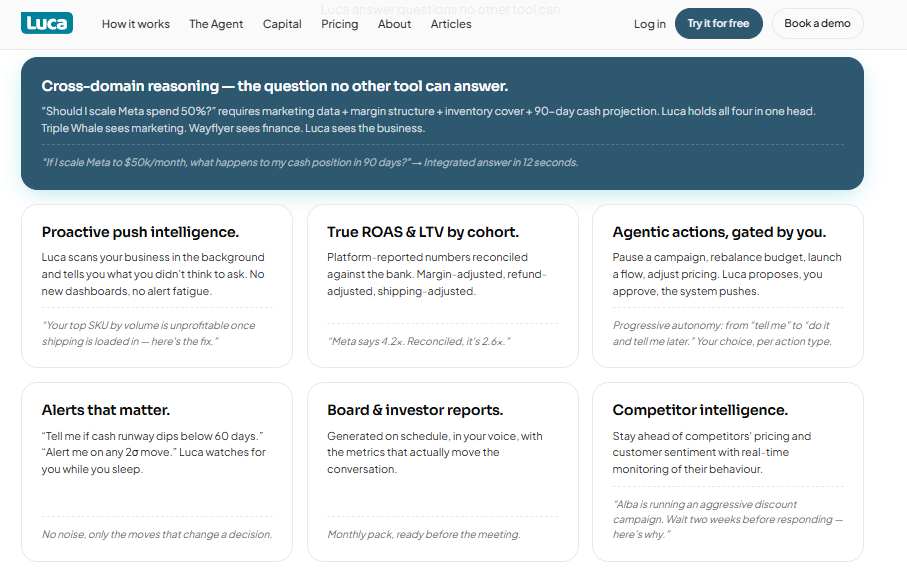
Luca AI reasons across marketing, margin, inventory, and cash in one unified ecommerce data layer.
Luca AI is an AI intelligence layer over your unified ecommerce data, built for stores between €1M and €5M that already have plenty of data and no analyst. It connects your sources, standardizes them on ingestion, and answers questions in plain English.
🧠 Why did we choose this tool?
I put Luca AI first because it answers the question this article exists for, and I will own the bias openly. Most tools on this list hand you a canvas and expect someone to model the data first. Luca AI reasons across marketing, sales, product, profit, customer, and operational data in one query. It runs root-cause analysis, surfaces the influencing components behind a metric move, and pushes findings to you. That is the AI Co-Founder model rather than another reporting surface.
📊 Solutions offered
Connectors: 200+ native sources including Shopify, Meta, Google, Klaviyo, and accounting
Query mode: Plain English chat, no SQL, no dashboard building, no semantic layer to maintain
Luca AI is not the fit for enterprises that already run a data team and a governed semantic layer. It also underdelivers for very early stores, since thin data gives the reasoning engine little to work against. It is not an attribution pixel, so pair it with one if channel credit is your core problem.
💡 Case study
The problem: A European skincare brand doing roughly €3M a year across Shopify and Amazon ran its weekly numbers manually. Four exports, one pivot table, every Monday morning. Its best-selling SKU looked healthy at 68% gross margin.
How Luca AI helped: After connecting commerce, ad, and accounting sources, Luca AI recalculated margin per SKU with shipping, returns, and support cost included. It flagged that the hero SKU carried a return rate near triple the catalog average.
The outcome: True contribution margin on that SKU landed in single digits. The team repriced it, moved spend to two mid-tier products, and cut the Monday reporting ritual to a scheduled Slack report. Details are generalized under NDA.
Luca AI normalizes and standardizes data on ingestion, which is why the first cross-source question gets answered in the same week the connectors go live.
1.2 Triple Whale [toc=1.2 Triple Whale]
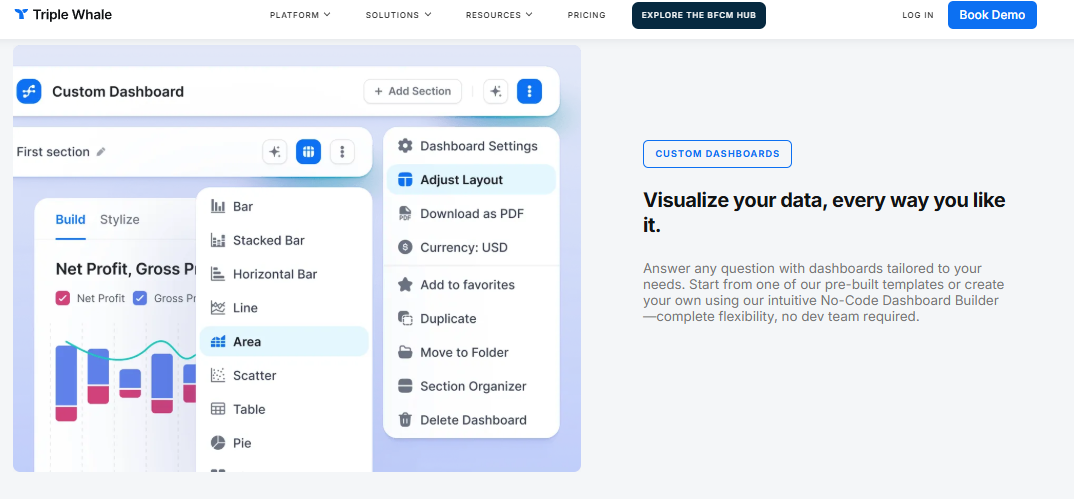
Triple Whale builds custom ecommerce dashboards, but someone still has to interpret the charts.
Triple Whale is an ecommerce analytics platform built around its own first-party pixel. It is the strongest option on this list if your primary pain is paid media measurement rather than whole-business reporting.
📈 Why did we choose this tool?
Triple Whale earns its spot because the Triple Pixel collects data independent of platform tracking. Practitioner testing puts its match rates around 70% to 85%, against roughly 40% to 60% for a raw Meta pixel. Creative analytics, cohorts, and the Moby assistant sit on top of that data. For a brand spending real money on Meta, that measurement layer is hard to replicate.
Predictive: Forecasting and budget allocation guidance on upper plans
Agentic reporting: Slack alerts and scheduled reporting workflows on Automate
✅ Best for
DTC brands spending $15k a month or more on paid media
Growth leads who need channel-level creative and cohort analysis
Teams comfortable with GMV-banded pricing that rises as they scale
⚠️ Not recommended for
Triple Whale does not connect to accounting or banking systems, so cash flow and P&L questions stay outside its reach. The jump from Foundation at $219 to Automate at $749 is steep for a store under $1M. Billing and support complaints show up repeatedly, with a 4.5 out of 5 on G2 against 3.0 out of 5 on Trustpilot. If channel measurement is the only job, compare the Triple Whale alternatives before you commit to an annual band.
😊 Reviews
"Users find the attribution system buggy and unreliable, leading to frustration and disappointment with customer service." — Aggregated reviewer sentiment across 482 reviews, Triple Whale - G2 Verified Review
"The relatively new software is still in the beta stage. Inventory Management and Customer Segmentation haven't been made available yet." — r/shopify, Reddit Thread
💰 Pricing
Free, $0 / Month | Foundation, from $219 / Month | Automate, from $749 / Month | Enterprise, Custom, with both paid tiers rising by annual GMV band
Luca AI reads the financial layer that attribution platforms leave out, which is why a margin question and a channel profitability question can be answered in the same conversation.
1.3 Microsoft Power BI [toc=1.3 Microsoft Power BI]
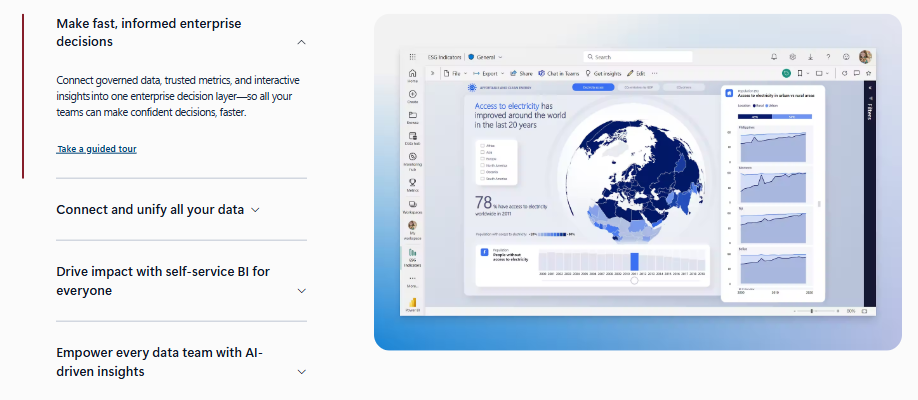
Power BI unifies governed data, though operators flag slower AI readiness for lean ecommerce teams.
Power BI is Microsoft's drag-and-drop BI platform. It is the default choice for teams already living inside Excel, Teams, and Azure.
🧩 Why did we choose this tool?
Power BI earns its place on price and reach. At roughly $14 per user monthly, no other governed BI platform is cheaper to start. It reads Excel files natively, which matters when your reporting history sits in workbooks.
The catch is the modeling layer. G2 reviewers repeatedly flag DAX, the formula language, as the wall non-technical users hit. That is the self-service tax in plain sight.
📊 Solutions offered
Connectors: Shopify and Meta via third-party connectors, plus native Excel, SQL, and Azure
Query mode: Drag-and-drop visuals, DAX measures, Copilot on higher tiers
Intelligence: Semantic models, row-level security, Q&A natural language visual
Predictive: Forecasting visuals, AutoML through Fabric
Agentic reporting: Scheduled refresh, email subscriptions, Teams alerts
✅ Best for
Teams already standardized on Microsoft 365 and Azure
Companies with at least one internal data owner to maintain models
Reporting on structured, moderate-volume datasets
⚠️ Not recommended for
Small ecommerce teams without a modeling owner. Ecommerce connectors are third-party, so Shopify and Meta data needs middleware or a warehouse first. If that describes your stack, an ecommerce data integration layer is the prerequisite, not the dashboard.
😊 Reviews
"Users appreciate the ease of use of Microsoft Power BI, allowing accessible data analysis for everyone." — Aggregated reviewer sentiment, Microsoft Power BI - G2 Verified Review
"Users often find data modeling complex, leading to a steep learning curve and performance issues." — Aggregated reviewer sentiment, Microsoft Power BI - G2 Verified Review
💰 Pricing
Pro, $14 / Month per user | Premium Per User, $24 / Month per user | Fabric capacity, Custom
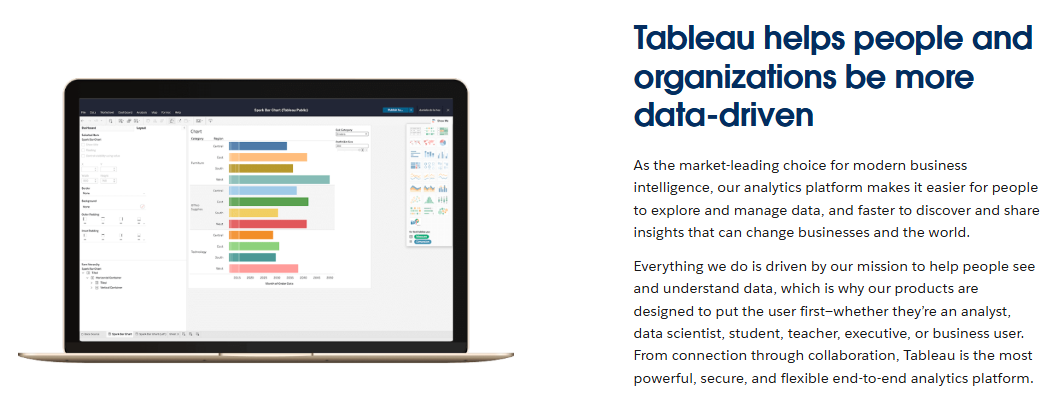
1.4 Tableau [toc=1.4 Tableau]
Tableau represents legacy BI: powerful visuals, but analyst time and modelled data required first.
Tableau is the visual analytics standard, now part of Salesforce. It rewards teams that have someone fluent in data prep and dashboard design.
🎨 Why did we choose this tool?
Nothing on this list matches Tableau for depth of visual exploration. Its Prep tool handles messy joins well. For a store with an analyst, it is genuinely powerful.
Cost and learning time are the tradeoffs. Reviewers name expense and complexity as the two recurring complaints, especially in small teams.
📊 Solutions offered
Connectors: Hundreds of native connectors, Shopify and Meta via partner connectors
Analyst-led teams doing deep, repeated visual analysis
Mid-market and enterprise brands with a governed data source
Organizations already on Salesforce
⚠️ Not recommended for
Sub-$5M stores without an analyst. Large dashboards slow noticeably on heavy datasets, and per-seat cost adds up fast. At that stage, most brands get further with AI data visualization tools that do not need a dedicated builder.
😊 Reviews
"One thing I don't like about Tableau is that it is more expensive than Power BI. It also takes more time to learn, especially the advanced features." — Verified reviewer, Tableau - G2 Verified Review
"The basics of Tableau are fairly easy to learn, but advanced calculations, establishing relationships between data, parameters usage and dashboard optimization require knowledge and experience." — Verified reviewer, Tableau - G2 Verified Review
💰 Pricing
Viewer, $15 / Month per user | Explorer, $42 / Month per user | Creator, $75 / Month per user
1.5 Looker Studio [toc=1.5 Looker Studio]
Looker Studio is Google's free dashboarding tool. For Google Ads and GA4 reporting on zero budget, it is still the fastest starting point.
🆓 Why did we choose this tool?
Free matters when cash sits in inventory. Looker Studio connects to GA4, Google Ads, and Sheets in minutes. Many DTC brands run their first client-facing dashboard here.
It is a visualization layer, not a warehouse. Practitioners are blunt that blending and calculated fields inside it slow reports badly.
📊 Solutions offered
Connectors: Native Google sources, Sheets, BigQuery, plus paid community connectors
Query mode: Drag-and-drop charts, calculated fields, data blending
Intelligence: Basic blends, filters, and segment comparisons
Predictive: None native
Agentic reporting: Scheduled email delivery of reports
✅ Best for
Stores whose paid media is mostly Google and whose analytics is GA4
Very small teams with no BI budget
Simple, low-volume reporting needs
⚠️ Not recommended for
Multi-source ecommerce reporting across Shopify, Meta, returns, and accounting. Performance degrades once row counts grow, and heavy blending makes it worse. Teams that outgrow it usually move to purpose-built ecommerce analytics platforms instead.
😊 Reviews
"I'm experiencing significant delays with Looker Studio. It's taking a long time to load the data, and the charts often take several seconds or even minutes to appear." — Google Cloud community user, Looker Studio Community Thread
"I've observed that many users face performance issues with Looker Studio (previously known as Google Data Studio) when handling larger datasets." — r/GoogleDataStudio, Reddit Thread
💰 Pricing
Looker Studio, $0 / Month | Looker Studio Pro, from $9 / Month per user
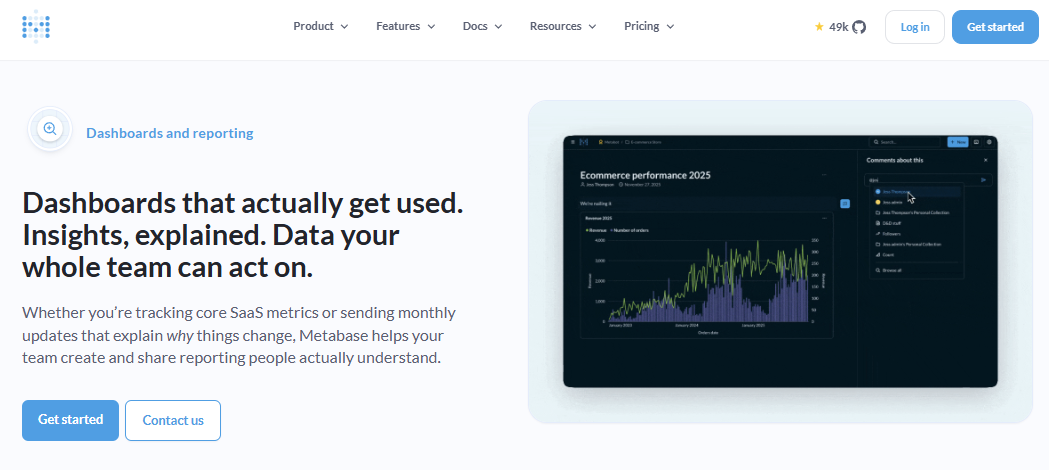
1.6 Metabase [toc=1.6 Metabase]
Metabase sits above your pipeline, turning warehouse tables into dashboards teams actually open.
Metabase is the open-source option. Self-host it and your only cost is the server plus a developer's afternoon.
🔧 Why did we choose this tool?
Metabase has the friendliest question builder in open source. A non-technical user can filter, group, and chart without SQL. Paid cloud plans start around $85 monthly.
It trades polish for simplicity. Reviewers note limited chart control and no row-level security without workarounds.
📊 Solutions offered
Connectors: Direct database connections, Shopify or Meta only via a warehouse
Query mode: No-code question builder plus native SQL editor
Intelligence: Models, segments, metrics definitions, permissions by table
Predictive: None native
Agentic reporting: Dashboard subscriptions to email and Slack
✅ Best for
Lean teams with a developer or agency who can self-host
Stores that already load data into Postgres or BigQuery
Budget-constrained brands wanting governance without seat fees
⚠️ Not recommended for
Operators with no database. Metabase queries a warehouse, so someone still has to move Shopify and Meta data into one, which is the same reason reverse ETL projects stall at small teams.
😊 Reviews
"Metabase, while user-friendly, lacks some of the more advanced features found in enterprise BI tools like Tableau or Power BI. Additionally, performance tends to degrade when dealing with very large datasets or high query volumes." — Verified reviewer, Metabase - G2 Verified Review
"If you need specific colours or pixel-perfect layouts, it falls short." — r/BusinessIntelligence, Reddit Thread
💰 Pricing
Open Source, $0 / Month (self-hosted) | Starter, from $85 / Month | Pro, from $500 / Month
1.7 ThoughtSpot [toc=1.7 ThoughtSpot]
ThoughtSpot bet everything on search. You type a question, it returns a chart, and its Spotter agent handles follow-ups.
🔍 Why did we choose this tool?
Search-first is the closest a traditional BI vendor gets to plain-English querying. Non-technical users adopt it faster than a canvas tool. G2 reviewers consistently praise that interface.
The modeling still sits underneath. Reviewers describe complex data preparation and formulas that follow neither SQL nor Excel conventions.
Agentic reporting: Scheduled Liveboards, alerts on metric thresholds
✅ Best for
Mid-market teams with a warehouse already in place
Organizations wanting search instead of dashboard navigation
Companies embedding analytics for customers
⚠️ Not recommended for
Stores without a warehouse or a data owner. Per-user pricing and enterprise focus make it heavy for a sub-$5M brand, which is where conversational analytics for ecommerce tends to land better.
😊 Reviews
"The formulas don't use SQL or Excel-style formatting, so they're difficult to build, understand, and troubleshoot." — Verified reviewer, ThoughtSpot - G2 Verified Review
"It takes a little getting used to. especially if you're used to traditional BI tools like Tableau." — Verified reviewer, ThoughtSpot - G2 Verified Review
💰 Pricing
Essentials and Pro, from $25 to $50 / Month per user | Enterprise, Custom
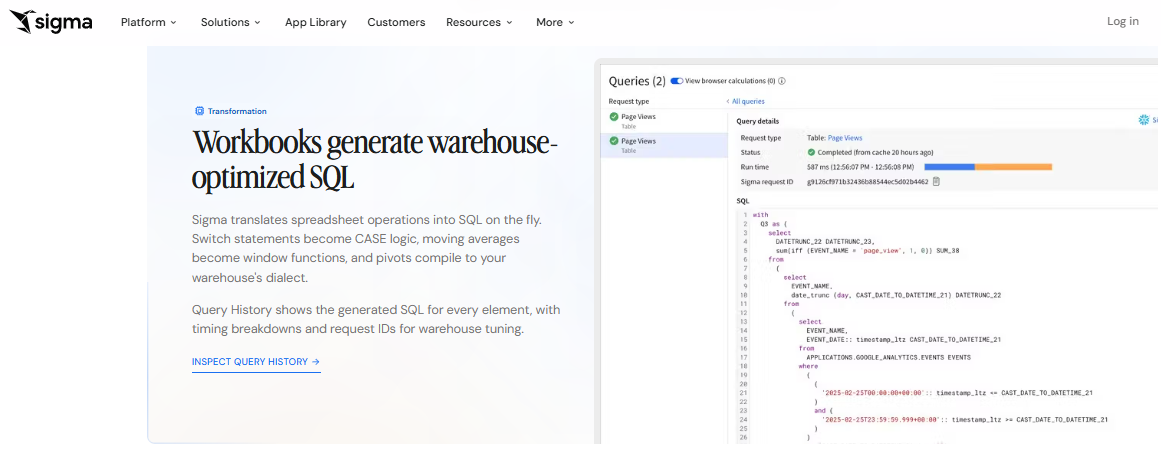
1.8 Sigma [toc=1.8 Sigma]
Sigma compiles spreadsheet logic into warehouse SQL, still assuming someone reviews the queries.
Sigma puts a spreadsheet interface on top of your cloud warehouse. Finance and ops people who think in rows and formulas take to it immediately.
🧮 Why did we choose this tool?
The spreadsheet metaphor removes the training problem. Sigma holds a 4.4 rating across 558 G2 reviews, with ease of use as the top-cited strength.
Cost predictability is the weak spot. Because compute scales automatically, reviewers report unclear spending.
Query mode: Spreadsheet formulas, pivot tables, no SQL required
Intelligence: Live warehouse queries, input tables, write-back, workbooks
Predictive: Scenario modeling through formula-driven what-if inputs
Agentic reporting: Scheduled exports, alerts, Slack and email delivery
✅ Best for
Finance and ops teams fluent in spreadsheets
Brands already running Snowflake or Databricks
Companies needing write-back and planning inputs
⚠️ Not recommended for
Stores without a warehouse, NoSQL setups, and teams needing on-premise deployment. Visual styling flexibility is limited.
😊 Reviews
"The product is intuitive and a very powerful tool. It has an excellent user interface and is easy to use, with straightforward visualizations." — Verified reviewer, Sigma - G2 Verified Review
"What I don't like about Sigma Compute is that costs can feel unpredictable at times, especially for teams running heavy or frequent queries without tight usage controls." — Verified reviewer, Sigma - G2 Verified Review
💰 Pricing
Custom quote (per-user tiers plus warehouse compute; no public free tier)
1.9 Zoho Analytics [toc=1.9 Zoho Analytics]
Zoho Analytics is the value pick. It publishes real prices, ships 500+ connectors, and includes an AI assistant called Zia.
💵 Why did we choose this tool?
Pricing is per account, not per seat. Standard runs $60 monthly for five users, and Premium $145 for fifteen. For a small team, that beats per-user platforms outright.
Depth is the limitation. Reviewers cite a learning curve on complex reports, plus performance drops above roughly 10 million rows.
📊 Solutions offered
Connectors: 500+ sources including Shopify, Google Ads, and accounting tools
Query mode: Drag-and-drop builder plus Ask Zia natural language queries
Predictive: Forecasting and predictive analytics on Premium and above
Agentic reporting: Data alerts and scheduled email reports
✅ Best for
Budget-conscious brands under 5 million rows of data
Teams already using Zoho CRM, Books, or Inventory
Multi-source reporting without per-seat costs
⚠️ Not recommended for
Brands needing publication-grade visuals or very large datasets. Chart customization trails Tableau and Power BI at similar prices, and forecasting depth trails purpose-built predictive analytics tools for ecommerce.
😊 Reviews
"The user interface can be slightly worked upon, and is not the best. It uses SQL for coding the backend." — Verified reviewer, Zoho Analytics - G2 Verified Review
"Users experience a steep learning curve with Zoho Analytics, especially for complex reports and advanced features." — Aggregated reviewer sentiment across 22 reviews, Zoho Analytics - G2 Verified Review
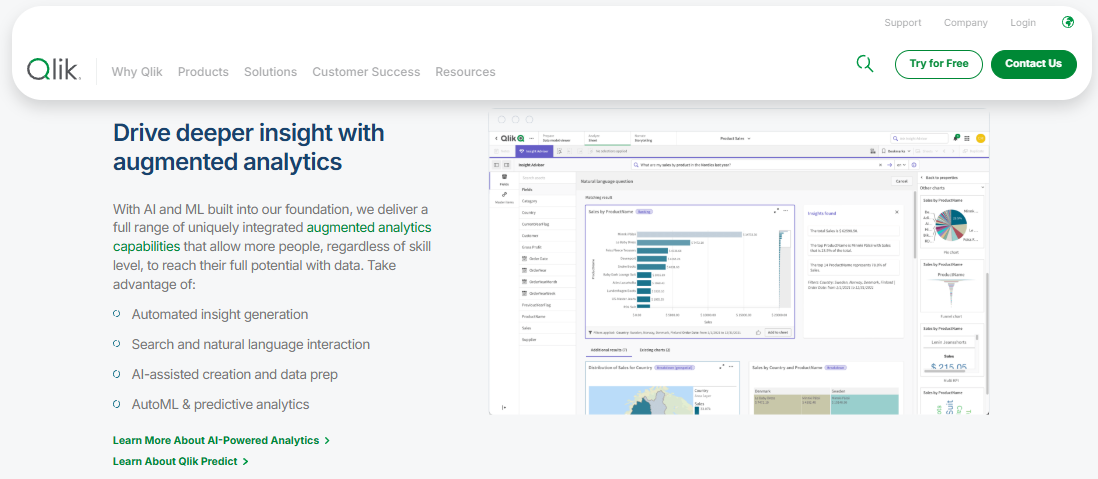
Qlik layers augmented analytics and AutoML onto an established, warehouse-dependent BI platform.
Qlik Sense runs on an associative engine. Click any value and every chart updates to show what relates to it, including what does not.
🔗 Why did we choose this tool?
That associative model is genuinely different. It surfaces gaps a filtered dashboard hides, which is useful for inventory and vendor analysis.
Cost and scripting hold it back for smaller stores. Reviewers name expense, a steep learning curve, and slow performance on large volumes.
📊 Solutions offered
Connectors: Broad connector library, ecommerce sources via Qlik Data Integration
Query mode: Associative exploration, Insight Advisor natural language
Intelligence: Set analysis, load-script transformations, governed apps
Predictive: Qlik AutoML add-on for forecasting and classification
Agentic reporting: Alerting, subscriptions, and reporting automation
✅ Best for
Ops teams exploring relationships across many datasets
Mid-market brands with scripting capability in-house
Companies wanting on-premise or hybrid deployment
⚠️ Not recommended for
Non-technical ecommerce teams. Data loading uses a scripting language, which puts a technical owner back in the loop, the exact bottleneck an AI data analyst is meant to remove.
😊 Reviews
"Users find Qlik Sense very expensive, making it a less accessible option for some businesses." — Aggregated reviewer sentiment across 14 reviews, Qlik Sense - G2 Verified Review
"Users experience slow performance with Qlik Sense, especially when handling large volumes of data and real-time updates." — Aggregated reviewer sentiment across 11 reviews, Qlik Sense - G2 Verified Review
💰 Pricing
Custom quote (per-user and capacity-based tiers; confirm your band with Qlik)
1.11 Domo [toc=1.11 Domo]
Domo is a cloud platform built for wide internal distribution. It ships over 1,000 connectors and packages dashboards as app-style cards.
🌐 Why did we choose this tool?
Connector breadth is the reason it makes the list. Reviewers praise how easily Domo pulls many sources together. If you need fifty people looking at cards, it scales.
The consumption pricing is the risk. G2 reviewers repeatedly call it unpredictable, and one reported a 1,120% renewal increase.
📊 Solutions offered
Connectors: 1,000+ sources including Shopify, Meta, Google, and accounting
Intelligence: Data governance, lineage, app-style distribution
Predictive: Domo.AI forecasting and model integration
Agentic reporting: Alerts, scheduled reports, mobile push
✅ Best for
Mid-market and enterprise teams distributing dashboards widely
Brands consolidating many disparate systems
Companies wanting mobile-first reporting
⚠️ Not recommended for
Small ecommerce teams. Pricing is credit-based and opaque, and granular exploration gets clunky beyond high-level cards, which is why lean brands lean on automated ecommerce reporting instead of card libraries.
😊 Reviews
"Users appreciate the easy integrations in Domo, enabling seamless data handling from multiple sources for informed decisions." — Aggregated reviewer sentiment across 92 reviews, Domo - G2 Verified Review
"I find the credit-based pricing makes it unpredictable, and I feel that the dashboards can be complex." — Verified reviewer, Domo - G2 Verified Review
Luca AI sits at the other end of this list on purpose. Nine of these ten tools ask you to build or buy a data layer first, then hire someone to maintain it. Our reasoning engine does the modeling on ingestion, so the operator asks the question instead of preparing the data. If you want to see how that reasoning works before you shortlist anything, start there.
Q2. How were these self-service BI tools scored and ranked? [toc=2. Scoring Methodology]
Each tool was scored out of 100 across five weighted criteria: Non-Technical Usability 25%, Ecommerce Data Coverage 25%, Prescriptive Intelligence 20%, Verified User Reviews 15%, and Pricing Transparency 15%. Scores of 0 to 20 earn one star, 21 to 40 two, 41 to 60 three, 61 to 80 four, and 81 to 100 five. Luca AI scores 5 stars.
🎯 Why these five criteria and not feature counts
Feature lists do not predict adoption. I have watched teams buy the most capable platform on the market and still run the Monday numbers in a spreadsheet. The tool that nobody opens scores zero, whatever its capability sheet says.
Adoption resistance is real, and it is usually strongest in your best people. One retail executive described her Excel-fluent staff as the hardest to move, because their existing workflow already worked. Weighting usability first is a bet on that reality.
⭐ Non-Technical Usability, 25%
This measures whether a marketing or ops hire gets an answer alone. Points come from plain-language querying, sane defaults, and short time to first answer. Points are lost for any formula language a non-analyst must learn.
Automatic disqualifier: if the vendor's own docs assume a data engineer, it cannot score above three stars here.
🔌 Ecommerce Data Coverage, 25%
This measures whether the tool reaches your actual sources. Shopify, Meta, Google, Klaviyo, accounting, 3PL, and helpdesk all count. Luca AI publishes 200+ native connectors across commerce, marketing, finance, and operations, which is why it clears this criterion without middleware.
Points are lost when ecommerce data arrives only through a third-party connector or a warehouse you must fund yourself, which is the usual trigger for a separate ecommerce data integration project.
🧠 Prescriptive Intelligence, 20%
This measures whether the tool tells you what changed and why. Root-cause analysis, anomaly detection, and pushed alerts score. A dashboard that waits for you to notice does not.
Ask Luca AI why contribution margin moved, and the answer names the influencing components rather than plotting them. That behavior is what this criterion rewards.
😊 Verified User Reviews, 15%
Scores here come from G2, Trustpilot, and Reddit threads, weighted toward recurring complaints rather than headline averages. Two examples that cost points:
"Users often find data modeling complex, leading to a steep learning curve and performance issues." — Aggregated reviewer sentiment, Microsoft Power BI - G2 Verified Review
"I find the credit-based pricing makes it unpredictable, and I feel that the dashboards can be complex." — Verified reviewer, Domo - G2 Verified Review
💰 Pricing Transparency, 15%
Published prices score. Consumption credits, GMV bands, and quote-only models lose points, because a founder cannot budget against them. Domo reviewers repeatedly flag steep renewal increases, which is exactly the risk this criterion prices in.
Luca AI publishes flat monthly tiers rather than usage credits, so this criterion cuts in our favor, and I will say so plainly.
⭐ Star bands
Score Bands and Star Ratings
Score band
Stars
0 to 20
⭐
21 to 40
⭐⭐
41 to 60
⭐⭐⭐
61 to 80
⭐⭐⭐⭐
81 to 100
⭐⭐⭐⭐⭐
One disclosure: Luca AI publishes this list and appears first in it. The rubric above is how you can check my work, and the individual scores are not stated anywhere, only the bands.
Q3. What does self-service BI actually mean when your data lives in Shopify, Meta, and a 3PL? [toc=3. Self-Service BI Defined]
Self-service BI lets non-technical users query, visualize, and report without SQL or a ticket to a data team. In ecommerce it breaks earlier than elsewhere, because order, ad, returns, fulfillment, and support data arrive in incompatible schemas. The tool then answers confidently from numbers that were never reconciled.
📖 The definition, and the contrast
Traditional BI (business intelligence) means analysts build reports and you request them. Self-service BI means you explore the data yourself, inside guardrails someone else set.
Traditional BI vs Self-Service BI
Dimension
Traditional BI
Self-service BI
Who builds
Analysts and IT
Business users
Speed
Days per request
Minutes per question
Governance
Central and tight
Depends on the data model
Failure mode
Backlog
Confident wrong answers
🧩 Where the ecommerce stack breaks it
The break happens before the interface. Your order system, ad platforms, returns tool, and 3PL each define time, revenue, and identity differently.
Retail calendars are a good example. Some systems report on a 5-5-4 week structure, others on 4-4-5, and invoice sales rarely match demand sales. Join those without reconciliation, and the chart is wrong in a way nobody catches.
🔍 The connector audit to run before you buy
Do this in twenty minutes, on paper, before any demo:
List every system that holds a number you argue about
Mark which ones the tool connects to natively, not through a partner
Mark which ones need a warehouse you do not have yet
Note who owns the definition of revenue, CAC, and returns today
Count the systems left over, because that count is your real project
Luca AI reads commerce, marketing, finance, accounting, banking, and operations sources into one model, so this audit usually ends with fewer leftovers than a warehouse-first build or a reverse ETL pipeline.
⚠️ A BI layer is not an attribution pixel
This confuses a lot of buyers, so let me be direct. A self-service BI layer sits over your unified data and answers questions across it. An attribution tool decides which channel gets credit for a sale.
Triple Whale's first-party pixel reports match rates around 70% to 85%, against roughly 40% to 60% for a raw Meta pixel. No BI tool fixes that number. If channel credit is your core problem, buy attribution, then buy reporting, and read the Triple Whale alternatives before you sign an annual band.
🏗️ Standardize at ingestion, not at reporting
Every hour spent cleaning data inside the reporting layer gets spent again next month. Clean it once, on the way in, and every future question inherits that work.
That is the honest version of self-service. The interface is the last 10% of the problem, and most buyers shop for it first.
Luca AI normalizes and standardizes data on ingestion, which is why a question spanning ad spend, returns, and support tickets resolves in one pass instead of three exports and a pivot table.
Q4. Why do most no-SQL BI tools still need someone technical? [toc=4. No-SQL Reality Check]
Most no-SQL tools still need a technical owner, because someone must build the data model, write calculated measures, and maintain metric definitions before business users can click anything. Search-first and LLM-native interfaces remove that step. Drag-and-drop and spreadsheet interfaces do not, and reviewers consistently cite formula complexity as the blocker.
🧨 The claim, and the flaw in it
"No code required" is technically true and practically misleading. You will not write SQL. You will write DAX, or a load script, or a calculated field, which is code with better marketing.
I watched a very capable operator get halfway through building this himself, then stop and say the query language was too nerdy to bother with that day. That is the honest reaction of a busy founder, and it is where most self-service projects quietly die.
🧭 The four interface archetypes
Self-Service BI Interface Archetypes
Archetype
Skill it assumes
Who adopts it
Drag-and-drop
Formula language plus modeling
Teams with a data owner
Spreadsheet
Advanced spreadsheet fluency
Finance and ops
Search-first
Learning a query syntax
Analysts and power users
LLM-native
Plain language only
Marketing, ops, founders
Pick the archetype your team already thinks in. Luca AI is LLM-native, so the assumed skill is describing your problem in a sentence, which is the only skill a five-person team reliably has, and it is the premise behind conversational analytics for ecommerce.
💬 What reviewers actually say
The pattern across platforms is consistent. Ease of use gets praised in onboarding, then the modeling layer shows up.
"One thing I don't like about Tableau is that it is more expensive than Power BI. It also takes more time to learn, especially the advanced features." — Verified reviewer, Tableau - G2 Verified Review
"The formulas don't use SQL or Excel-style formatting, so they're difficult to build, understand, and troubleshoot." — Verified reviewer, ThoughtSpot - G2 Verified Review
"Users often find data modeling complex, leading to a steep learning curve and performance issues." — Aggregated reviewer sentiment, Microsoft Power BI - G2 Verified Review
💸 Pricing the self-service tax
Seats are the cheap part. The expensive part is the person who maintains the model, plus the build before anyone gets an answer.
Here is the arithmetic at Power BI Pro's $14 per user, with an internal owner on a $70,000 salary:
The Real Monthly Cost of Self-Service BI by Team Size
Team size
Seats per month
Owner time
Real monthly cost
5 seats
$70
15% of one salary
about $945
15 seats
$210
25% of one salary
about $1,670
40 seats
$560
50% of one salary
about $3,475
Those owner percentages are my estimates from watching implementations, not published figures, so treat them as a range. Even at the low end, the seat price is under a quarter of the true cost, which is the number most unit economics reviews miss.
✅ What actually removes the tax
Only two things do. Either the vendor maintains the semantic layer for you, or the system reasons over normalized data with no semantic layer to maintain.
Everything else moves the work around. My read is that hiring an analyst to run a self-service tool is a reasonable choice above roughly $10M revenue, and a bad one below it, which is the gap an AI data analyst is built to close.
Luca AI does the normalizing and the metric reasoning on its own side of the line, so the modeling step never lands on the buyer's payroll.
Q5. Do you need a BI tool yet, or is Shopify Analytics still enough? [toc=5. Do You Need One]
If you run one storefront, two ad channels, and under roughly $1M in annual revenue, Shopify's native analytics plus one spreadsheet is usually enough. Shopify ships free dashboards, custom reports, a query editor, and automated insights across 80+ data combinations for stores averaging ten or more orders per week. Buy BI when questions start crossing systems.
🛑 The verdict first
Most stores that buy BI too early do not have a data problem. They have a two-channels-and-a-spreadsheet problem, and they buy a platform to solve it.
I would rather lose the sale than watch a founder pay for seats nobody logs into. The money is better spent on inventory at that stage.
✅ What Shopify already gives you free
Native reporting covers more ground than most operators realize. Shopify's Analytics page updates within about a minute and covers sales, sessions, and fulfillment.
Prebuilt dashboards for sales, sessions, and payments
Custom reports on orders, products, customers, and inventory
ShopifyQL query editor for anyone willing to learn it
Automated insights on the Home feed at 10+ orders per week
Real-time data with no setup or connectors to maintain
If you have not walked through what native reporting already covers, the Shopify analytics dashboard is the first place to look before you shop.
⚠️ The three signals you have outgrown it
Watch for these, not for a revenue number alone.
Questions cross systems. The answer needs order data plus ad spend plus returns plus support tickets. Native reporting cannot join those.
More than one person is asking. When a marketer, an ops lead, and you all need answers, exports become a bottleneck.
Decisions wait on a file. A pricing or reorder decision sits for two days while someone rebuilds a pivot table.
One European operator described exactly that gap before automating: she needed an expert, waited two days for an email answer, and by then the customer had moved on. That delay is the practical case for automated ecommerce reporting.
💰 The three-tier rule
Apply this in five minutes. Count your revenue and your data sources, then match the tier.
When to Buy Self-Service BI by Revenue Stage
Stage
Sources
What to buy
Under $1M
2 to 3
Shopify native plus one spreadsheet, $0 per month
$1M to $10M
4 to 8
An AI reasoning layer or a value BI tool, $30 to $500 per month
$10M plus, data team in place
8 or more
Governed BI on a warehouse, $800 per month and up
The middle tier is where most brands sit, and where the wrong purchase hurts most. Warehouse-first builds at $1M revenue create a project, not an answer, which is why the ecommerce tech stack decision matters more than the interface.
⏰ The cost nobody prices
The real expense at the middle tier is not the subscription. It is the four hours every Monday that a founder spends assembling numbers instead of buying inventory or writing creative.
At a $150,000 founder salary, four hours weekly is roughly $1,250 a month of your own time. Compare that number to the tool price, not to zero.
Luca AI fits the stage after native reporting stops answering, when one question spans ads, inventory, and support in a single sentence. Below that stage, Shopify's free reports do the job, and I would rather you keep the cash.
Q6. Which questions should you test every tool with before you pay? [toc=6. Trial Test Questions]
Test every tool on your own data with six questions: true contribution margin by SKU, new versus repeat revenue by channel, the root cause behind a blended ROAS move, which SKUs generate disproportionate support tickets, what stocks out before your next PO lands, and whether the tool can show how it reached each answer.
🧪 Why demo datasets lie
Vendor demos run on clean, pre-modeled data. Your data has duplicate SKUs, refunds posted in the wrong month, and three spellings of the same channel name.
Run the trial on your own connectors, or the trial tells you nothing. Ask Luca AI or any competing tool the same six questions, on the same day, and compare the answers side by side.
💰 Question 1: True contribution margin by SKU
Gross margin only tells you what the product cost to make. It says nothing about what it costs to sell.
I sat with a founder whose hero product showed 72% gross margin. After shipping, returns, and support costs went in line by line, actual contribution margin came out at 8%. A passing answer includes all four cost layers, not just COGS, which is the whole point of tracking ecommerce profit margins properly.
📊 Question 2: New versus repeat revenue by channel
This is the question that exposes fake growth. Triple Whale's 2025 benchmark data across 30,000+ brands showed CPMs up 16%, CPA up 8.6%, and ROAS down 5.7%.
If your revenue held steady in that environment, existing customers probably carried it. A passing answer splits first-time and returning revenue per channel, per month, which is the base layer of any ecommerce customer analytics work.
🔍 Question 3: Root cause behind a ROAS move
Any tool can plot ROAS falling. Very few can say why.
Ask Luca AI why blended ROAS dropped last month, and the answer names the influencing components, such as CPM inflation, creative fatigue, or a mix shift toward a lower-margin SKU. A failing answer just shows you the line going down, which is the gap between platform ROAS and true profitability.
🎫 Question 4: Which SKUs drive disproportionate support tickets
One product I reviewed generated 42% of all customer service tickets, which worked out to $1.45 per unit in support cost. That cost never appears in any margin report.
A passing answer joins helpdesk data to order data. Most BI tools cannot, because the helpdesk was never connected, which is a straight data collection failure rather than an analysis one.
📦 Question 5: What stocks out before your next PO lands
This is a forecasting question with a cash consequence. Getting it wrong means either dead stock or lost sales.
Luca AI pushes reorder alerts based on velocity trends rather than static thresholds, which is the behavior to look for. A passing answer names specific SKUs and dates, not a generic inventory management chart.
🧠 Question 6: Can it show its work
This one matters more than the other five combined. Research covering 875 DTC brands found 93.5% now use AI, with trust in unverifiable output cited as the biggest barrier.
Ask the tool to show which tables, filters, and date ranges produced its number. If it cannot, you have a confident guesser, not an analyst, and that is the core test when evaluating AI data agents.
📋 Your scoring sheet
Score each question 0 for failed, 1 for partial, 2 for passed. Anything under 8 out of 12 is not ready for your team.
Trial Test Questions and the Joins They Require
Test
Cross-source join required
Contribution margin
Orders, shipping, returns, support
New versus repeat
Orders, ad platforms
ROAS root cause
Ad platforms, orders, product margin
Support cost by SKU
Helpdesk, orders
Stockout forecast
Inventory, order velocity
Explainability
All of the above
Luca AI was built around these six questions, which is why the support-cost join and the root-cause step work without a modeling sprint first.
Q7. How do you roll self-service BI out to a non-technical team without losing control of the numbers? [toc=7. Rollout and Governance]
Run it in four weeks: connect and reconcile two sources, write the context pack of catalog and margin rules, onboard three named question-owners, then retire the reports nobody opens. Governance survives by locking metric definitions centrally while leaving questions open, and by moving from dashboards people check to alerts that reach them.
📅 Week one: connect two sources, not ten
Start with orders and ad spend. Reconcile them against your bank and your P&L before anyone asks a question.
The failure mode here is connecting everything at once. You end up debugging six pipelines instead of trusting two numbers.
📝 Week two: write the context pack
Think of onboarding a brilliant new hire on day one. Even a PhD fails if you hand them a task with no context about your catalog, your customers, or your rules.
Write down your product taxonomy, your margin logic, your channel naming conventions, and your fiscal calendar. Luca AI ingests that context pack before the first question, which is why its early answers already use your vocabulary.
👥 Week three: name three question-owners
Do not train everyone. Pick one person each from marketing, ops, and finance, and make them the ones who ask.
The failure mode is output overload. One operator gave an AI agent broad access and got twenty executive summaries running twenty-five pages each, with no idea what to do next, which is the risk with any agent deployment that skips scoping.
🗑️ Week four: retire what nobody opens
Every new report has to kill an old one. Otherwise you have added a system, not replaced one.
Check access logs, then delete anything unopened for thirty days. Ask Luca AI to send the weekly CAC report with reasoning attached, and the old manual version has no reason to survive.
😊 The Excel-loyal holdout
Your most resistant person will be your best spreadsheet user. Their workflow already works, so a new tool reads as pure cost to them.
Reviewers describe this friction plainly across platforms:
"It takes a little getting used to. especially if you're used to traditional BI tools like Tableau." — Verified reviewer, ThoughtSpot - G2 Verified Review
"Users find the learning curve steep, struggling with the platform's complexity and the need for extensive training." — Aggregated reviewer sentiment, Domo - G2 Verified Review
Win them by giving them a question their spreadsheet cannot answer, not by taking the spreadsheet away.
🔒 Governance lives in definitions, not permissions
The instinct is to restrict access. That is the wrong lever, and it recreates the request backlog you paid to escape.
Lock the definitions instead. One owner controls what CAC, contribution margin, and new customer mean, and everyone else asks freely inside those definitions, which is the practical core of ecommerce data management.
🔔 The shift that actually sticks
Dashboards require someone to remember to look. Alerts do not.
Luca AI scans connected data around the clock and pings Slack or email when ROAS dips, CAC spikes, or inventory crosses a threshold. That is cohort-level vigilance without the cohort-level dashboard.
My working hypothesis for the next eighteen months is that the dashboard becomes a receipt rather than a workspace. The chart exists to prove the recommendation, not to be studied. If your team is already living that way, I would genuinely like to hear what broke first, and you can tell us what you are building.
FAQ's
What are self-service BI tools, and how are they different from traditional BI?
Self-service BI tools let non-technical users query, visualize, and report on business data without writing SQL or filing a request with a data team. Traditional BI works the other way round: analysts build the reports, you request them, and you wait.
The practical difference shows up in four places:
Who builds: analysts and IT in traditional BI, business users in self-service BI.
Speed: days per request versus minutes per question.
Governance: centrally controlled versus dependent on how the data model was defined.
Failure mode: a reporting backlog versus confident answers built on unreconciled numbers.
In ecommerce, the category breaks earlier than it does elsewhere. Your order system, ad platforms, returns tool, 3PL, and helpdesk each define time, revenue, and identity differently, so a join across them can be wrong in a way nobody notices. Retail calendar conventions alone (5-5-4 versus 4-4-5) will misalign two systems that both look correct.
Luca AI normalizes and standardizes data on ingestion rather than at reporting time, which is why a question spanning ad spend, returns, and support tickets resolves in one pass. If you want the category mapped against your own stack first, start with our guide to ecommerce business intelligence.
Which self-service BI tool genuinely requires no SQL for a non-technical ecommerce team?
Search-first and LLM-native tools remove the coding step. Drag-and-drop and spreadsheet-style tools usually do not, even when they are marketed as no-code.
Think in four interface archetypes:
Drag-and-drop (Power BI, Tableau): assumes a formula language plus data modeling, so it suits teams with a data owner.
Spreadsheet (Sigma): assumes advanced spreadsheet fluency, which fits finance and ops.
Search-first (ThoughtSpot): assumes learning a query syntax, best for analysts and power users.
LLM-native (conversational layers): assumes only plain language, which is what a five-person team reliably has.
The evidence on this is consistent in public reviews. Power BI reviewers repeatedly name complex data modeling and the DAX learning curve, and ThoughtSpot reviewers note that its formulas follow neither SQL nor Excel conventions. Both are capable platforms. Both still need someone technical to stand up the model.
Luca AI is LLM-native, so the assumed skill is describing your problem in a sentence, and no semantic layer lands on your payroll. Read how conversational analytics for ecommerce changes the question your team can ask on a Monday morning.
Are there free self-service BI tools worth using for a Shopify store?
Yes, three genuinely free options are worth a look, and one of them you already own.
Shopify native analytics: free dashboards, custom reports, the ShopifyQL query editor, and automated insights for stores averaging ten or more orders per week.
Looker Studio: free dashboards with native GA4 and Google Ads connectors, ideal when your paid media is mostly Google.
Metabase: open source and self-hostable, with the friendliest no-code question builder in that category.
The catch is what free does not cover. Looker Studio slows badly once row counts grow and blending gets heavy, which practitioners complain about openly. Metabase queries a database, so someone still has to move Shopify and Meta data into one. Native Shopify reporting cannot join order data to ad spend, returns, and support tickets.
Our honest position is that under roughly $1M in annual revenue with two ad channels, free plus one spreadsheet is the right answer, and the cash belongs in inventory. When a single question starts crossing systems, that is the moment to pay. Compare what free reporting covers in our breakdown of the Shopify analytics dashboard.
How much do self-service BI tools actually cost once setup and maintenance are included?
List prices span from free to enterprise contracts, but the seat price is rarely the real number.
Published entry points at the time of writing:
Power BI from about $14 per user monthly, Premium Per User about $24.
Tableau from $15 (Viewer) to $75 (Creator) per user monthly.
Zoho Analytics from $30 to $575 monthly, priced per account rather than per seat.
Metabase free self-hosted, cloud plans from roughly $85 to $500 monthly.
Triple Whale from $219 to $749 monthly on GMV bands. Domo and Qlik are quote-based.
Then add the self-service tax. Someone has to build the model, write the measures, and maintain metric definitions. At Power BI Pro pricing with an internal owner on a $70,000 salary, fifteen seats cost about $210 in licences and roughly $1,670 once you price a quarter of that person's time. Those percentages are our estimates from watching implementations, not published figures, so treat them as a range.
Luca AI publishes flat monthly tiers instead of usage credits, which is deliberate, because a founder cannot budget against consumption. See the current plan pricing before you compare annual commitments.
Do self-service BI tools replace an attribution platform like Triple Whale?
No, and conflating the two is the most common evaluation error we see. These are separate purchases solving separate problems.
An attribution tool decides which channel gets credit for a sale. Triple Whale's first-party pixel reports match rates around 70% to 85%, against roughly 40% to 60% for a raw Meta pixel.
A self-service BI layer sits over your unified data and answers questions across it, including margin, inventory, cohort, and support-cost questions no pixel can touch.
No BI tool improves your match rate. No attribution pixel tells you that your 72% gross margin hero SKU delivers single-digit contribution margin once shipping, returns, and support cost are counted. If channel credit is your core problem, buy attribution first, then buy reporting.
Luca AI is an AI layer over your unified ecommerce data, not an attribution pixel, and we say so plainly rather than implying overlap that does not exist. Where it earns its place is the financial and operational layer that channel tools never see. If you are mapping the two categories against each other, our comparison of Triple Whale alternatives sets out where each one stops.
Enjoyed the read? Join our team for a quick 15-minute chat — no pitch, just a real conversation on how we’re rethinking Ecommerce with AI - Luca
Loading Schedule...
Your AI Co-Founder is here.
Here’s why:
Shopify, Meta, Xero - one brain.
"Should I scale?" Answered with real data.
Growth capital. No applications. One click.
Thank you! Your submission has been received! Please book a time slot for the Meeting
Oops! Something went wrong while submitting the form.