11 Best No-Code Analytics Platforms for Ecommerce — Dashboard Builders, Chat Interfaces and Sheet-Native Tools Compared
13
mins read
TL;DR
Three no-code surfaces exist: dashboard builders, chat interfaces, and sheet-native grids. Only chat over normalized connectors is genuinely no-code end to end.
Visual builders remove SQL from the analyst's chair, then hand the semantic-layer job to a BI engineer most sub-$5M ecommerce stores do not employ.
Gross margin hides the truth. One hero product showing 72% gross margin returned 8% contribution margin once all eight variable costs were allocated per unit.
Shopify removed Compare-to-Benchmarks on 19 May 2026 and keeps ShopifyQL Notebooks Plus-only, which pushed mid-market merchants to shop outside the admin.
Reconcile every tool monthly against Shopify revenue and quarterly against a geo holdout. A variance above 15% means recalibrate before you act.
At a 10.6% net margin, a $250 per month tool needs roughly $28,000 in extra annual revenue to break even, so model payback before any trial.
Q1. What are the 11 best no-code analytics platforms for ecommerce in 2026? [toc=1. The 11 Platforms Ranked]
Three kinds of tool get called "no-code" in this category, and they behave nothing alike. Dashboard builders hand you a canvas and expect somebody to model the data first. Chat interfaces let you ask a question in plain English and answer it. Sheet-native tools put a spreadsheet grid over a warehouse so your planning stays where it already lives. I ranked all eleven on ecommerce connector depth, not on feature counts, because a tool that cannot see your accounting or 3PL data will never answer the question that actually matters to your bank account.
The 11 best no-code analytics platforms for ecommerce in 2026 are Luca AI, Triple Whale, Looker Studio, Sigma Computing, ThoughtSpot, Metabase, Databox, Mixpanel, Julius AI, Power BI, and Google Sheets with Gemini. Luca AI leads because it is an AI layer over your warehouse that normalizes commerce, ad, accounting, and support data on ingestion, then returns reasoned answers instead of charts you still have to interpret.
The shortlist at a glance [toc=1.0 Shortlist Overview]
Luca AI, best for plain-English ecommerce intelligence across commerce, ads, and finance data
Triple Whale, best for DTC marketing attribution and daily profit dashboards
Looker Studio, best for free Google-native reporting
Sigma Computing, best for spreadsheet-native analysis on a warehouse
ThoughtSpot, best for natural-language search over modeled data
Formula generation, chart suggestions, natural-language help in the sidebar
Light analysis on exports you already keep in Sheets
Included with Workspace to Custom
1.1 Luca AI [toc=1.1 Luca AI]
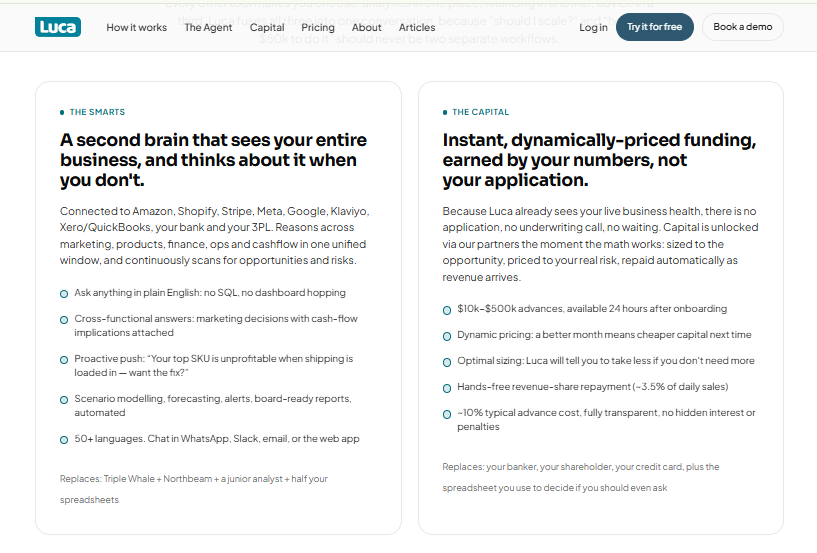
Luca AI pairs a no code analytics platform with instant dynamically-priced funding for ecommerce operators
⭐ Why did we choose this tool?
Luca AI sits first because it is the only platform on this list that reaches commerce, ad, accounting, 3PL, and customer support data in one place, and normalizes it on ingestion. I put my own product at the top, and you should discount that by whatever amount feels right. The reason it survives my own scoring is the connector depth, not the marketing.
The category's failure mode is that answers stop at the marketing boundary. Ask a dashboard builder why last month's contribution margin fell, and it cannot see the returns, fees, or support costs. That is an architecture problem, not a feature gap.
📊 Core evaluation metrics
No-code surface: Chat plus dashboards, no SQL or modeling step required
Ecommerce connectors: Shopify, Meta, Google, Klaviyo, accounting, 3PL, support
Time to first answer: Days, because definitions are normalized at ingestion
Proactive alerts: Yes, pushed to Slack, email, and mobile on anomalies
Entry price: €299 per month
✅ Solutions offered
Plain-English questions across sales, marketing, product, profit, and customer data, delivered through conversational analytics
Root-cause analysis that names the influencing components behind a metric move
Predictive signals for reorder timing, sales pacing, and product-level performance
Automated periodic reports with graphs, reasoning, and recommendations
Continuous 24/7 monitoring with outlier alerts on ROAS, CAC, and inventory thresholds
❤️ Best for
Ecommerce stores between $1M and $5M in revenue with data piling up unused
Teams with no analyst and no appetite for a warehouse project
Operators who need cross-source answers, covering ads, orders, and cost lines
💰 Case study
The problem. A European skincare brand doing roughly €2M a year across Shopify and Amazon ran its weekly reporting from six exports. Their best-selling serum showed a 68% gross margin. Nobody had allocated returns, split shipping, or helpdesk time to it.
How Luca AI helped. Luca AI connected Shopify, Meta, Google, Klaviyo, and their accounting stack, then normalized cost definitions on ingestion. The founder asked, in plain English, for contribution margin by SKU after all variable costs.
The outcome. The serum's true contribution margin came in near 11%, dragged down by a 14% return rate on the 100ml size. They discontinued that variant, kept the 50ml, and reallocated spend. Weekly reporting time dropped from most of a Monday to a Slack digest.
💸 Pricing
[ Starter, €299 / Month | Growth, €499 / Month | Scale, Custom Pricing ]. Full tier details sit on the Luca AI pricing page.
⚠️ Where Luca AI is not the answer
Luca AI does not fit stores below roughly $1M in revenue, because there is not enough trading history to reason against. It also is not an attribution pixel, so it does not replace Triple Whale or Northbeam for click-level modeling. Enterprises with their own data team will get more from a governed builder.
1.2 Triple Whale [toc=1.2 Triple Whale]
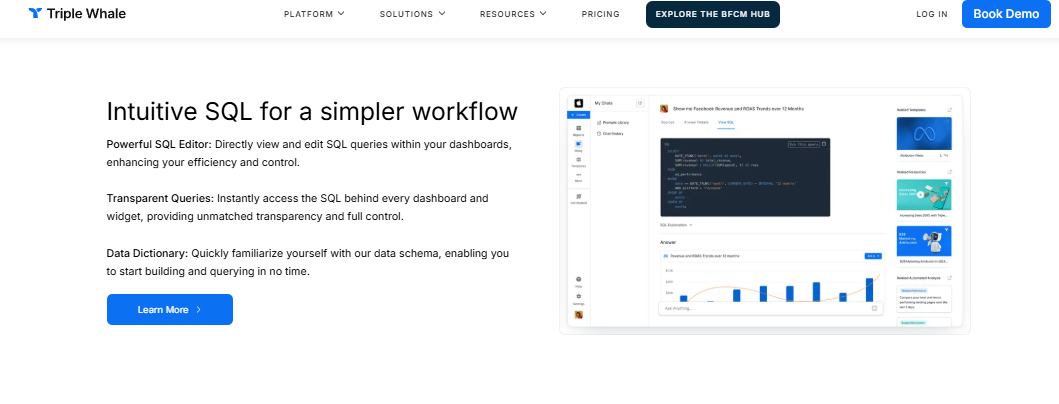
Triple Whale exposes SQL behind dashboards, showing where no code analytics still needs query skills
⭐ Why did we choose this tool?
Triple Whale earned its place because it is the default analytics layer for Shopify-first DTC brands running paid social. Its first-party pixel reconstructs conversion paths that Meta's own reporting loses, and the blended profit view is genuinely useful before your first coffee. For a brand whose main question is "which creative is working," it is hard to beat.
The limit is scope. Triple Whale is built for marketing efficiency, so it does not see your accounting system, your working capital, or your support costs. Pricing also escalates with trailing GMV, which means growth alone moves you up a tier, a pattern covered in more depth in our guide to Triple Whale alternatives.
📊 Core evaluation metrics
No-code surface: Prebuilt dashboards plus Moby chat agents
Ecommerce connectors: Shopify, Meta, Google, TikTok, Klaviyo, and more
Time to first answer: Hours, since dashboards ship prebuilt
Proactive alerts: Yes, on marketing metrics inside its own scope
Entry price: Free tier, then from $219 per month
✅ Solutions offered
Multi-touch attribution using a first-party pixel
Blended daily profit and MER dashboard
Creative-level ad reporting across paid channels
Moby AI agents for automated analysis workflows
Marketing mix modeling on higher tiers
❤️ Best for
Shopify-first DTC brands with meaningful paid social spend
Growth leads who need creative and channel decisions daily
Brands above roughly $2M GMV, where the GMV-banded price still pencils out
😊 Reviews
"Triple Whale is very user-friendly and easy to navigate to find the data you need across multiple channels. Relevant channels like emails, ads, organic, etc are already broken down for you and when looking at the specific channel, you have the option to customize the table displaying the data to choose which metrics are most relevant for your needs. Some data we still notice discrepancies between platforms, for example, tracking ads, and differences in the reported metrics like revenue." — Verified User, Triple Whale - G2 Verified Review
"Its very easy to use and works good for a multichannel solution. Sometimes it does not update the numbers correctly and has errors with synchronisation." — Verified User, Triple Whale - G2 Verified Review
⚠️ The honest limit
Both reviews above land on the same thing, which is reconciliation. Triple Whale's modeled numbers need checking against Shopify, and independent testing has put reported-versus-blended ROAS gaps at 25% to 40% on broad Advantage+ campaigns. That is not a bug so much as the nature of modeled attribution. Budget an hour a month to reconcile before you act on the number, using the approach in our breakdown of declining platform ROAS versus true profitability.
1.3 Looker Studio [toc=1.3 Looker Studio]
⭐ Why did we choose this tool?
Looker Studio is on the list because it is free, and free matters when your cash is sitting in inventory. It connects to GA4, Google Ads, and Sheets in minutes. For a store that just needs a shared traffic and revenue report, it does the job.
⚠️ Where it stops being free
The cost shows up as your time. Blending data sources is slow, and Shopify cost data has to arrive through a connector or a manual export. You are the data engineer in this setup, which is the trade-off we cover in our guide to ecommerce data integration.
📊 Core evaluation metrics
No-code surface: Drag-and-drop dashboard canvas
Ecommerce connectors: Native Google sources, third-party connectors for Shopify
Time to first answer: Hours for a simple report, days for blended views
Proactive alerts: No anomaly alerting, scheduled email delivery only
Stores under roughly $1M in revenue with no analytics budget
Teams whose data already lives in Google products
Simple traffic, spend, and revenue reporting for one stakeholder
😊 Reviews
"Loading the dashboard isn't too bad, but filtering is exhaustingly slow." — Commenter, r/Looker Reddit Thread
"Also, in general, I've found using looker studios blending features to be a nightmare. Plenty of limitations and makes the performance horrible." — Commenter, r/GoogleDataStudio Reddit Thread
1.4 Sigma Computing [toc=1.4 Sigma Computing]
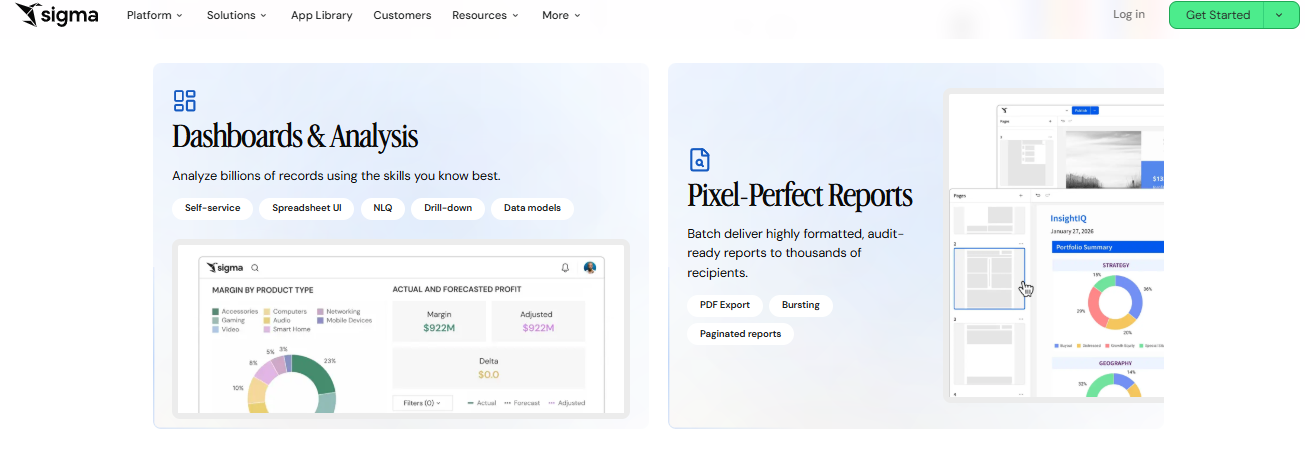
Sigma delivers spreadsheet-native analysis and audit-ready reports over a warehouse, the third no code surface
⭐ Why did we choose this tool?
Sigma earns a place because it respects how operators actually work. Your buying plan lives in a spreadsheet, and Sigma puts a spreadsheet grid on top of your warehouse. Nobody has to learn a new mental model.
💰 The writeback advantage
Sigma supports governed writeback, so scenario inputs and plan changes stay auditable. G2's head-to-head comparison shows Sigma winning on its spreadsheet-like interface, while ThoughtSpot wins on ease of use and AI features. That trade-off is real, and it maps to how your team thinks.
📊 Core evaluation metrics
No-code surface: Spreadsheet grid over a live warehouse
Ecommerce connectors: Warehouse-dependent, no direct Shopify pull
Time to first answer: Weeks, since a warehouse must exist first
Proactive alerts: Scheduled alerts, not autonomous anomaly discovery
Entry price: Free trial, then custom quote
✅ Solutions offered
Spreadsheet-style exploration on live warehouse tables
Governed writeback for planning and what-if inputs
Sharable workbooks with row-level permissions
Live queries without data extracts
Embedded analytics for partner reporting
❤️ Best for
Brands above roughly $10M that already run a warehouse
Finance and merchandising teams who plan in spreadsheets
Companies with at least one person who can model data
1.5 ThoughtSpot [toc=1.5 ThoughtSpot]
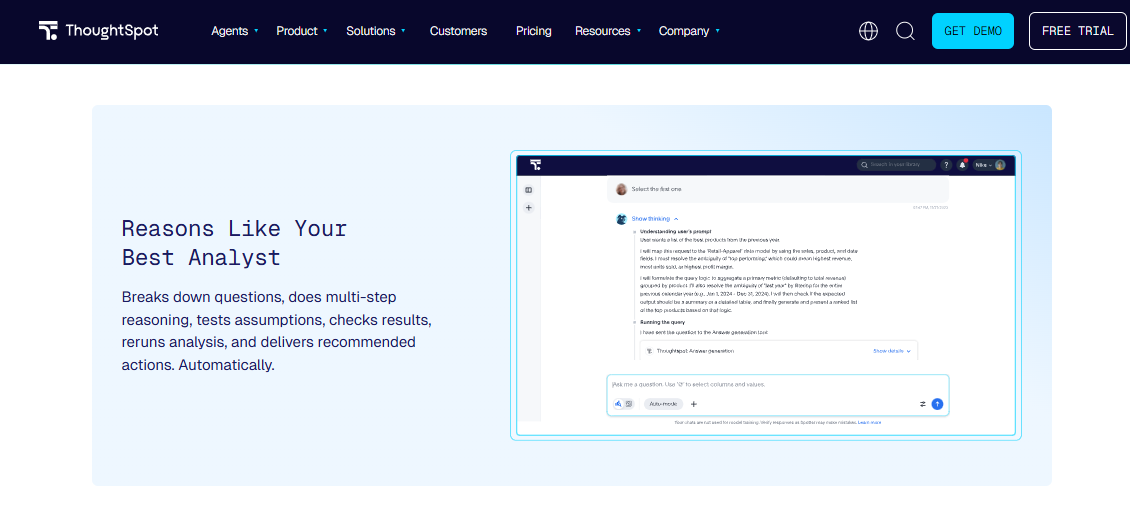
ThoughtSpot's agent breaks questions into steps, tests assumptions and returns recommended actions automatically
⭐ Why did we choose this tool?
ThoughtSpot pioneered search-style analytics, and it still does that well. You type a question the way you would type a Google search. It holds a 4.4 out of 5 rating across 340 G2 reviews, with ease of use and AI cited as its headline strengths.
❌ The prerequisite nobody mentions
Search only works over data somebody has already modeled. That modeling job is a BI engineer's work, and most sub-$5M stores do not employ one. This is the clearest example of no-code at the front, code at the back, and it is why self-service BI tools often stall before launch.
📊 Core evaluation metrics
No-code surface: Natural-language search over modeled data
Ecommerce connectors: Warehouse-first, no native Shopify or Klaviyo pull
Time to first answer: Weeks, gated on data modeling
Proactive alerts: SpotIQ change analysis and monitored KPIs
Entry price: Free trial, then custom quote
✅ Solutions offered
Search-style natural-language questions
Auto-generated charts and Liveboards
Change analysis on tracked metrics
Embedded analytics for external users
Role-based governance over the semantic layer
❤️ Best for
Mid-market retailers with a modeled data layer in place
Teams with many casual question-askers across departments
Organizations that need governed answers, not ad-hoc files
1.6 Metabase [toc=1.6 Metabase]
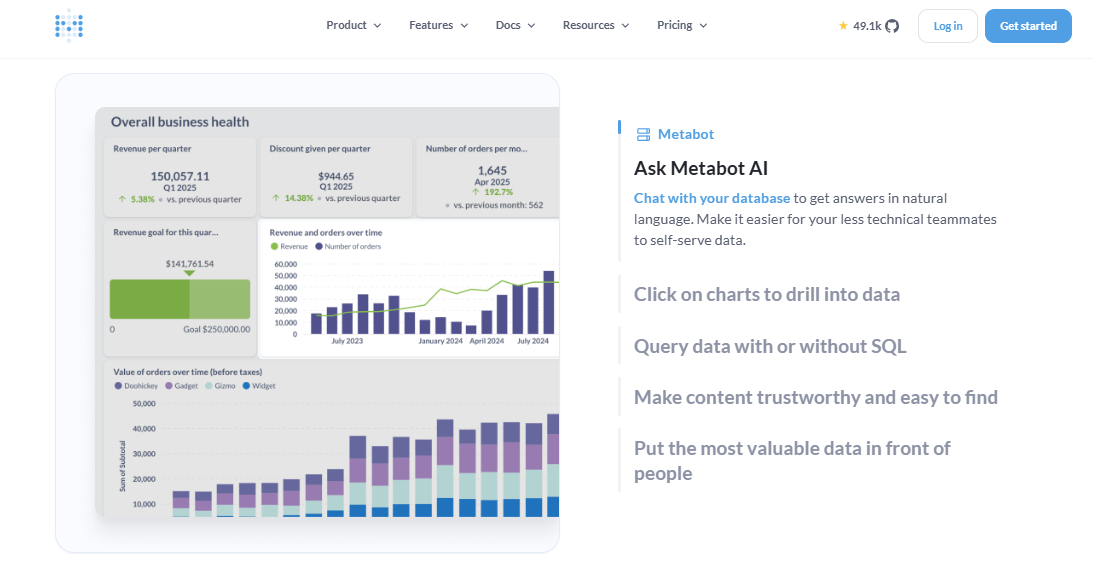
Metabase shows revenue dashboards plus Metabot chat, letting non-technical teammates self-serve without SQL
⭐ Why did we choose this tool?
Metabase is the honest open-source option. Its visual question builder lets someone answer a database question without writing SQL, which stands for Structured Query Language. Self-hosting is free, and Metabase Cloud starts at $10 per user per month.
⏰ What the free version costs you
Somebody has to run the instance, manage upgrades, and get your data into a database first. Shopify, Meta, and Klaviyo do not arrive on their own. Budget developer hours, not licence fees, and price that against the ETL tooling a small business actually needs.
📊 Core evaluation metrics
No-code surface: Visual query builder plus dashboards
Ecommerce connectors: None native, requires a database or pipeline
Time to first answer: Weeks, because ingestion is your problem
Proactive alerts: Yes, threshold alerts on saved questions
Entry price: Free self-hosted, Cloud from $10 per user per month
✅ Solutions offered
No-SQL question builder over connected databases
Dashboards with filters and drill-through
Threshold alerts to email and Slack
Self-hosted deployment for full data control
Pro and Enterprise tiers for SSO and advanced security
❤️ Best for
Technical founders comfortable running their own stack
Stores with data already sitting in Postgres or BigQuery
Teams who need data residency control for compliance reasons
1.7 Databox [toc=1.7 Databox]
⭐ Why did we choose this tool?
Databox is the fastest way to get a shared KPI scoreboard in front of a small team. Templates cover the common ecommerce metrics, and the mobile view actually gets opened. If your problem is visibility rather than analysis, it solves that cheaply.
❌ Where it runs out
Databox reports metrics, it does not investigate them. When revenue dips, it shows the dip and stops. You still have to find out why, which is the expensive part, and it is the reason operators end up comparing Databox alternatives.
📊 Core evaluation metrics
No-code surface: Prebuilt template dashboards and scorecards
Ecommerce connectors: Shopify, Google, Meta, Klaviyo, and more
Time to first answer: Under a day using templates
Proactive alerts: Goal and threshold alerts, no root-cause analysis
Founders who want numbers on a phone, not a laptop
1.8 Mixpanel [toc=1.8 Mixpanel]
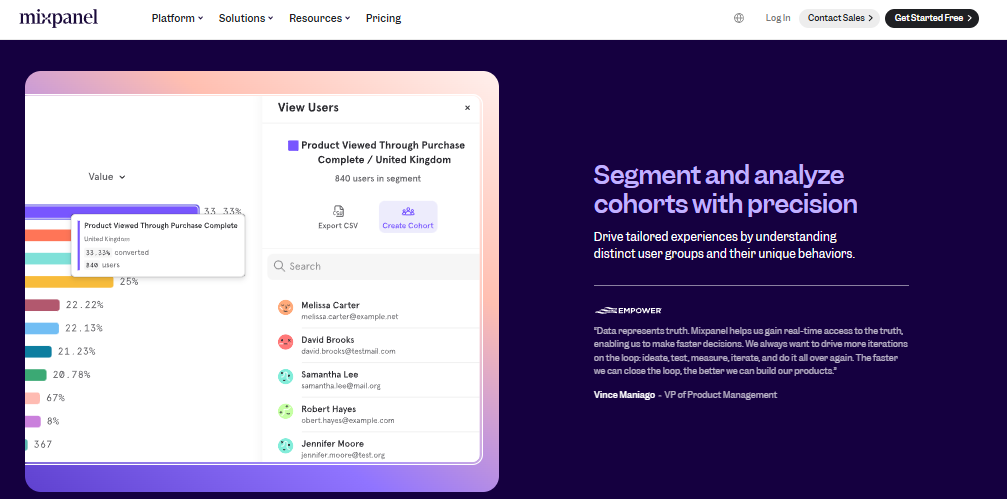
Mixpanel segments cohorts precisely, exposing onsite behaviour and checkout drop-off without writing any SQL
⭐ Why did we choose this tool?
Mixpanel answers a question the others cannot, which is what people actually do on your site. Its no-SQL report builder handles funnels, retention, and cohorts. If checkout abandonment is your bleed, this is the right lens.
⚠️ It is not a profit tool
Mixpanel is event-based, meaning it tracks user actions rather than financial records. It has no on-premise option, and all data sits on Mixpanel's servers. It will never tell you your contribution margin, which is the distinction we draw in contribution margin versus gross margin.
📊 Core evaluation metrics
No-code surface: Point-and-click funnel and cohort reports
Ecommerce connectors: Site and app event tracking, not cost data
Time to first answer: Days, after event tracking is implemented
Proactive alerts: Anomaly and threshold alerts on tracked events
Entry price: Free tier, then paid plans
✅ Solutions offered
Funnel analysis across checkout steps
Retention and cohort curves
Segmentation by user property
Session replay style behavioural views
Event-based alerting
❤️ Best for
Stores diagnosing onsite conversion and checkout drop-off
Julius AI is the cheapest way to test whether chat-based analysis suits you. Upload a CSV export, ask a question in plain English, and it runs the analysis in the background. For a one-off question, it is genuinely fast.
❌ Why it is not a system
There are no live connectors, so every analysis starts with a fresh export. Reproducibility is weak, which matters for anything recurring. Treat it as a calculator, not a source of truth, and read our note on evaluating AI data agents before you rely on one.
📊 Core evaluation metrics
No-code surface: Chat over uploaded files
Ecommerce connectors: None, manual file upload only
Time to first answer: Minutes, after you export the file
Ad-hoc questions that do not need to repeat monthly
😊 Reviews
"For data analysis, JuliusAI has been a game changer. I hate Python coding but this actually debugs it's own code to make the analysis run." — Commenter, r/dataanalysis Reddit Thread
"A significant limitation of Julius is its initial design for CSV files only, which is quite limiting." — Commenter, r/datascience Reddit Thread
1.10 Power BI [toc=1.10 Power BI]
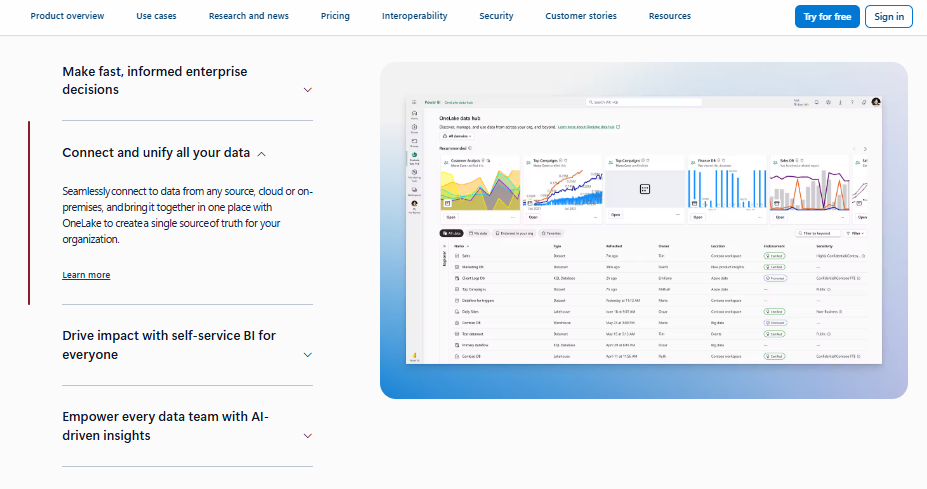
Power BI unifies sources in OneLake, giving finance teams governed self-service reporting at enterprise scale
⭐ Why did we choose this tool?
Power BI belongs here because your accountant probably already uses it. It handles large datasets, connects to Excel cleanly, and gives finance a governed report layer. For consolidated month-end reporting, it is hard to argue with.
⚠️ The AI-readiness question
Operators have started moving off it for pace reasons. One retail data lead put it plainly, saying Power BI has fallen behind on how AI ready it is. DAX, which is Power BI's formula language, also carries a steep learning curve, and that gap is why teams now shortlist AI-powered BI tools for ecommerce.
📊 Core evaluation metrics
No-code surface: Report canvas plus Copilot summaries
Ecommerce connectors: Microsoft-first, Shopify via third-party connectors
Time to first answer: Weeks, since models and measures come first
Proactive alerts: Data-driven alerts on published dashboards
Entry price: Per-user licence, then custom capacity pricing
✅ Solutions offered
Interactive dashboards with drill-through
DAX measures and Power Query transformations
Excel and Azure integration
Scheduled data refresh and governed sharing
Row-level security for multi-team access
❤️ Best for
Finance teams already inside Microsoft 365
Brands with an analyst who can build and own the model
Consolidated reporting across multiple entities or channels
😊 Reviews
"I like how Microsoft Power BI quickly turns complex data into interactive, easy-to-understand dashboards. Its strong integration with Microsoft tools and powerful features like DAX and Power Query make analysis fast and reliable." — Verified User, Power BI - G2 Verified Review
"It may allow you to create a multitude of custom calculations but it is not flexible and the query becomes cumbersome. The outcome of these cannot always be good for the dashboard performance or speed. Power BI has a limit on the size of data that it can ingest." — Verified User, Power BI - G2 Verified Review
1.11 Google Sheets with Gemini [toc=1.11 Google Sheets with Gemini]
⭐ Why did we choose this tool?
This one is on the list because it is where most stores actually work. Gemini in the sidebar writes formulas, suggests charts, and explains what a column is doing. It removes the formula-lookup tax without changing your process.
❌ Its ceiling is your export
Sheets only knows what you pasted into it. There is no continuous connection, no anomaly monitoring, and no memory of last quarter. One skincare operator described extracting data from her inventory system into an AI assistant after the built-in forecasting proved unreliable, which is exactly this workflow, and it is a common step before adopting automated ecommerce reporting.
📊 Core evaluation metrics
No-code surface: Spreadsheet with an AI sidebar
Ecommerce connectors: Manual exports or add-on connectors
Time to first answer: Minutes, once the export is pasted
Proactive alerts: None
Entry price: Included with Google Workspace
✅ Solutions offered
Formula generation from plain-English prompts
Chart and pivot suggestions
Column explanations and data cleanup help
Familiar collaboration and commenting
Zero new tools to onboard
❤️ Best for
Stores under roughly $1M still running on exports
Quick sanity checks before a bigger decision
Teams with a spreadsheet habit they do not want to break
Luca AI ranks first in this list for one structural reason, which is reach. Connecting commerce, ad, accounting, 3PL, and support data in one normalized layer is what lets a plain-English question about SKU profitability actually return an answer. Nine of the eleven tools above cannot see the cost side at all. That is the gap we built against, and it is the one worth testing on your own numbers.
Q2. How did we score and rank these 11 platforms? [toc=2. Scoring Methodology]
Every platform here was scored on five weighted criteria: Ecommerce Data Coverage at 25%, Analytical Depth and Proactivity at 25%, Setup and Time-to-First-Answer at 20%, Pricing Transparency at 15%, and Verified User Reviews at 15%. Scores convert to stars in five bands, from one star at the bottom to five at the top. Luca AI is scored on the same sheet as every competitor, and it publishes this article.
⭐ Why these five criteria, not feature counts
Feature lists lie. Two tools can both claim dashboards, alerts, and AI, then behave completely differently on a Tuesday when your ROAS drops. ROAS means return on ad spend, and it is usually the first number an operator checks.
Data coverage and analytical depth carry half the weight for one reason. A tool that cannot see your cost lines cannot answer a profit question, no matter how many charts it ships, which is the gap we unpack in our breakdown of ecommerce profit margins.
📊 How each criterion was measured
Scoring came from three inputs, kept separate so you can argue with any of them.
Scoring Criteria and Weights for No-Code Analytics Platforms
Criterion
Weight
How it was measured
Ecommerce Data Coverage
25%
Native connectors reaching commerce, ads, accounting, 3PL, and support
Analytical Depth and Proactivity
25%
Root cause, prediction, and unprompted anomaly alerts, tested hands-on
Setup and Time-to-First-Answer
20%
Days until a real business question got a real answer
Pricing Transparency
15%
Public pricing, escalators, and contract terms on vendor pages
Verified User Reviews
15%
G2, Reddit, and app store reviews, positive and negative
💸 Why pricing transparency is scored at all
Operators are tired of pricing that moves without warning. Triple Whale's plans are keyed to trailing GMV, so growth alone can move you into a higher band, and its terms include a perpetual data licence clause. That is not a scandal, but it belongs in a scoring sheet, and it is one reason brands start reviewing Triple Whale alternatives.
😊 What the reviews contributed
Reviews carried 15% because they surface the thing vendors never publish, which is the recurring complaint. The same friction shows up again and again across products.
"Triple Whale is very user-friendly and easy to navigate to find the data you need across multiple channels. Some data we still notice discrepancies between platforms, for example, tracking ads, and differences in the reported metrics like revenue." — Verified User, Triple Whale - G2 Verified Review
"It may allow you to create a multitude of custom calculations but it is not flexible and the query becomes cumbersome. Power BI has a limit on the size of data that it can ingest." — Verified User, Power BI - G2 Verified Review
⚠️ The bias disclosure, stated plainly
Luca AI publishes this list and sits at the top of it, so discount that by whatever amount feels fair to you. My read is that the ranking survives on connector reach, since nine of the eleven tools cannot see cost data at all. I could be wrong about the weightings, and if you weight setup speed higher, Databox and Looker Studio climb.
⏰ How stars were assigned
Five bands, evenly split, no rounding tricks. Anything scoring in the top band earns five stars, and the bottom band earns one. Nothing about a vendor relationship changed a band.
Luca AI earns five stars on this sheet because it closes the loop from question to root cause to recommendation without a dashboard build step. That claim is testable on your own data in a week, which is the only reason it is worth making. You can see the reasoning approach in how Luca thinks.
Q3. What counts as no-code analytics, and who actually builds the data model? [toc=3. What No-Code Really Means]
A no-code analytics platform lets non-technical users connect data sources, explore metrics, and get answers without SQL, Python, or formulas. Three surfaces exist: drag-and-drop dashboard builders, natural-language chat agents, and spreadsheet-native grids over a warehouse. Only chat and upload tools are no-code end to end. Visual builders still need someone to connect sources and define a semantic layer.
✅ The three surfaces, named
Dashboard builders give you a canvas. Looker Studio and Power BI live here, and they expect the data to already make sense.
Chat agents let you type a question the way you would ask a colleague. ThoughtSpot does this over modeled data, while Julius AI does it over a file you upload, and both sit inside the broader shift toward generative BI tools.
📊 The third surface most lists ignore
Sheet-native tools put a spreadsheet grid on top of a warehouse. Sigma leads here, and G2's head-to-head shows it winning on exactly that spreadsheet-like interface. Your buying plan already lives in a spreadsheet, so this is not a fallback; it is a real answer.
⚠️ The test nobody applies: who builds the model
A semantic layer is the map that tells a tool what "revenue" means. Somebody has to draw it. Independent testing of this category found that visual builders remove SQL from the analyst's chair, then hand the modeling job to a BI engineer instead.
If you do not employ a BI engineer, that work lands on you at 11pm. That is the hidden cost in the phrase "no-code," and it is the same cost buried inside most reverse ETL tools for ecommerce.
⏰ Where each surface actually lands
Who Builds the Data Model Behind Each No-Code Surface
Surface
Who builds the model
Honest verdict
Dashboard builder
You or a BI engineer
No-code at the front, code at the back
Chat over modeled data
A data team, first
Codeless to use, not to set up
Chat over uploaded files
Nobody, you export
Genuinely no-code, not repeatable
Sheet-native grid
Warehouse team
Codeless surface, warehouse prerequisite
Chat over normalized connectors
The platform
No-code end to end
Luca AI sits in the last row, because normalization happens on ingestion rather than in a modeling project you run afterwards.
❌ Why ecommerce raises the bar
Retail data is not standard, and that is the real blocker. One retail data lead described the mess as basic things like retail week definitions, 5-4-4 versus 4-4-5 calendars, being non-standard across every brand he worked with.
Then there is order versus demand revenue. Shopify counts one way, your accounting system counts another, and your ad platform counts a third. A dashboard cannot fix that. It just displays whichever version you pointed it at, which is why ecommerce data management decides the quality of every answer downstream.
💸 The nerd tax, in plain terms
Shopify gives you ShopifyQL, which is its own query language, for direct data questions. One well-known ecommerce educator skipped it live on camera, saying he was not fancy enough with ShopifyQL and it was too nerdy for the day's work. That is the honest state of "self-service" for most operators.
I have watched founders lose an entire quarter to this step. They buy a builder, discover the modeling gap, then quietly go back to exports.
Luca AI removes the modeling step instead of relocating it, since data is standardized as it arrives from each connected source. Plug in, ask, act. Whether that holds up depends on your stack, so test it against one messy source before you trust it with all of them.
Q4. Which platform fits your store stage, team, and existing data stack? [toc=4. Fit by Store Stage]
Under $1M in revenue, stay on Shopify Analytics plus Looker Studio. From $1M to $10M, a chat interface over connected sources beats any dashboard build, because your questions change weekly and nobody on the team writes SQL. Above $10M with a data hire, add a governed builder or a sheet-native layer. Shopify removed Compare-to-Benchmarks on 19 May 2026.
💰 Under $1M: do not buy anything yet
Your data volume is too thin to reason against. Shopify's native reports plus a free Looker Studio dashboard will cover traffic, spend, and revenue, as we lay out in our Shopify Analytics guide.
Spend the money on inventory instead. I have never seen a sub-$1M store fix a margin problem with software.
⚠️ The exception worth noting
If you are already losing a full day a week to exports, that is a real cost. Value your own hour honestly, then decide.
⏰ $1M to $10M: chat beats dashboards here
This is where the questions change faster than any dashboard can keep up. You ask about returns one week and vendor performance the next.
One operator described the grind exactly right, saying you upload profit and loss statements, cash flow statements, and inventory reports just to get an overview, and otherwise you sit in the back end of each program working it out yourself.
Luca AI is built for this band, connecting commerce, ad, accounting, 3PL, and support data into one queryable layer. That is the honest fit boundary, and stores below roughly $1M do not have enough history for it to be useful.
❌ Above $10M: add governance, keep the chat
At this stage you probably have an analyst. Sigma or Power BI gives finance a governed layer, meaning permissions and shared metric definitions, which is the classic ecommerce business intelligence setup.
Keep a conversational layer alongside it. Your merchandiser should not file a ticket to learn which vendor underperformed last season.
📊 What changed inside Shopify in May 2026
Shopify Analytics Changes in May 2026 and What They Cost Merchants
Date
Change
What it costs you
9 May 2026
Flow gained ShopifyQL analytics reads
Automation improved, still needs query skill
19 May 2026
Compare-to-Benchmarks removed from Analytics
Free industry comparison gone
20 May 2026
Cumulative metrics view added
Partial replacement, not a benchmark
Ongoing
ShopifyQL Notebooks stay Plus-only
Query layer gated at $2,300+ per month
For a $3M store, that combination removed the free comparison layer and priced the query layer out of reach. Shopify's own guidance still points merchants toward dashboards, custom reports, and benchmark comparisons as the core workflow, a workflow we map in detail in our Shopify analytics dashboard explainer.
😊 What operators say about the cheap path
Looker Studio is the default free answer, and it works until it does not. The complaints cluster around speed and blending, which is combining two sources into one report.
"Also, in general, I've found using looker studios blending features to be a nightmare. Plenty of limitations and makes the performance horrible." — Commenter, r/GoogleDataStudio Reddit Thread
"Very useful for top down view for a very fast reporting. However, some stats are not so accurate in pulling in data; they do not tally with shopify." — Verified User, Triple Whale - G2 Verified Review
✅ The rule of thumb
Match the surface to your bottleneck, not your revenue. If your bottleneck is visibility, buy a dashboard. If it is understanding why a number moved, buy something that can reason across sources, which is the job of an AI data analyst for ecommerce.
Luca AI fits SMB and mid-market operators with enough trading history to reason against, and it does not fit enterprises already running their own data team. That boundary matters more than the feature list.
Q5. Can a no-code platform answer the questions that actually move money? [toc=5. Questions That Move Money]
Most no-code tools stop at gross margin, which only tells you what the product cost to make. True contribution margin needs shipping, fees, returns, discounts, ad spend, and support cost allocated per unit, so only platforms connected to accounting and helpdesk data can produce it. Luca AI performs root-cause analysis and prediction across those connected sources, which is why the cost side has to be in the pipe first.
⚠️ The 72% product that was really 8%
A founder I spoke with had a hero product showing a 72% gross margin. When the costs were counted line by line, actual contribution margin came in at 8%. She had scaled that product for two years.
The data was sitting in her systems the whole time. Nobody had connected the pieces, so the tools kept showing the flattering number, a pattern we see constantly in customer profitability analysis.
💸 The eight costs between invoice and profit
Gross margin only covers making the thing. It says nothing about selling it. Run this list per SKU, which means per individual product variant.
Landed cost, including duty and freight
Payment processing fees
Outbound shipping, actual not charged
Returns and refund handling
Discounts and promotional codes
Allocated ad spend at the product level
Pick, pack, and 3PL storage
Customer support time per unit
📊 The support cost nobody allocates
One operator traced a knife set to roughly $13,000 a year in customer service costs. Spread across units, that came to $1.45 each. That single line flipped the product from profitable to marginal.
Ask Luca AI to allocate support ticket volume by product, and the answer arrives with the reasoning attached rather than as a chart to interpret. The underlying method is the same one behind tracking ecommerce unit economics.
✅ Which tools can do which job
Which No-Code Surface Can Answer Which Money Question
Job
Dashboard builders
Chat over files
Connected chat
Fully-burdened SKU margin
No, missing cost sources
Only if you export everything
Yes, if accounting is connected
Demand forecasting
Manual, no memory
One-off, not repeatable
Yes, from trading history
Root-cause analysis
No, you do it
Partial
Yes, names influencing components
Scenario simulation
No
Limited
Yes
⏰ Judge the answer against something
An answer means nothing without a reference point. Median Shopify conversion rate sat at 2.07% in 2026, with average order value at $77.74 and add-to-cart at 5.95%, measured across 21 stores and $417M in revenue. Mobile carried 86% of traffic but converted at 2.29% versus 3.74% on desktop.
Wider context matters too. Ecommerce net profit fell from 17.7% to 10.6% over a decade across 300 stores in the Ecom Fuel Trends Report. That is why margin questions beat traffic questions now, and why the KPIs worth tracking have shifted.
⭐ Your Monday checklist
Five things, in order, before you buy anything.
Pick your top five SKUs by revenue
Build the eight-cost table for each one
Compare true contribution margin to gross margin
Kill or reprice anything under 15%
Only then ask which tool automates this monthly
I will hedge one claim here. Luca AI's deployments point to cost-source connection being the single biggest predictor of whether an operator acts on an answer, though the sample is still small enough that I might be reading it too strongly.
Luca AI pushes these findings to Slack or email on a schedule, so the margin question gets answered without anyone opening a tab. Charts are a courtesy. The recommendation is the product, which is the whole premise of automated ecommerce reporting.
Q6. How do you verify the answers and get to first value without a data project? [toc=6. Verification and Rollout]
Reconcile every no-code tool against Shopify's own revenue monthly, and against a holdout test quarterly. Common Thread Collective's 2026 study across 14 brands and $180M of ad spend found modeled ROAS correlated 0.84 with GeoLift holdouts for one platform versus 0.71 for another. A gap above 15% between tool and platform means recalibrate before acting.
❌ A fluent answer can still be wrong
Chat interfaces sound certain. That confidence is a writing style, not a data guarantee.
Modeled numbers inherit the error of whatever fed them. Independent testing found Triple Whale's reported-versus-blended ROAS gap still running 25% to 40% on broad Advantage+ campaigns, which is the exact problem behind declining platform ROAS versus true profitability.
😊 Operators notice this first
The complaints are consistent, and they are about tallying, not features.
"Very useful for top down view for a very fast reporting. However, some stats are not so accurate in pulling in data; they do not tally with shopify." — Verified User, Triple Whale - G2 Verified Review
"The free version is not reliable, Google even says though themselves in their privacy policy. 'Sessions' are a vague statistic that do not help define the quality/quantity of your web traffic." — Verified User in Marketing and Advertising, Google Analytics - G2 Verified Review
✅ The three-step reconciliation protocol
Run this monthly. It takes under an hour once set up.
Compare tool revenue to Shopify revenue for the same window
Flag any variance above 15% and stop acting on that metric
Run a geo holdout test quarterly to check modeled channel numbers
Luca AI is an AI layer over your data warehouse, not an attribution pixel, so its numbers deserve the same reconciliation you give every other tool here.
⚠️ The three setup failures
Implementations stall for boring reasons, not technical ones.
Non-standard schemas, like retail week and demand-versus-invoice revenue definitions
Connectors that sync orders but never sync costs, a failure mode covered in our guide to ecommerce API integrations
Nobody owning the metric definitions, so two people report two numbers
💸 The data-security rule
Never paste transactional or customer data into a free public AI tier. One retail CEO banned her marketing team from free tools for exactly this reason, since sales figures and customer activity end up training somebody else's model.
Ask Luca AI to standardize definitions at ingestion instead of cleaning data inside reports. That order matters, because a clean report over dirty inputs is just a confident wrong answer.
⏰ A 30-day rollout with owners
30-Day No-Code Analytics Rollout Plan With Named Owners
Window
Action
Owner
Day 1
Connect Shopify, Meta, Google, and accounting
Founder
Day 2 to 3
Agree definitions for eight core metrics
Founder plus finance
Day 7
First reconciliation against Shopify revenue
Finance
Day 14
Set anomaly alerts on ROAS, CAC, and inventory
Growth lead
Day 30
Run one real decision through the tool, then audit it
Founder
⭐ Keep a human in the QA seat
One retail data lead pointed to a premium bike brand publishing a product image with the rear derailleur mounted on the front wheel. A $20,000 bike, shipped with an obvious error. His rule was simple, which is do not let the AI be the QA.
Luca AI standardizes data as it arrives, which removes the cleanup phase but not your judgment. Treat first value at day 30, not day 1, and audit the first decision you make on it. Our note on evaluating AI data agents covers what to audit first.
Q7. What do these platforms really cost, and when do they pay back? [toc=7. Real Cost and Payback]
Real 2026 entry prices run from free (Looker Studio, Metabase open source, Triple Whale's Founders Dash) to $219 per month for Triple Whale Foundation and $749 for Automate, both escalating with trailing GMV bands. At a 10.6% net margin, a $250 per month tool needs roughly $28,000 in extra annual revenue just to break even. Model that number before any trial.
💰 The observed prices, not the list prices
Observed 2026 Pricing and Hidden Escalators by Platform
Platform
Real entry price
The escalator
Looker Studio
Free
Your time on blending
Metabase
Free self-hosted, Cloud from $10 per user monthly
Hosting and upgrades
Triple Whale
Free, then $219 monthly
Trailing GMV bands
Triple Whale Automate
$749 monthly, $7,490 yearly
Add-ons at $19 and $79
Luca AI
€299 monthly
Flat tiers, no GMV escalator
⚠️ The escalator trap
GMV-banded pricing means growth alone raises your bill. Triple Whale keys pricing to trailing 365-day Shopify revenue, with automatic tier moves and a perpetual data licence in its terms.
That is not hidden, but nobody models it. A good quarter can quietly cost you an extra tier, which is worth checking against flat-tier pricing before you commit.
😊 What operators actually say about pricing
"They also consistently removed data features and kept the price the same. Worst of all, I've been trying to cancel my account for the past 3 months but their customer support is unresponsive and I keep getting charged!!" — Verified User, Supermetrics - G2 Verified Review
"If you have under fifty employees, this should be just fine. As you grow, you will need to stop using the free version." — Gitai B., Marketing, Web Analytics, and Testing Lead, Google Analytics - G2 Verified Review
One founder put the feeling more bluntly, saying he hates software companies most of the time because of how they charge you and sign you into contracts. If that is your read too, our list of Supermetrics alternatives for ecommerce starts from the same place.
📊 The payback math at $3M revenue
Do this arithmetic before the demo, not after.
Tool cost: $250 per month, so $3,000 per year
Net margin: 10.6% across 300 stores in 2026
Break-even: about $28,000 in extra annual revenue
On a $77.74 average order value, that is roughly 360 extra orders
Or one killed SKU that was quietly losing $30,000 a year
Luca AI is priced against a junior data analyst's cost rather than as another dashboard line item, which is the comparison that matters when tool spend per $1M of revenue compressed 22% in 2026.
❌ Four terms to refuse
Multi-year lock-in with no exit for non-performance
Automatic tier escalation without written notice
Perpetual data licences over your customer data
Add-ons priced separately for features shown in the demo
⏰ The frame that keeps this honest
Software should not be a headcount argument. One retail CEO told her team that AI would never replace any of them, but it should take their work to 80 or 90% completion. That is the right bar for a no-code tool too, and it is how we think about AI actually helping you run your ecommerce business.
Luca AI's read is that the next repricing wave in this category hits GMV-banded vendors first, because operators are consolidating rather than adding. I could be early on that. What I am watching is whether a $3M store in 2027 pays for three tools or one, and I would genuinely like to hear which way your stack is moving, so tell us where yours stands.
FAQ's
What is a no-code analytics platform, and how is it different from traditional BI?
A no-code analytics platform lets non-technical users connect data sources, explore metrics, and get answers without writing SQL, Python, or spreadsheet formulas. Traditional business intelligence assumed a trained analyst sat between the question and the answer. No-code removes that seat, at least in theory.
Three surfaces sit inside the category, and they behave very differently:
Dashboard builders such as Looker Studio and Power BI, which give you a canvas and expect modeled data
Chat interfaces, where you type a question the way you would ask a colleague
Sheet-native grids that put a spreadsheet over a warehouse, keeping your planning where it already lives
The practical difference from legacy BI is time to first answer. A builder project can run weeks because somebody has to define what revenue means before a chart renders. Luca AI normalizes and standardizes data on ingestion, so the modeling step is removed rather than relocated onto your team.
For ecommerce specifically, the bar is higher than generic BI. Order versus demand revenue, retail week calendars, and cost definitions are non-standard across Shopify, your ad platforms, and your accounting system. Our guide to ecommerce business intelligence covers why that mismatch breaks most dashboard rollouts.
Is no-code analytics really no code, or does someone still have to build the data model?
Partly. Chat-over-file tools and upload-based analyzers are genuinely no-code end to end, because you export a CSV and ask a question. Visual builders are not. They remove SQL from the analyst's chair, then hand the modeling work to a BI engineer instead.
The hidden job is the semantic layer, which is the map that tells a tool what revenue, margin, and customer actually mean. Somebody has to draw it. Here is where each surface really lands:
Dashboard builder: you or a BI engineer build the model
Chat over modeled data: a data team builds it first, then chat is easy
Chat over uploaded files: nobody builds it, but nothing is repeatable
Sheet-native grid: a warehouse team is the prerequisite
Chat over normalized connectors: the platform handles it
Luca AI sits in that last category, standardizing definitions as data arrives from each connected source rather than after the fact. That is the difference between plugging in on Monday and starting a quarter-long cleanup project.
If you are weighing tools that promise self-service, read our breakdown of self-service BI tools before you commit budget.
Can a no-code analytics platform calculate true contribution margin per SKU?
Only if it is connected to your accounting and support data. Most tools stop at gross margin, which tells you what a product cost to make and nothing about what it costs to sell.
True contribution margin requires eight cost lines allocated per unit:
Landed cost, including duty and freight
Payment processing fees
Outbound shipping, actual rather than charged
Returns and refund handling
Discounts and promotional codes
Ad spend allocated at product level
Pick, pack, and 3PL storage
Customer support time per unit
That last line is the one operators skip. One brand traced a single product to roughly $13,000 a year in support costs, which worked out at $1.45 per unit and flipped the item from profitable to marginal. Another founder discovered a product showing 72% gross margin was delivering 8% contribution margin after every cost was counted.
Luca AI reaches commerce, ad, accounting, 3PL, and support data in one normalized layer, which is what makes this calculation answerable in plain English instead of a spreadsheet weekend. Dashboard builders and product-analytics tools cannot do it, because the cost sources are not connected. Our explainer on contribution margin versus gross margin walks through the full template.
How do I know the answer a no-code AI analytics tool gives me is accurate?
Treat it as a measurement system that needs calibration, not an oracle. A fluent answer can still be wrong, because a chat layer inherits every error in the data feeding it.
Run this reconciliation protocol monthly, and it takes under an hour once set up:
Compare tool revenue against Shopify revenue for the same window
Flag any variance above 15% and stop acting on that metric until it is fixed
Run a geo holdout test quarterly to sanity-check modeled channel numbers
The gaps are real. Independent testing put reported-versus-blended ROAS differences at 25% to 40% on broad Advantage+ campaigns, and a 2026 benchmarking study across 14 brands found modeled ROAS correlating 0.84 with holdout tests for one platform against 0.71 for another.
Luca AI is an AI layer over your data warehouse rather than an attribution pixel, so its numbers deserve exactly the same reconciliation you give every other tool in your stack. Keep a human in the QA seat, especially on the first few decisions you make from a new system. Our note on evaluating AI data agents lists what to audit first.
What does a no-code analytics platform cost, and when does it pay for itself?
Entry prices range from free to several hundred dollars a month, but the sticker price is rarely the real cost. Looker Studio and open-source Metabase are free, Metabase Cloud starts around $10 per user monthly, and Triple Whale runs free to $219 monthly at Foundation and $749 at Automate, both scaling with trailing GMV bands.
Three cost traps matter more than the headline number:
GMV escalators, where growth alone moves you into a higher tier without a new contract
Seat, row, and file limits that quietly force an upgrade mid-quarter
Contract terms, including multi-year lock-ins and perpetual data licences
Then do the payback math before the demo. At a 10.6% net margin, a $250 per month tool costs $3,000 a year and needs roughly $28,000 in extra annual revenue to break even. On a $77.74 average order value, that is about 360 additional orders, or one loss-making SKU you finally kill.
Luca AI prices in flat tiers rather than GMV bands, and is scoped against the cost of a junior data analyst instead of another dashboard subscription. Current tiers are listed on our pricing page.
Enjoyed the read? Join our team for a quick 15-minute chat — no pitch, just a real conversation on how we’re rethinking Ecommerce with AI - Luca
Loading Schedule...
Your AI Co-Founder is here.
Here’s why:
Shopify, Meta, Xero - one brain.
"Should I scale?" Answered with real data.
Growth capital. No applications. One click.
Thank you! Your submission has been received! Please book a time slot for the Meeting
Oops! Something went wrong while submitting the form.