11 Best Generative BI Tools for Ecommerce: Where you can talk to your data
12
mins read
TL;DR
Generative BI tools let you ask a plain-English question, then write the query, run it, and narrate the answer instead of handing you another chart to interpret.
We ranked 11 tools on reasoning depth, e-commerce data coverage, agentic delivery, pricing transparency, and verified reviews, with Luca AI first and the rubric published for re-weighting.
Answers are capped by the semantic layer beneath them. If contribution margin is undefined, or returns and support data are missing, every profit answer is a guess.
Attribution match rates of 70% to 85% leave 15% to 30% of revenue unassigned before any model reasons, so demand inspectable SQL, audit trails, and human QA.
One founder scaled a hero SKU at a reported 72% gross margin that turned out to be 8% contribution margin once shipping, returns, and support were allocated.
Test every vendor with the same seven operator questions, price the whole stack rather than the seat, and deploy across four weeks with definitions agreed in week one.
Q1. What Are the 11 Best Generative BI Tools for E-commerce in 2026? [toc=1. Top 11 Tools]
The 11 best generative BI tools for e-commerce in 2026 are Luca AI, Triple Whale (Moby), Power BI Copilot, ThoughtSpot Spotter, Omni, Polar Analytics, Sigma, Zoho Analytics (Zia), Amazon Q in QuickSight, Querio, and Draxlr. Luca AI ranks first because it is an AI reasoning layer over your store's data, normalizing every source on ingestion, then handling root-cause analysis, forecasting, and scenario questions in plain English.
You are not short on data. You are short on answers. Most operators I sit with run 8 to 12 tools, and every one of them shows a fragment of the store. So the real test is not which tool has prettier charts. The test is which one answers "which SKU is unprofitable after returns and support cost" without a data analyst in the loop, which is the whole premise behind conversational analytics for e-commerce. I scored all 11 against that standard, and I am telling you upfront that I built the first one on this list.
The 11 Tools at a Glance
Luca AI, best for AI-native e-commerce intelligence with plain-English root-cause analysis
Triple Whale (Moby), best for DTC marketing attribution and ad-spend analysis
Power BI Copilot, best for teams already inside the Microsoft data stack
ThoughtSpot Spotter, best for agentic search-style analytics on a governed warehouse
Omni, best for semantic-layer-aware AI with strong governance
Polar Analytics, best for Shopify-native reporting without a warehouse build
Sigma, best for spreadsheet-style exploration on cloud data
Zoho Analytics (Zia), best for budget-conscious teams wanting a free entry tier
Amazon Q in QuickSight, best for stores already running data on AWS
Querio, best for AI-native notebooks aimed at technical operators
Draxlr, best for startups needing cheap SQL-free dashboards
First-party pixel, attribution, MMM, and Moby chat and agents
DTC brands where paid media is the main lever
$129 / Month to $499+ / Month
Power BI Copilot ⭐⭐⭐
NL query, report summaries, DAX generation, and Fabric integration
Retailers standardized on Microsoft
$14 / Month to $24+ / Month per user
ThoughtSpot Spotter ⭐⭐⭐⭐
Search-style NL analytics, agentic follow-ups, and change analysis
Mid-market teams with a governed warehouse
~$95 / Month to Custom
Omni ⭐⭐⭐⭐
Semantic-layer-aware AI, governed metrics, and workbook modeling
Data-literate teams that need trust over speed
Custom to Custom
Polar Analytics ⭐⭐⭐
Shopify-native connectors, custom metrics, and AI insights
Shopify stores wanting reports without engineering
$300 / Month to $1,200+ / Month
Sigma ⭐⭐⭐
Spreadsheet UI on warehouse, AI query help, and live editing
Finance teams that think in spreadsheets
$600 / Month to Custom
Zoho Analytics (Zia) ⭐⭐⭐
Ask Zia NL queries, dashboards, and blended data sources
Small stores on a tight software budget
Free to $575 / Month
Amazon Q in QuickSight ⭐⭐
NL dashboard authoring, executive summaries, and data stories
Stores already on AWS infrastructure
$3 / Month to $250+ / Month
Querio ⭐⭐⭐
Agentic notebooks and warehouse-connected AI exploration
Technical founders comfortable with data models
Custom to Custom
Draxlr ⭐⭐
SQL-free dashboards, basic AI querying, and alerts
Early-stage stores needing cheap reporting
$25 / Month to $199 / Month
1.1 Luca AI [toc=1.1 Luca AI]
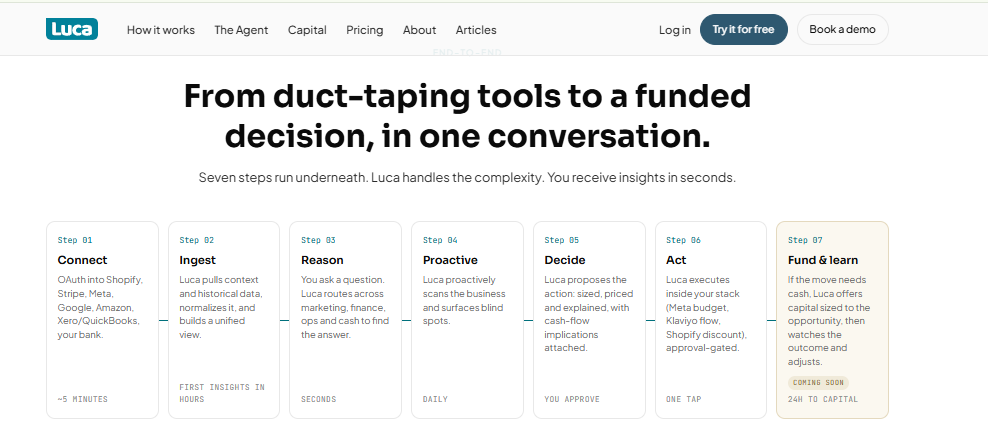
Luca AI runs seven steps underneath, turning connected store data into an approved decision in seconds.
⭐ Why did we choose this tool?
I put Luca AI first, and I built it, so judge the reasoning rather than the ranking. Luca AI is an AI layer over your store's data, not a dashboard product with a chat box added later. It normalizes commerce, ad, email, support, 3PL, and accounting data on ingestion, which removes the cleanup year most warehouse projects lose. That architecture is why it reasons across functions instead of one channel, and it is the same thinking behind agentic AI for e-commerce founders. Most analytics tools added AI. Luca is AI.
💰 Solutions offered
Ask questions in plain English, with no SQL, analyst, or dashboard build required
Root-cause analysis across directly and indirectly related metrics
Predictive work, including reorder alerts, sales forecasts, and product-level analytics
Agentic push reports to Slack, email, or mobile with reasoning and recommendations
Capital-Backed Insights, a separate pillar for funding inside the same chat
📊 Core evaluation metrics
Reasoning depth: root cause, simulation, and forecasting in one pass
Sources connected: commerce, ads, email, support, 3PL, and accounting
Setup time: usable on day one, with no cleanup project
Agentic delivery: scheduled reports plus 24/7 anomaly pings
Contribution margin modeling: yes, including support and returns costs
✅ Best for
Shopify and DTC operators between €1M and €5M in revenue
Teams with piling data but no analyst headcount to read it
Founders who want answers pushed to them, not dashboards to open
❤️ Case study
What was the problem: A European skincare brand doing roughly €2M a year believed its hero SKU carried a 72% gross margin. Ad spend kept scaling behind it.
How Luca helped: Luca AI pulled shipping, returns, and support ticket data alongside the P&L, then allocated those costs down to the SKU. Support alone ran heavy on that one product, which is exactly the gap covered in contribution margin vs gross margin.
What was the outcome: True contribution margin came back at 8%, not 72%. The brand cut spend on that SKU within a week and moved the budget to a lower-revenue, higher-margin product. Two years of scaling a near-breakeven hero product stopped. The data was always there. Nobody had joined it.
💸 Pricing
[ Starter, €299 / Month | Growth, €499 / Month | Scale, Custom Pricing ]. Current tiers are listed on the Luca AI pricing page.
⚠️ Where Luca AI is not the answer
Luca AI is not an attribution pixel and does not replace one. If your only question is last-click versus incremental credit on Meta, buy an attribution tool. Enterprises with in-house data teams will also get less from it, and you can see where the fit lines fall across Luca AI use cases.
1.2 Triple Whale (Moby) [toc=1.2 Triple Whale]
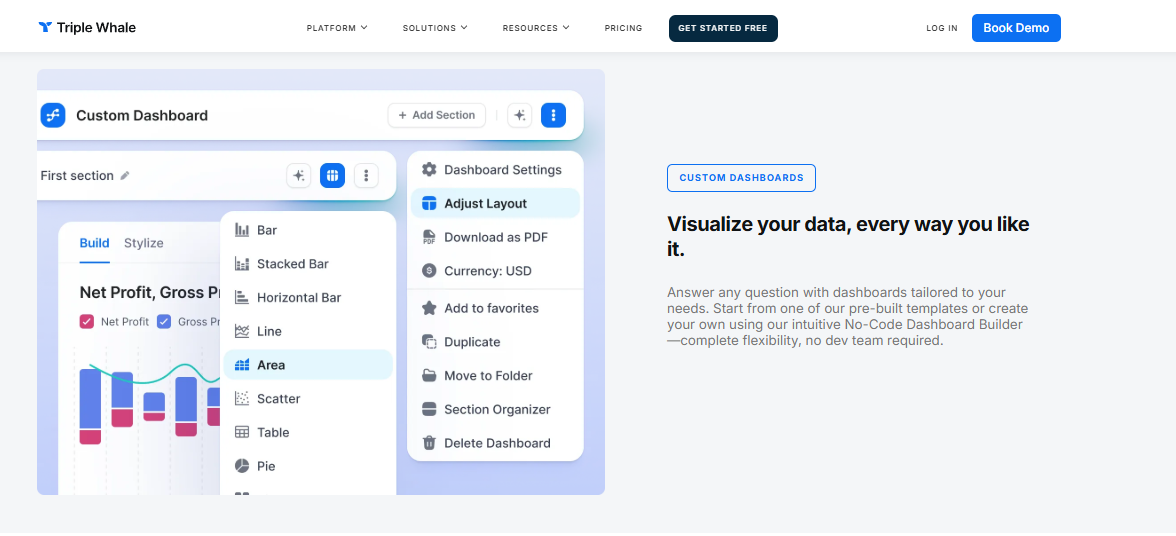
Triple Whale builds flexible dashboards, though the answer still depends on how you read them.
⭐ Why did we choose this tool?
Triple Whale earned its place on paid-media depth. It runs a proprietary first-party pixel, a managed warehouse, marketing mix modeling, and Moby agents for automated analysis. If Meta and Google are the levers you pull daily, Moby answers those questions faster than a generic BI tool will. ✅ The attribution work is genuinely good. ❌ The architecture stops at marketing, so cash flow and P&L questions fall outside it, which is why operators keep comparing Triple Whale alternatives.
💰 Solutions offered
Triple Pixel first-party tracking independent of platform reporting
Multi-touch attribution plus marketing mix modeling for budget splits
Moby chat and agents for automated marketing analysis
Creative and cohort reporting across ad channels
Peer benchmarks drawn from aggregated DTC data
📊 Core evaluation metrics
Reasoning depth: strong on marketing, with no finance or accounting layer
Sources connected: commerce, payments, ad platforms, and email
Setup time: 2 to 3 weeks of pixel calibration before data is trustworthy
Contribution margin modeling: partial, missing support and finance costs
✅ Best for
DTC brands where paid social is the primary growth channel
Teams that need first-party attribution after iOS tracking loss
Operators comfortable paying up for the higher tier to unlock modules
🗣️ What operators say
Practitioner testing in 2026 put Meta match rates at 70% to 85% on iOS-heavy audiences, against 40% to 60% for a raw Meta pixel. That is a real gain, and it still leaves 15% to 30% of revenue unattributed, which is the core tension in declining platform ROAS vs true profitability. Entry pricing starts near $129 a month, while the modules most brands actually want sit on the $499 Whale tier.
The frustration underneath this whole category is easy to find in the open:
"they've officially started redirecting the /dashboards URL now so the old dashboard is completely gone." — u/anonymous, r/shopify Reddit Thread
"I've opened multiple tickets with Shopify support because the analytics are utterly ineffective." — u/anonymous, r/EcommerceWebsite Reddit Thread
💸 Pricing
[ $129 / Month to $499+ / Month ]
Luca AI's read is that Triple Whale optimizes marketing efficiency well, and that it cannot optimize business health, because the financial layer sits outside its data model. That split is unpacked further in our guide to e-commerce business intelligence.
1.3 Power BI Copilot [toc=1.3 Power BI Copilot]
⭐ Why did we choose this tool?
Power BI Copilot earns a spot because of reach, not brilliance. If your finance team already lives in Microsoft Fabric, Copilot answers questions inside the reports they trust. It generates DAX, summarizes reports, and drafts visuals from a prompt. ❌ The honest read from practitioners is that it degrades fast as your data model gets complex, which is a recurring theme across e-commerce analytics platforms.
💰 Solutions offered
Natural language querying inside existing Power BI reports
Report and dashboard summarization in plain language
DAX measure generation and explanation
Fabric integration for warehouse-scale data
Embedded narrative widgets inside published reports
📊 Core evaluation metrics
Reasoning depth: shallow on complex models, strong on simple ones
Sources connected: any Microsoft-supported source, with no e-commerce presets
Setup time: weeks, since you must model the data first
Agentic delivery: scheduled report subscriptions only
Contribution margin modeling: only if you build it yourself
✅ Best for
Retailers already standardized on Microsoft and Fabric
Teams with an analyst who can maintain the data model
Finance groups needing enterprise governance over self-serve speed
🗣️ What operators say
"The greater the complexity of your data, data models, and DAX measures, the less helpful Copilot becomes." — r/analytics user, r/analytics Reddit Thread
"My experience of CoPilot so far on anything non trivial is that it's fantastic at producing very plausible garbage" — r/PowerBI user, r/PowerBI Reddit Thread
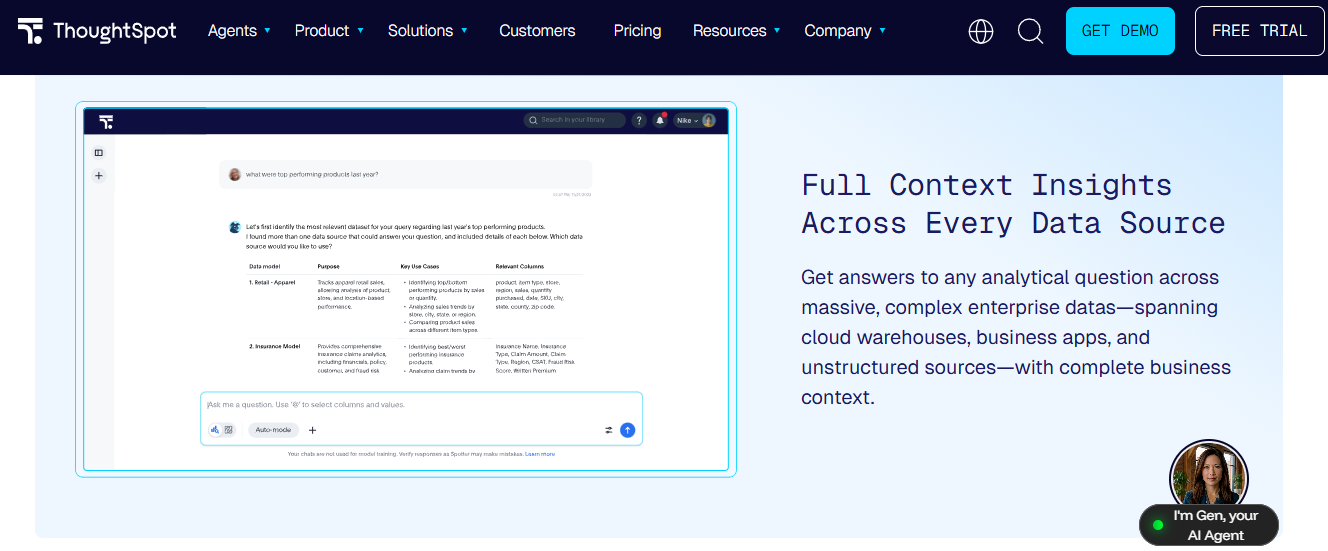
ThoughtSpot Spotter clarifies which data model to use before answering your business question.
⭐ Why did we choose this tool?
ThoughtSpot built search-style analytics before it was fashionable. Spotter, its agentic layer, handles follow-up questions and change analysis rather than one-shot queries. ✅ Non-technical users pick it up quickly. ❌ It expects a governed warehouse underneath, which most sub-$5M stores do not have, so weigh it against lighter Shopify reporting apps first.
💰 Solutions offered
Search and chat-based querying over modeled data
Spotter agent for multi-step follow-up analysis
Automated change and anomaly explanations
Liveboards for shared monitoring
Embedded analytics for customer-facing data
📊 Core evaluation metrics
Reasoning depth: strong on modeled metrics, weak on messy relationships
Sources connected: cloud warehouses, not native store apps
Setup time: months if the warehouse does not exist yet
Agentic delivery: scheduled monitoring and alerts
Contribution margin modeling: possible after modeling work
✅ Best for
Mid-market retailers with a warehouse and a data owner
Teams replacing dashboard sprawl with search
Companies embedding analytics for their own customers
🗣️ What operators say
"We've been using ThoughtSpot for several years and people love it. I can teach a non-technical user how to get to their data in a few minutes." — r/analytics user, r/analytics Reddit Thread
"I wouldn't recommend it for a case with a lot of deep data relationships" — r/analytics user, r/analytics Reddit Thread
💸 Pricing
[ ~$95 / Month to Custom ]
1.5 Omni [toc=1.5 Omni]
⭐ Why did we choose this tool?
Omni is the most honest player in this category about where AI breaks. Its pitch is semantic-layer-aware AI, meaning the model answers against governed metric definitions rather than guessing. ✅ That approach reduces confident wrong answers. ❌ It also assumes you have already agreed what CAC and contribution margin mean, which is why we push operators through unit economics tracking before any tool selection.
💰 Solutions offered
Governed semantic layer with AI-aware metric definitions
Workbook-style modeling that mixes SQL and spreadsheet logic
Natural language querying with inspectable output
Version-controlled metric governance
Embedded and shared reporting
📊 Core evaluation metrics
Reasoning depth: high accuracy within defined metrics
Sources connected: warehouse-first, with no native store connectors
Contribution margin modeling: yes, once defined in the layer
✅ Best for
Data-literate teams that value trust over speed
Companies migrating off Looker or legacy BI
Brands with an analytics engineer already on payroll
💸 Pricing
[ Custom to Custom ]
1.6 Polar Analytics [toc=1.6 Polar Analytics]
Polar Analytics cites 4,000 plus ecommerce brands and agencies using its Shopify-native reporting stack.
⭐ Why did we choose this tool?
Polar Analytics is the closest thing to warehouse-grade reporting without hiring anyone. It connects Shopify, ad platforms, and Klaviyo, then builds custom metrics for you. ✅ The Shopify App Store rating sits at 4.9 across 103 reviews. ❌ Reporting depth is real, but reasoning and root-cause work stay thin, which is the line that separates reporting from conversational analytics.
💰 Solutions offered
Native connectors for Shopify, Meta, Google, and Klaviyo
Sources connected: commerce, ads, email, and some finance
Setup time: days, connector-driven
Agentic delivery: scheduled digests and threshold alerts
Contribution margin modeling: partial, since cost inputs are manual
✅ Best for
Shopify brands running multiple stores under one roof
Operators who want reports without engineering time
Teams graduating from spreadsheets to real dashboards
🗣️ What operators say
"I like it, it's great for me as I have 3 separate Shopify stores and it was the only analytical tool I could find which didn't price each store individually" — r/Klaviyo user, r/Klaviyo Reddit Thread
"Whether you're looking to step up your reporting visuals or need in-depth analytics for your business, I highly recommend Polar Analytics." — Verified merchant, Polar Analytics Shopify App Store Review
💸 Pricing
[ $300 / Month to $1,200+ / Month ]
1.7 Sigma [toc=1.7 Sigma]
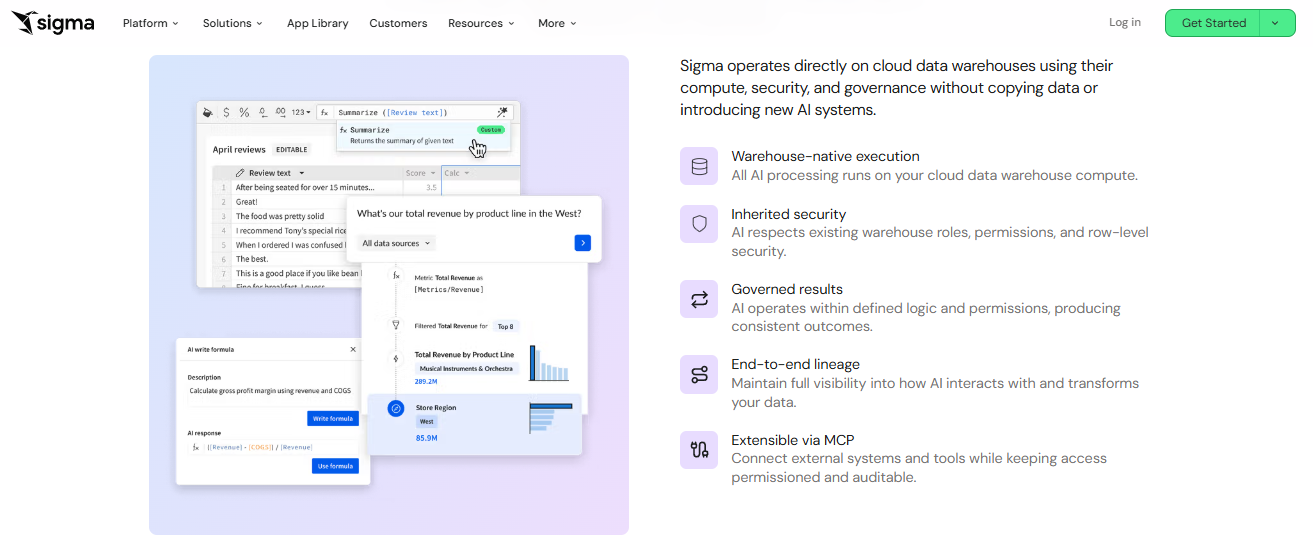
Sigma keeps AI answers inside your warehouse, with governed logic, permissions, and full data lineage.
⭐ Why did we choose this tool?
Sigma wins on familiarity. It puts a spreadsheet interface on top of your cloud warehouse, so finance people explore without learning SQL. ✅ That lowers the training cost dramatically. ❌ Dashboards are less dynamic than dedicated visualization tools, and you still need the warehouse first, a tradeoff we cover in e-commerce tech stack.
💰 Solutions offered
Spreadsheet-style exploration on live warehouse data
AI-assisted formula and query generation
Input tables for what-if scenario work
Row-level security and governed access
Scheduled exports and shared workbooks
📊 Core evaluation metrics
Reasoning depth: strong ad hoc analysis, user-driven not AI-driven
Sources connected: cloud warehouses only
Setup time: weeks, warehouse dependent
Agentic delivery: scheduled exports, with no proactive scanning
Contribution margin modeling: yes, if you build the model
✅ Best for
Finance and ops teams that think in spreadsheets
Brands with Snowflake or BigQuery already running
Companies needing controlled self-serve access
🗣️ What operators say
"if you have users that want to answer their own questions and you are ok with less dynamic dashboards, sigma is a fantastic option." — r/analytics user, r/analytics Reddit Thread
"Basically a SaaS version of Power BI without the need of an additional language to manipulate the data and an Excel like feel to it." — r/analytics user, r/analytics Reddit Thread
💸 Pricing
[ $600 / Month to Custom ]
1.8 Zoho Analytics (Zia) [toc=1.8 Zoho Analytics]
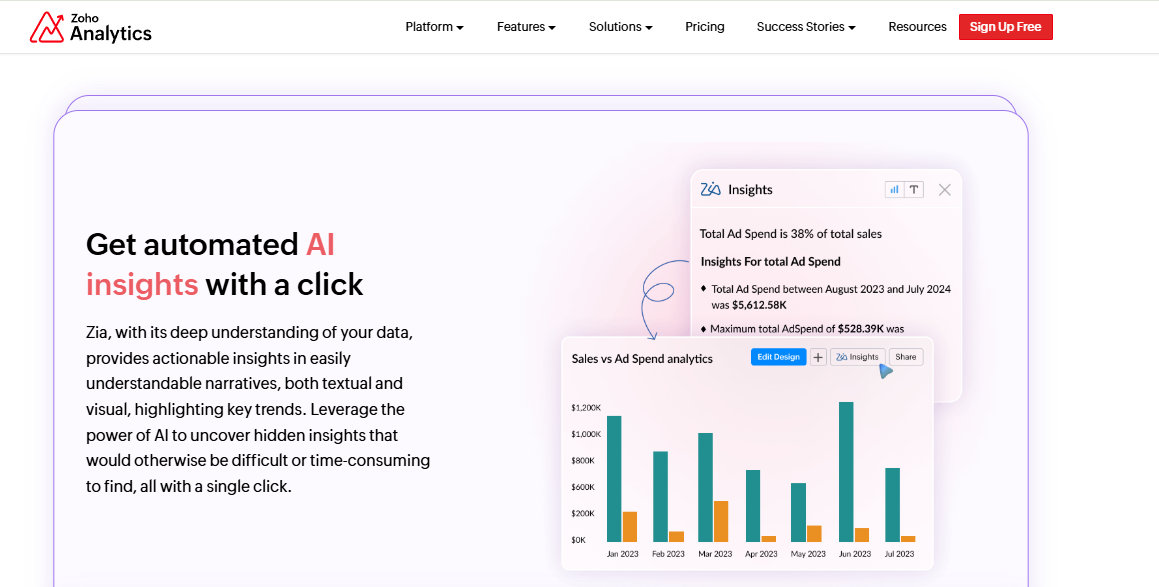
Zoho's Zia turns a sales versus ad spend chart into a plain-language insight summary.
⭐ Why did we choose this tool?
Zoho Analytics is the budget entry point that actually ships generative features. Ask Zia handles plain-language questions and builds reports across blended sources. ✅ Value per dollar is hard to beat. ❌ Financial and inventory logic takes real effort to set up correctly, which is the same wall operators hit with e-commerce data integration.
💰 Solutions offered
Ask Zia natural language querying
Blended reporting across apps and files
Prebuilt connectors for CRM and commerce data
Dashboards with scheduled email delivery
Free tier for very small teams
📊 Core evaluation metrics
Reasoning depth: basic question answering, light on causality
Sources connected: broad app coverage, with e-commerce via connectors
Setup time: days to weeks depending on data logic
Agentic delivery: scheduled reports and simple alerts
"The hardest part for me was learning the logic behind pulling some of the financial data and some of the inventory. Otherwise it's been fantastic and quite user friendly." — r/Zoho user, r/Zoho Reddit Thread
"At the moment, we are utilizing Zoho Analytics for generating reports and managing tables, but we've begun to encounter some constraints." — r/Zoho user, r/Zoho Reddit Thread
💸 Pricing
[ Free to $575 / Month ]
1.9 Amazon Q in QuickSight [toc=1.9 Amazon Q QuickSight]
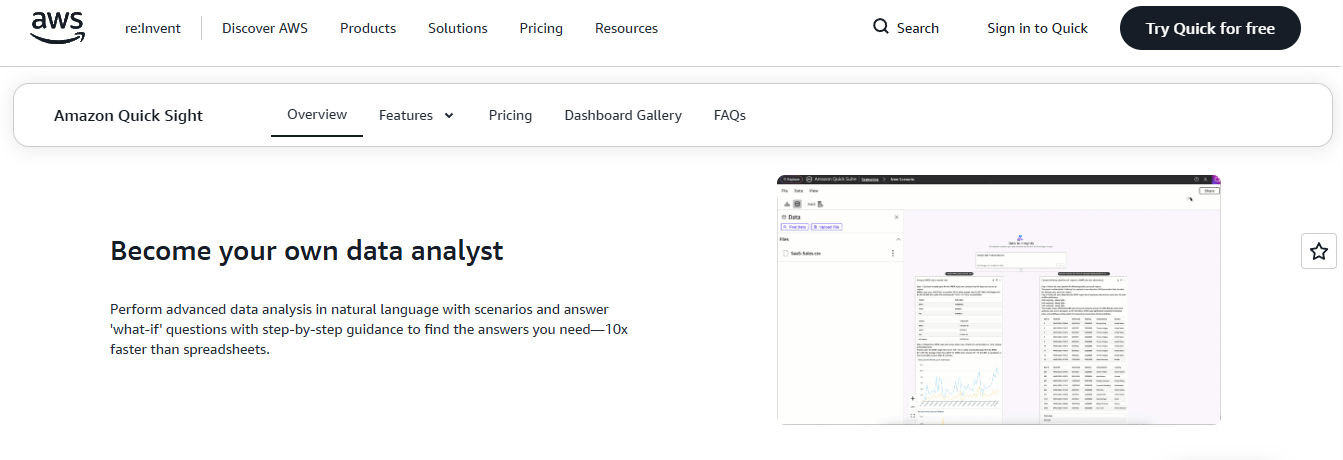
Amazon QuickSight runs what-if scenarios in natural language, though setup still needs engineering help.
⭐ Why did we choose this tool?
Amazon Q in QuickSight makes the list on cost and proximity to your data. If your store data already sits in AWS, natural language dashboard authoring costs very little. ❌ The recurring operator complaint is that you get logs and simple charts, not decisions, which is the exact gap our e-commerce analytics dashboard guide addresses.
💰 Solutions offered
Natural language dashboard authoring
Executive summaries of dashboard changes
Data stories generated from selected visuals
Embedding and white-labeling for external users
Pay-per-session reader pricing
📊 Core evaluation metrics
Reasoning depth: descriptive summaries, with minimal root-cause work
Sources connected: AWS-native sources, with no store connectors
Setup time: weeks, requires data engineering
Agentic delivery: scheduled email reports
Contribution margin modeling: fully manual
✅ Best for
Stores already running infrastructure on AWS
Teams embedding analytics into their own product
Cost-sensitive companies with engineering support
🗣️ What operators say
"It was incredibly cheap in comparison to the competitors and it is pretty good for white-labeling and embedding into existing applications." — r/dataanalysis user, r/dataanalysis Reddit Thread
"It's made for AWS users who want really, really simple visualizations." — r/BusinessIntelligence user, r/BusinessIntelligence Reddit Thread
💸 Pricing
[ $3 / Month to $250+ / Month ]
1.10 Querio [toc=1.10 Querio]
⭐ Why did we choose this tool?
Querio is AI-native rather than AI-retrofitted. It gives technical operators agentic notebooks that explore warehouse data and return reasoned answers instead of tickets. ✅ Speed to answer is genuinely good. ❌ It suits founders comfortable with data models, not merchants who want plug and play, so compare it against agents for e-commerce built for non-technical teams.
💰 Solutions offered
Agentic notebooks for multi-step data exploration
Warehouse-connected natural language querying
Shareable analysis artifacts for teams
Customer-facing data exploration
Context layer for business definitions
📊 Core evaluation metrics
Reasoning depth: strong multi-step analysis on modeled data
Sources connected: warehouse-first, with no native store apps
Setup time: days to weeks with existing infrastructure
Agentic delivery: notebook automation, with limited push alerts
Contribution margin modeling: yes, with defined inputs
✅ Best for
Technical founders and lean data teams
Startups replacing analyst request queues
Companies with a warehouse already in place
💸 Pricing
[ Custom to Custom ]
1.11 Draxlr [toc=1.11 Draxlr]
⭐ Why did we choose this tool?
Draxlr is the cheapest honest option here. It connects to your database, builds dashboards without SQL, and starts near $25 a month. ✅ For a store under $500K, that price is defensible. ❌ Depth is limited, and AI features stay closer to query help than reasoning, so most brands outgrow it on the way to predictive analytics for e-commerce.
💰 Solutions offered
SQL-free dashboard and chart building
Basic natural language query assistance
Threshold alerts to email and Slack
Direct database connections
Shared dashboards for small teams
📊 Core evaluation metrics
Reasoning depth: minimal, reporting-focused
Sources connected: databases, with limited native connectors
Setup time: hours if a database exists
Agentic delivery: simple alerts only
Contribution margin modeling: no
✅ Best for
Early-stage stores needing cheap visibility
Teams with a developer who owns the database
Operators validating what to measure before paying more
💸 Pricing
[ $25 / Month to $199 / Month ]
Luca AI is built for the operator who never gets to the warehouse project. It normalizes commerce, ad, support, and accounting data on ingestion, so root-cause and forecasting questions get answered in plain English on day one. You can see how that plays out across real Luca AI use cases.
Q2. How Did We Score and Rank These Generative BI Tools? [toc=2. Scoring Methodology]
Each tool was scored across five weighted criteria: Reasoning Depth, meaning root cause, simulation, and forecasting (30%); E-commerce Data Coverage and Setup Time (25%); Agentic and Proactive Delivery (15%); Pricing Transparency (15%); and Verified User Reviews (15%). Star bands follow the score directly, from one star at the bottom to five stars at the top. Luca AI carries five stars on this rubric.
⭐ The five criteria and why each weight
Scoring Criteria and Weights for Generative BI Tools
Criterion
Weight
Why it carries this weight
Reasoning Depth
30%
Root cause, simulation, and forecasting are what change a decision
E-commerce Data Coverage and Setup Time
25%
An answer is only as wide as the sources connected
Agentic and Proactive Delivery
15%
Pushed findings beat findings you must go looking for
Pricing Transparency
15%
Hidden tiers and query overages wreck small budgets
Verified User Reviews
15%
Public evidence over vendor claims
Reasoning Depth takes the largest share on purpose. A tool that returns last week's revenue is a report. A tool that explains why revenue moved, and what to do next, is worth paying for, which is the standard we apply across e-commerce reporting.
📊 How stars map to the bands
Scores are grouped into five bands, and each band earns one more star than the one below it. Nothing else influences the stars. Luca AI measures the same five criteria for every tool on the list, including itself, using one fixed set of seven test questions.
⭐ Reporting only, no meaningful reasoning
⭐⭐ Basic querying, weak on e-commerce sources
⭐⭐⭐ Solid reporting, shallow causal analysis
⭐⭐⭐⭐ Strong reasoning, needs a warehouse or an analyst
⭐⭐⭐⭐⭐ Reasoning plus native coverage plus pushed delivery
⚠️ The conflict I am not hiding
I built Luca AI, and Luca AI published this rubric, so the ranking carries an obvious bias. My answer is to show the criteria, the weights, and the test questions so you can re-run the math yourself. Drop Agentic Delivery to zero if you never want a push notification. Raise Pricing Transparency if your budget is the binding constraint, and check our published Luca AI pricing tiers against every vendor quote you collect.
The honest caveat sits in the review data. G2's analysis of 1,940 verified natural language software reviews in July 2026 found most buyers see returns inside six months, while output quality still lags behind speed. That gap is real across this whole category, including for us.
❌ What I refused to score
Visualization polish did not earn a criterion. Neither did template count, chart libraries, or dashboard themes. Charts are a courtesy for the human reader, not the substance of the answer. When a reasoning engine digests the data and tells you what matters, the picture is the receipt, not the product, a point we unpack in e-commerce data visualization.
I also skipped enterprise governance depth, since almost nobody in the €1M to €5M band is buying on that. If you have a data team and a compliance review, weight it back in and the top of this list will shift toward Omni and ThoughtSpot.
One useful frame before you re-weight anything. Ask what you would need if a tool cost ten times more, and what you would still demand if it cost a tenth. The features that survive both questions are your real criteria. Everything else is packaging.
Luca AI is trained on the relationships between e-commerce metrics, which is why Reasoning Depth sits at 30% rather than data connector count. That weighting reflects what actually replaces a junior analyst's work, and you can see the same logic applied to top e-commerce KPIs.
Q3. What Exactly Are Generative BI Tools, and How Do They Differ From Traditional and Agentic BI? [toc=3. Generative BI Explained]
Generative BI tools apply large language models to business intelligence, so you ask a question in plain English and get a number, chart, or explanation back. The tool interprets the question, writes the query (usually SQL), runs it, and narrates the result. Traditional BI hands you a prebuilt report to interpret. Agentic BI plans multi-step work and pushes findings to you unprompted.
⏰ The four steps happening under the hood
Text-to-SQL is the engine room here. SQL is the language databases speak, and the model writes it for you. IBM frames generative BI as applying generative AI to the BI workflow itself, not bolting a chat window onto a report.
Say you ask why last week's blended ROAS dropped. Step one, the model reads your question. Step two, it writes queries against spend, orders, and channel data. Step three, it runs them. Step four, it explains the movement in sentences, not cells, which is the working definition of conversational analytics for e-commerce.
📊 The three tiers, side by side
Traditional BI vs Generative BI vs Agentic BI
Tier
What you do
What you get
Example
Traditional BI
Open a prebuilt report
A chart you must interpret
Power BI, Sigma
Generative BI
Ask a question
An answer plus the reasoning
ThoughtSpot Spotter, Omni
Agentic BI
Set a goal or threshold
Pushed findings and next steps
Luca AI, Moby agents
The dividing line in 2026 is not chat versus no chat. It is one-shot answers versus systems that plan, follow up, and act, a shift covered in agentic AI for e-commerce founders.
✅ What each tier can and cannot do for a store
Traditional BI is fine for stable questions you already know to ask. It fails the moment the question is new. Generative BI handles the new question, then stops until you ask again.
Agentic tools go further into simulation and root-cause work. Ask Luca AI to study a pattern in customer data and ping you when it breaks, and the monitoring runs without you opening anything. That difference matters most on the days you are too busy to look.
⚠️ Onboarding beats installation
Here is where most rollouts go wrong. Bringing one of these tools in is like hiring a brilliant generalist on day one. Smart, fast, and completely ignorant of your business.
Nobody tells a new hire "you're smart, go write this email" and expects good work. The hire needs context, definitions, and history. The tool needs the same, and it needs them before you judge the answers, which is why e-commerce data management comes before tool selection.
❌ Why "AI chatbot" is the wrong frame
Operators are tired of chat windows that summarize a dashboard back to them. Call this what it is, a reasoning engine sitting on your data. The chart is output for the model as much as for you.
Panintelligence and TDWI both land on the same catch. The promise is real, and the trust depends entirely on the metric definitions underneath. Which raises the question this article has to answer next.
Luca AI operates at the agentic tier, pushing weekly and monthly reports with graphs, reasoning, and recommendations into Slack or email. Nobody on the team has to open a tool for the analysis to land, and the same pattern powers our automated data reporting in e-commerce approach.
Dashboards fail because they are descriptive, not prescriptive. They show that ROAS fell without naming the lever to pull, so the operator becomes a dashboard janitor stitching exports together. Reaching a decision through dashboards takes roughly three hours. Asking conversationally takes about three minutes. The finish line is the recommendation, not the chart.
⏰ The Monday morning scene
Picture an operator selling skincare on Shopify, doing $180K a month, mostly Meta and email. Monday at 9am, three tabs open: Shopify Analytics, Klaviyo, and Meta Ads Manager. Thirty minutes later, she picks a product to promote based on a hunch.
She is not confused about the numbers. She can read every chart on the screen. What she cannot do is get from those charts to a decision she trusts, which is the exact failure mode behind every Shopify analytics dashboard complaint.
❌ The receipts are public
This complaint is not a marketing invention. Operators say it out loud, repeatedly:
"Am I the only one who opens Shopify Analytics every Monday and has no idea what to do with it?" — r/shopify user, r/shopify Reddit Thread
"I've opened multiple tickets with Shopify support because the analytics are utterly ineffective." — r/EcommerceWebsite user, r/EcommerceWebsite Reddit Thread
💰 This does not stop at $180K a month
The manual reporting problem scales with you; it does not solve itself. Brands running nine figures of GMV still describe spreadsheet weeks built on Shopify exports and returns system exports. The tooling gets fancier. The stitching stays manual.
Store owners keep asking for one report that merges sales and payment data with reconciliation. That request has been open for years, which tells you it is architectural, not a missing feature, and it is why e-commerce data integration decides what your tool can answer.
⚠️ Descriptive KPIs stop at "so what"
A KPI tells you what happened. Revenue is down 12%. Fine. Then what?
The gap between "what happened" and "what should I do" is where the whole category lives. Dumping more AI summaries into that gap makes it worse, not better. Twenty-five-page executive summaries across Klaviyo, Meta, and Google are impressive and unusable.
✅ The shape of the fix
The fix is not a better chart. It is a system that answers the question, then keeps watching when you close the laptop. Ask Luca AI to alert you when inventory drops below 500 units or CAC spikes, and the ping arrives in Slack without a dashboard visit.
My read is that dashboards will not disappear; they will demote. They become the receipt you check after the recommendation, not the place you start, which reframes how you should read any e-commerce monitoring tool.
Luca AI scans connected data 24/7 and pushes an alert when ROAS dips, CAC spikes, or stock falls below your threshold. We built it that way because the Monday scroll was never the job.
Q5. What Data Foundation Does a Generative BI Tool Need to Answer a Profit Question? [toc=5. Data Foundation Required]
A generative BI tool can only answer a profit question if commerce, ad, email, returns, support, 3PL, and accounting data sit in one normalized layer with agreed metric definitions. A typical store above one million in revenue runs 8 to 12 separate tools. Output quality is capped by that semantic layer, not by the model. If contribution margin is undefined, every answer about it is a guess.
📊 The seven sources, and the layer that joins them
A semantic layer is just the agreed dictionary for your business. It says what "revenue," "customer," and "CAC" mean, once, for every tool that reads your data. Without it, two systems return two numbers and both look right, which is the core failure mode in e-commerce data collection.
Luca AI normalizes and standardizes data on ingestion across Shopify, Meta, Google, Klaviyo, accounting tools, 3PL, and support. The point is to skip the cleanup year, not to admire the pipeline.
💰 The invoice that changed a founder's year
A founder showed me an invoice with a 72% gross margin on her hero product. Real number, real invoice. Then we pulled shipping, returns, and support tickets into the same view.
Contribution margin came back at 8%. She had spent two years scaling a product that barely broke even. The data was sitting right there. She just could not see it, which is exactly why contribution margin vs gross margin is the first distinction we teach operators.
⚠️ Support cost belongs on the SKU
Here is the part most tools skip. Fixed overhead gets treated as a company-level line, so nobody allocates it down to the product. That hides the losers.
On one product I looked at, 42% of all customer service tickets traced back to a single SKU. Allocated properly, that support load ran $1.45 per unit. Ask Luca AI to allocate ticket volume by product, and that cost stops being invisible.
❌ Schema mismatches break answers before the model runs
Retail calendars are the classic trap. One system labels a week 554, another labels the same week 332. Join them wrong and every year-over-year comparison lies.
Order IDs, refund records, and currency fields fail the same way. Luca AI handles this standardization at ingestion, which is why the reasoning layer never sees three versions of one week.
✅ Benchmarks so you can smell a bad answer
You need reference points, or you cannot judge whether an AI answer is plausible. Triple Whale's 2025 dataset covered 30,000+ brands and $2.9B in tracked spend, with median CPA at $32.74 and conversion rate at 2.01%. Meta absorbed 68.31% of DTC ad dollars that year.
Common Thread Collective's benchmark on $231M of tracked spend puts paid media at 25% to 35% of revenue for brands under $1M. If your tool reports numbers far outside those bands, check the joins before you act, and sanity-check them against your own e-commerce profit margins.
🗣️ What operators run into
"The hardest part for me was learning the logic behind pulling some of the financial data and some of the inventory. Otherwise it's been fantastic and quite user friendly." — r/Zoho user, r/Zoho Reddit Thread
"A recurring request I've noticed from store owners is the desire for a unified Shopify Analytics report that merges sales and payment data" — r/shopify user, r/shopify Reddit Thread
Your Monday action is small. List your seven sources, then mark which ones your current tool cannot read. That list is your real shortlist criteria, and our guide to e-commerce API integrations shows what each connection actually unlocks.
Luca AI connects commerce, ads, email, support, 3PL, and accounting into one normalized layer, then reasons across them. We built ingestion-time standardization because operators do not have a spare quarter for schema mapping.
Q6. Can You Actually Trust the Answers a Generative BI Tool Gives You? [toc=6. Accuracy and Trust]
Trust these tools only as far as the definitions and tracking beneath them. Verified review data across 1,940 natural language deployments found speed outpacing output quality. E-commerce attribution match rates of 70% to 85% leave 15% to 30% of revenue unattributed before the model reasons at all. Demand inspectable SQL, an audit trail, and human review on anything customer-facing.
⚠️ Three things accuracy actually depends on
Metric definitions. If CAC is undefined, the answer is invented.
Data completeness. Missing returns or support data skews every margin answer.
Query transparency. If you cannot read the query, you cannot check the claim.
Luca AI is an AI layer over your data that handles root-cause analysis, influencing-factor identification, and prediction. It is explicitly not an attribution pixel, so it inherits whatever tracking gap your pixel already has.
❌ Where hallucinations actually come from
Most bad answers are not model failures. They are ambiguous definitions and missing joins wearing a confident voice. The model fills the gap because that is what models do.
One operator I trust described the AI forecasting built into her inventory system bluntly. It hallucinated, told fibs, and got switched off. Bolted-on AI inside vertical software often performs worse than a general reasoning engine fed clean data, a pattern worth remembering when you audit e-commerce management software.
💸 The attribution ceiling nobody prices in
Practitioner testing in 2026 put Triple Whale's Meta match rates at 70% to 85% on iOS-heavy audiences, against 40% to 60% for a raw Meta pixel. That is a genuine improvement. It still leaves a real chunk of revenue unassigned.
Add 2 to 3 weeks of pixel calibration before the data is trustworthy at all. Any conversational layer sitting on top inherits that ceiling. Nobody in this category says that out loud, which is the honest context behind declining platform ROAS vs true profitability.
✅ What to demand before you sign
Trust Requirements to Demand From a Generative BI Vendor
Requirement
Why it matters
Ask the vendor
Inspectable query
Lets you verify the number
Show me the SQL behind this answer
Audit trail
Reproduces answers later
Can I replay last month's query?
Stated assumptions
Exposes silent guesses
Which definition did you use for CAC?
Confidence signals
Flags weak data
What happens when data is missing?
Ask Luca AI to explain how it reached a number, and the reasoning comes with the answer rather than after a support ticket.
🗣️ What practitioners say about bolted-on AI
"My experience of CoPilot so far on anything non trivial is that it's fantastic at producing very plausible garbage" — r/PowerBI user, r/PowerBI Reddit Thread
"It's terrible, just like most AI features implemented by the big, old players." — r/PowerBI user, r/PowerBI Reddit Thread
⏰ The month-one verification routine
Ask the same question three different ways. If you get three different numbers, your definitions are broken, not the model.
Then check one query by hand against your accounting system. Keep a human in the loop on anything customer-facing. A luxury bike brand once shipped a homepage image with the rear derailleur on the front wheel. Do not let the AI be your QA.
Luca AI is trained on the relationships between e-commerce metrics rather than general text, which is why it holds up on root-cause work where a generic model guesses. My read is that this narrows the error band, and it does not eliminate it.
Q7. How Do You Choose, Price, and Deploy the Right Generative BI Tool? [toc=7. Evaluate, Price, Deploy]
Test every tool with the same seven questions, starting with which SKU is unprofitable after returns and support cost, and what happens to cash in 90 days if you raise Meta spend 30%. Then price the full stack, not the seat. Licenses run from free tiers and roughly $25 per month up to $499 before key modules unlock, plus warehouse and query costs. Deploy in four weeks.
⭐ The seven-question demo script
Which SKU is unprofitable after returns and support cost?
Which acquisition cohort repurchased above target last quarter?
What happens to cash in 90 days if Meta spend rises 30%?
Why did conversion rate move last week?
Which creative is fatiguing, and by how much?
Which supplier slipped on lead time this quarter?
What should I do first on Tuesday morning?
Luca AI handles analytics, predictive analytics, simulation, anomaly detection, cohort work, and root-cause analysis, so run the script against us too. Score honestly.
✅ How to score the answers
Four checks per answer. Is the number correct against your accounting system? Can you trace the source? Did it state its assumption? Did it recommend an action?
Two answers fail loudly. Confident wrong numbers, and 25-page summaries nobody can act on. One operator described getting 20 executive summaries across Klaviyo, Meta, and Google, then having no idea what to do with any of them, which is the gap our e-commerce performance analytics framework closes.
💰 Price the stack, not the seat
Total Cost of Ownership by Store Size
Store size
License
Warehouse
Setup
Query overage risk
Under $1M
$25 to $300 / month
Often none
Under 10 hours
Low
$1M to $5M
$300 to $600 / month
$200 to $800 / month
20 to 60 hours
Medium
Over $5M
$600+ / month
$1,000+ / month
100+ hours
High
Watch the tier gate. Triple Whale starts near $129 a month, while the modules most brands want sit at the $499 Whale tier. Draxlr starts at $25, and Zoho Analytics has a free tier. If attribution pricing is what pushed you here, read our take on Triple Whale alternatives.
💸 The build-versus-buy math has changed
Building your own reasoning layer is now the most expensive wrong answer available. One founder spent roughly $10 million building a system to turn data into meaning, then watched LLMs outperform it.
Ask Luca AI what a comparable in-house build would cost you in engineering months, and compare that against a subscription. The math rarely favors building below $20M revenue.
⏰ Week one and week two
Week one, connect your sources and agree on definitions for CAC, contribution margin, and blended ROAS. Write them down. Disagreements surface here, not in month three, and our list of e-commerce KPIs is a useful starting dictionary.
Week two, onboard the tool like a new hire. Feed it context, history, and vocabulary. Luca AI shortens week one because normalization happens at ingestion, so most stores ask real questions on day one.
✅ Week three and week four
Week three, run the seven-question script and correct wrong answers. Every correction teaches the layer something permanent.
Week four, replace two recurring reports with pushed alerts, then retire the dashboards nobody opens. Give the tool a name if that helps adoption. One CEO called hers Harry, and it stopped a hundred questions a day from new staff.
🗣️ What operators report
"It was incredibly cheap in comparison to the competitors and it is pretty good for white-labeling and embedding into existing applications." — r/dataanalysis user, r/dataanalysis Reddit Thread
"Shopify's native analytics frustrated me enough to build something" — r/dropship user, r/dropship Reddit Thread
Luca AI fits SMB and mid-market operators rather than enterprises with data teams already in place. We say that plainly because the wrong fit wastes your quarter, not ours. You can see the fit boundaries in detail across Luca AI use cases.
What I keep wondering is whether the seven-question script gets harder by 2027, once these tools can act on their own recommendations. If you run the script this month, send me what failed. That failure list is more useful than any vendor demo, so tell us what you are building.
FAQ's
What are generative BI tools, and how are they different from a normal dashboard?
Generative BI tools apply large language models to business intelligence. You ask a question in plain English, and the tool interprets it, writes the query (usually SQL), runs it, and explains the result in sentences.
A dashboard does something different. It shows a prebuilt chart and leaves the interpretation to you. That works fine for questions you already know to ask, and it fails the moment the question is new.
Traditional BI: you open a report and read a chart.
Generative BI: you ask a question and get an answer with reasoning.
Agentic BI: you set a goal or threshold, and findings get pushed to you unprompted.
Luca AI operates at the agentic tier, pushing weekly and monthly reports with graphs, reasoning, and recommendations into Slack or email without anyone opening a tool. We built it that way because the Monday dashboard scroll was never the actual job.
The practical difference for an operator is where the work stops. A dashboard stops at what happened. A reasoning engine continues into why it happened and what to do next, which is the whole premise behind conversational analytics for e-commerce.
Can generative BI tools be trusted, or do they just hallucinate numbers?
Trust them only as far as the definitions and tracking underneath them. Verified review data across 1,940 natural language deployments found speed outpacing output quality, which matches what we see in the field.
Most bad answers are not model failures. They are ambiguous metric definitions and missing joins delivered in a confident voice. The model fills the gap because that is what models do.
Three dependencies decide accuracy:
Metric definitions. If CAC is undefined, the answer is invented.
Data completeness. Missing returns or support data skews every margin answer.
Query transparency. If you cannot read the query, you cannot check the claim.
There is also a ceiling nobody prices in. E-commerce attribution match rates of 70% to 85% leave 15% to 30% of revenue unassigned before the reasoning even starts.
Luca AI is trained on the relationships between e-commerce metrics rather than general text, which is why it holds up on root-cause work where a generic model guesses. My honest read is that this narrows the error band without eliminating it.
Do I need a data warehouse before a generative BI tool is useful?
Not always, and it depends entirely on how the tool ingests data. Warehouse-first platforms such as Omni, ThoughtSpot, and Sigma expect a modeled warehouse and a governed semantic layer before their AI produces reliable answers.
A semantic layer is simply the agreed dictionary for your business. It defines what revenue, customer, and CAC mean once, for every tool reading your data. Without it, two systems return two numbers and both look correct.
Luca AI normalizes and standardizes data on ingestion across Shopify, Meta, Google, Klaviyo, accounting tools, 3PL, and support, which removes the cleanup year most warehouse projects lose. We built ingestion-time standardization because operators do not have a spare quarter for schema mapping.
What you genuinely need before buying anything:
Clean, connected sources across commerce, ads, email, returns, support, and accounting
Agreed definitions for CAC, blended ROAS, and contribution margin
Enough history to reason against, usually six to twelve months of orders
Schema mismatches are the silent killer. One system labels a retail week 554, another labels the same week 332, and every year-over-year comparison quietly lies. Start by listing your sources and marking which ones your current tool cannot read, then read our guide to e-commerce data integration.
Which questions should I ask in a generative BI demo before I buy?
Use the same seven questions on every vendor, then score the answers identically. Vendor feature lists tell you nothing about whether a tool can reason across your data.
Which SKU is unprofitable after returns and support cost?
Which acquisition cohort repurchased above target last quarter?
What happens to cash in 90 days if Meta spend rises 30%?
Why did conversion rate move last week?
Which creative is fatiguing, and by how much?
Which supplier slipped on lead time this quarter?
What should I do first on Tuesday morning?
Score four things per answer. Is the number correct against your accounting system, can you trace the source, did it state its assumption, and did it recommend an action?
Two failure signatures matter. Confident wrong numbers, and enormous summaries nobody can act on. One operator described receiving twenty executive summaries across Klaviyo, Meta, and Google, then having no idea what to do with any of them.
Luca AI handles analytics, predictive analytics, simulation, anomaly detection, cohort work, and root-cause analysis, so run this script against us too and score honestly. Baseline your current tool first, because that failure list becomes your real selection criteria. Our breakdown of e-commerce KPIs gives you the definitions to check answers against.
What do generative BI tools actually cost for a store doing 1M to 5M in revenue?
Price the stack, not the seat. Licenses alone range from free tiers and roughly $25 per month at the low end up to $499 per month before the modules most brands actually want unlock.
For a brand between $1M and $5M, budget realistically across four lines:
License: roughly $300 to $600 per month
Warehouse: $200 to $800 per month if the tool is warehouse-first
Implementation: 20 to 60 hours of internal or contractor time
Query overages: consumption pricing that scales with how much your team asks
Watch the tier gate specifically. Triple Whale starts near $129 a month, while the modules brands want sit at the $499 Whale tier. Draxlr starts around $25, and Zoho Analytics has a free tier.
Luca AI prices at €299 for Starter, €499 for Growth, and custom for Scale, with normalization included rather than billed as a separate data project. We publish the tiers because opaque pricing wastes everyone's evaluation time.
Building your own reasoning layer is now the most expensive wrong answer. One founder spent roughly $10 million building a system to turn data into meaning, then watched general models outperform it. Compare subscription cost against engineering months, then check current Luca AI pricing.
Enjoyed the read? Join our team for a quick 15-minute chat — no pitch, just a real conversation on how we’re rethinking Ecommerce with AI - Luca
Loading Schedule...
Your AI Co-Founder is here.
Here’s why:
Shopify, Meta, Xero - one brain.
"Should I scale?" Answered with real data.
Growth capital. No applications. One click.
Thank you! Your submission has been received! Please book a time slot for the Meeting
Oops! Something went wrong while submitting the form.