10 Best AI Reporting Software Tools for Ecommerce — Automated Narratives, Scheduled Digests and Anomaly Alerts Covered
13
mins read
TL;DR
The ten tools we rank are Luca AI, Triple Whale, Polar Analytics, Lifetimely by AMP, Peel Insights, Daasity, Report Pundit, Better Reports, Improvado, and Whatagraph.
We scored each on Reasoning Depth, E-commerce Data Coverage, Time to First Trustworthy Insight, Pricing Transparency, and Verified User Reviews, and we refused to score dashboard aesthetics.
Automated narratives explain why a metric moved, scheduled digests deliver a fixed metric set on a cadence, and anomaly alerts fire only on a baseline breach.
Gross margin hides landed cost, shipping, refunds, fees, and support cost. One bestseller showing 72% gross margin returned just 8% contribution margin.
Set alert thresholds against a 28 day rolling baseline plus two standard deviations, using median ROAS 1.86, MER 0.49, and CVR of 1.70% to 2.69%.
Pricing runs from $9 per month for Shopify report apps to €2,000 or more for enterprise pipelines, and pixel attribution needs two to three weeks before it is trustworthy.
Q1. What Are the 10 Best AI Reporting Software Tools for E-commerce in 2026? [toc=1. Top 10 Tools]
The 10 best AI reporting software tools for ecommerce in 2026 are Luca AI, Triple Whale, Polar Analytics, Lifetimely by AMP, Peel Insights, Daasity, Report Pundit, Better Reports, Improvado, and Whatagraph. Luca AI ranks first because it reasons across commerce, ad, accounting, and operations data in one normalized model, running root-cause and forecast queries instead of rendering another dashboard.
Most store owners I talk to are not short of data. They are short of one place where the data agrees with itself. You log into Shopify, then Meta, then Xero, then a spreadsheet, and you stitch the story together yourself. That stitching is the job automated ecommerce reporting is supposed to delete. Below are the ten tools worth your evaluation time, followed by a comparison table and then the detailed breakdowns.
The Shortlist at a Glance
Luca AI, Best for cross-functional AI reporting across commerce, ads, and finance
Triple Whale, Best for DTC marketing attribution and blended ad reporting
Polar Analytics, Best for Shopify-native dashboards without a data engineer
Lifetimely by AMP, Best for LTV, cohort, and profit-per-order reporting
Peel Insights, Best for automated retention and repeat-purchase analysis
Daasity, Best for multi-channel brands needing a real warehouse
Report Pundit, Best for low-cost custom Shopify report building
Better Reports, Best for scheduled Shopify exports to Sheets and email
Improvado, Best for enterprise marketing data pipelines
Whatagraph, Best for agencies delivering white-label client reports
Comparison Table
10 Best AI Reporting Software Tools for E-commerce in 2026
Custom Shopify report builder, Sheets and email scheduling
Ops teams automating recurring exports
$19.90 / Month to $299 / Month
Improvado ⭐⭐⭐⭐
500+ marketing connectors, data governance, AI agent layer
Enterprise marketing and agency data teams
Custom (typically $2,000+ / Month)
Whatagraph ⭐⭐⭐
Multi-source reporting, white-label templates, AI summaries
Agencies reporting to many clients
€699 / Month to €1,500+ / Month
1.1 Luca AI [toc=1.1 Luca AI]
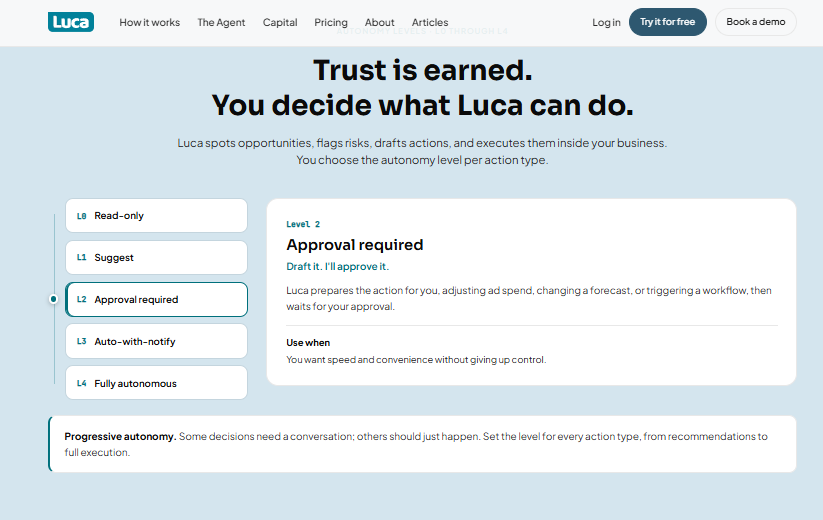
Luca AI lets operators set autonomy per action type, from read-only suggestions to full execution
🧠 Why Did We Choose This Tool?
I built Luca AI, so treat my ranking with the skepticism it deserves. It sits first for one structural reason. Luca AI is an AI layer over your whole data warehouse, not a channel tool with a chat box bolted on. Ask why contribution margin slipped and it isolates the influencing components across ads, refunds, shipping, and fees. Most analytics tools added AI. Luca is AI. If you only want Meta attribution, pick something else on this list.
⚙️ Solutions Offered
Single source of truth across Shopify, Meta, Google, Klaviyo, Stripe, Xero, and inventory systems
Founders and finance leads who need marketing and cash numbers in one answer
📌 Case Study
What was the problem? A European skincare brand doing roughly €2.4M a year had eleven tools and no agreement between them. Their best-selling serum showed strong gross margin, so they kept scaling spend behind it.
How Luca helped? Luca AI connected Shopify, Meta, Google, Klaviyo, Stripe, and Xero, then rebuilt margin per SKU using landed cost, refunds, shipping, and payment fees. The anomaly monitor also flagged a quiet refund-rate climb on one variant.
What was the outcome? ⚠️ The serum's true contribution margin came in far below the gross figure the team had been scaling against. They repriced it, pulled spend to two profitable SKUs, and fixed the variant driving returns. 💰 Weekly reporting work dropped from most of a day to a Monday morning digest read over coffee.
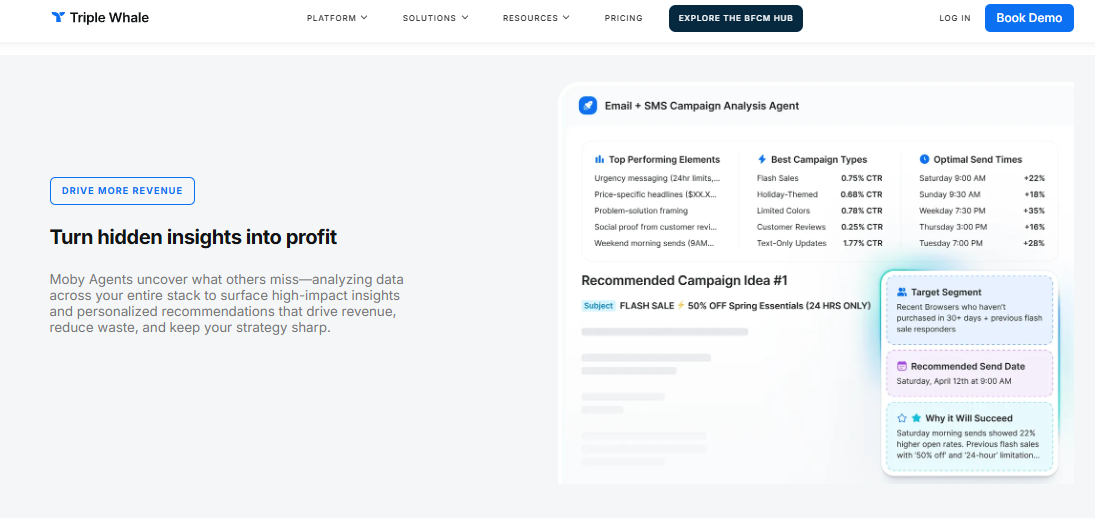
Triple Whale Moby Agents turn campaign data into recommended send times, segments and revenue actions
🐳 Why Did We Choose This Tool?
Triple Whale earned its place by solving the problem every media buyer feels at 2am. Platform numbers disagree, and someone has to decide where tomorrow's budget goes. Its first-party Triple Pixel collects conversion data independently of ad platforms, and Moby agents automate the analysis on top.
For brands spending real money on Meta and Google, that blended view is genuinely useful. ✅ Marketing reporting depth is the best on this list. ❌ The reporting stops at commerce and marketing, so cash, payables, and accounting sit outside the picture. My read is that it fits paid-heavy brands, not finance-led ones, which is why operators keep shortlisting Triple Whale alternatives.
⚙️ Solutions Offered
First-party pixel tracking with multi-touch attribution and marketing mix modeling
Blended dashboards for ROAS, MER, CAC, and new-customer revenue
Moby AI agents for scheduled analysis and anomaly detection on marketing metrics
Creative-level reporting across Meta, Google, and TikTok
Peer benchmark views drawn from its aggregated customer data
📊 Core Reporting Metrics
Data layers covered: Commerce, ads, email, and SMS
Native connectors: 50+ marketing and commerce integrations
Automated narratives: Yes, within the marketing domain via Moby
Scheduled digests and alerts: Yes, daily and weekly summaries plus metric alerts
Time to first insight: Days, and two to three weeks before pixel data settles
✅ Best For
DTC brands spending above roughly $15,000 a month on paid media
Teams that already have finance reporting handled elsewhere
💬 Reviews
"Triple Whale is very user-friendly and easy to navigate to find the data you need across multiple channels. Relevant channels like emails, ads, organic, etc are already broken down for you and when looking at the specific channel, you have the option to customize the table displaying the data to choose which metrics are most relevant for your needs. Some data we still notice discrepancies between platforms, for example, tracking ads, and differences in the reported metrics like revenue." — Verified User, 4/5 Triple Whale G2 Verified Review
"Its very easy to use and works good for a multichannel solution. Sometimes it does not update the numbers correctly and has errors with synchronisation." — Verified User, 3/5 Triple Whale G2 Verified Review
⏰ One Honest Limitation
Sync errors and cross-platform discrepancies show up repeatedly in verified reviews. Plan on a manual sanity check against your Shopify analytics dashboard before you present numbers to a board.
💰 Pricing
[ $129 / Month to $1,290+ / Month, scaling with order volume and ad spend ]
1.3 Polar Analytics [toc=1.3 Polar Analytics]
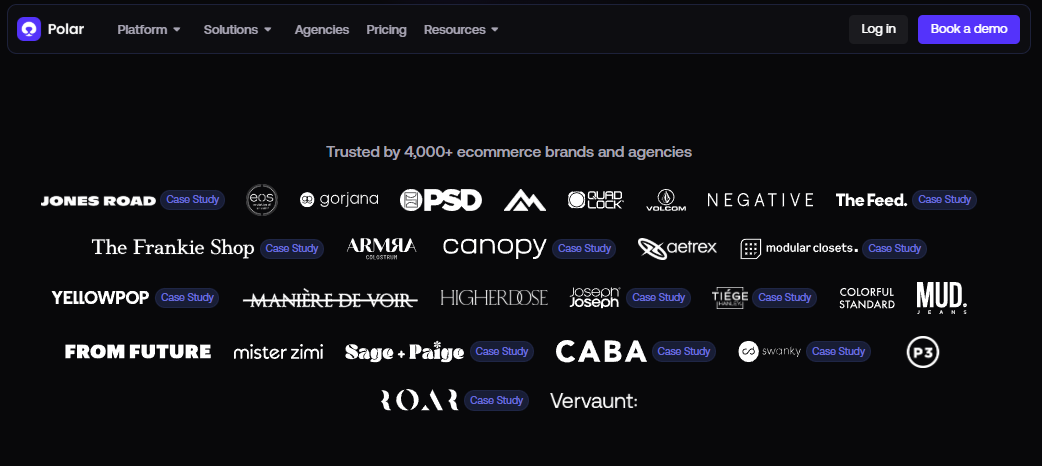
Polar Analytics lists over 4,000 ecommerce brands and agencies using its Shopify-native reporting
🔍 Why Did We Choose This Tool?
Polar Analytics solves a narrow problem well. It gives a Shopify-native metrics layer without asking you to hire a data engineer. Custom dashboards, alerts, and AI summaries sit on top of your store and ad accounts.
✅ Setup is genuinely fast for a tool in this tier. ❌ The reporting stays inside commerce and marketing, so payables and cash sit outside it. My read is that it fits teams who want dashboards, not answers, which is why buyers often compare Polar Analytics alternatives before signing.
⚙️ Solutions Offered
Shopify-native metrics with prebuilt ecommerce dashboards
Custom dashboard builder with no SQL required
AI insight summaries on tracked metrics
Metric alerts pushed to Slack and email
Multi-store and multi-currency views
📊 Core Reporting Metrics
Data layers covered: Commerce, ads, email, and web
Native connectors: 40+ commerce and marketing integrations
Automated narratives: Yes, short summaries on tracked metrics
Scheduled digests and alerts: Yes, Slack and email
Time to first insight: Hours to a few days
✅ Best For
Shopify brands wanting dashboards without hiring an analyst
Growth teams tracking blended performance across paid channels
"The company is so lazy in their use of AI that Faizan J (employee at polar analytics) will use Mike S's (another employee) email to send a pitch email to you addressing it to Mike which isn't my name. If that is their modus operandi, how can you can trust their results?" — Matthew Wong, CA Polar Analytics TrustPilot Verified Review
Value per euro is the recurring complaint at this price tier. Run the trial against one real question before committing annually.
💰 Pricing
[ $300 / Month to $1,200+ / Month, scaling with order volume ]
1.4 Lifetimely by AMP [toc=1.4 Lifetimely by AMP]
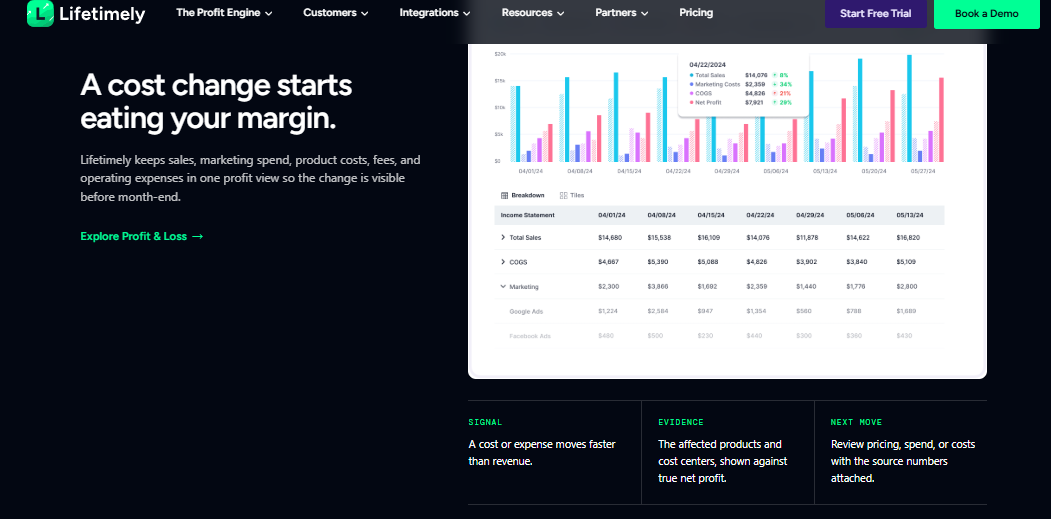
Lifetimely surfaces cost changes against true net profit before month-end closes on you
🔍 Why Did We Choose This Tool?
Lifetimely earns its spot on one metric that most reporting tools treat as an afterthought. It shows lifetime value by cohort, so you can see whether last quarter's customers actually pay you back.
✅ The profit-and-loss view is usable by a founder with no finance background. ❌ Ad-platform depth is thin, and there is no real anomaly monitoring. Treat it as a retention lens, not a full reporting system, and check Lifetimely alternatives if you need more.
⚙️ Solutions Offered
LTV and cohort reporting by acquisition month and channel
Profit-and-loss dashboard with COGS and fee inputs
Payback-period tracking for paid acquisition
Daily and weekly email digests
Product and customer-level profit views
📊 Core Reporting Metrics
Data layers covered: Commerce, ads, and email
Native connectors: Core Shopify, Meta, Google, and Klaviyo set
Repeat-purchase brands in supplements, skincare, or coffee
Small teams needing a simple profit view without a warehouse
⏰ One Honest Limitation
Report depth stops well short of custom analysis. You will still export to a sheet for anything unusual.
💰 Pricing
[ $0 / Month to $149 / Month, scaling with order volume ]
1.5 Peel Insights [toc=1.5 Peel Insights]
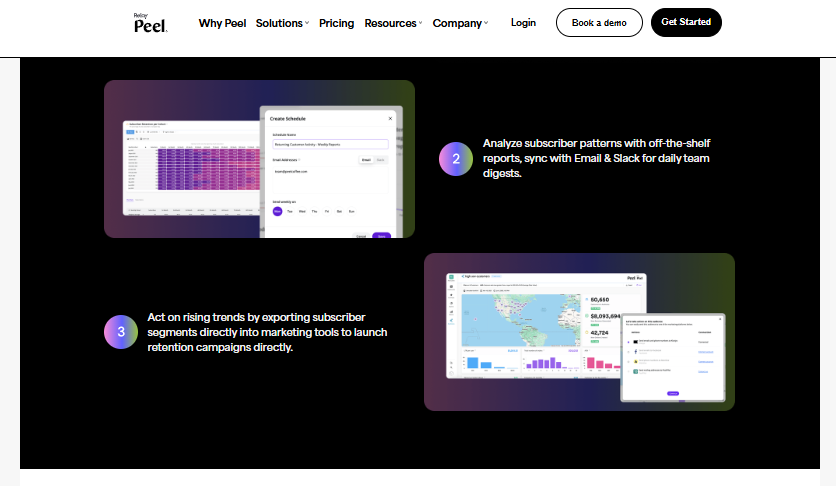
Peel Insights schedules cohort and retention reports into daily email and Slack digests
🔍 Why Did We Choose This Tool?
Peel is built around one question that decides most DTC outcomes. Are customers coming back, and at what rate? Its retention and cohort reporting runs automatically once connected.
✅ The retention analysis is deeper than what most all-in-one tools ship. ❌ Marketing and finance coverage is limited, so it works best alongside another tool. That stacking cost is real money each month.
⚙️ Solutions Offered
Automated retention and repeat-purchase reporting
Cohort trend analysis across time and product
Product affinity and reorder-interval views
Metric change flags on tracked cohorts
Scheduled email reporting
📊 Core Reporting Metrics
Data layers covered: Commerce and customer data
Native connectors: Shopify plus a small marketing set
Automated narratives: Limited to metric change callouts
You will likely pay for a second tool to cover ads and finance. Budget for the stack, not the line item.
💰 Pricing
[ $149 / Month to $999+ / Month, scaling with order volume ]
1.6 Daasity [toc=1.6 Daasity]
🔍 Why Did We Choose This Tool?
Daasity is the honest answer when your data genuinely needs a warehouse. It runs managed pipelines into BigQuery or Snowflake, then layers BI templates on top for ecommerce, wholesale, and Amazon.
✅ Multi-channel coverage is the strongest on this list for hybrid brands. ❌ You need someone who can think in data models, and reporting sits in a BI tool rather than in plain English. Operators say this out loud in public threads, and many end up weighing Daasity alternatives.
⚙️ Solutions Offered
Managed ELT pipelines into a cloud data warehouse
Prebuilt ecommerce, retail, and wholesale data models
BI dashboard templates for Looker, Tableau, and Sigma
Multi-channel consolidation across DTC, Amazon, and wholesale
Scheduled report distribution
📊 Core Reporting Metrics
Data layers covered: Commerce, ads, wholesale, marketplace, and ops
Native connectors: 60+ sources including marketplaces
Automated narratives: No, analysis happens in your BI layer
Scheduled digests and alerts: Yes, via the connected BI tool
Time to first insight: Two to six weeks of implementation
Companies committed to owning their warehouse long term
💬 Reviews
"Data Studio (Looker) with GA4 connector. Start there." — Verified User, r/ecommerce Reddit Thread
⏰ One Honest Limitation
Implementation time is the real cost. If nobody on your team owns data, the warehouse becomes shelfware.
💰 Pricing
[ Custom, typically $1,000+ / Month ]
1.7 Report Pundit [toc=1.7 Report Pundit]
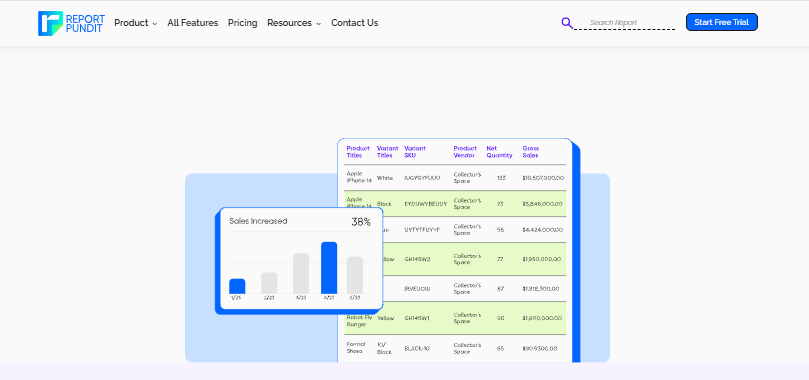
Report Pundit builds granular Shopify exports down to variant SKU, quantity and gross sales
🔍 Why Did We Choose This Tool?
Report Pundit is the cheapest way to get a specific Shopify report that Shopify itself will not give you. It ships thousands of prebuilt reports and will build custom ones on request.
✅ Price to value is excellent for pure export work. ❌ There is no reasoning layer, so it answers what happened and never why. Merchants use it as plumbing, not intelligence.
⚙️ Solutions Offered
2,000+ prebuilt Shopify reports across orders, products, and customers
Scheduled exports to email, Google Sheets, FTP, and Drive
Multi-store and multi-currency reporting
Metafield and tag-level reporting
📊 Core Reporting Metrics
Data layers covered: Commerce data only, plus limited ads
Native connectors: Shopify plus a small set of marketing sources
Automated narratives: No
Scheduled digests and alerts: Yes, scheduled exports
Time to first insight: Within an hour of install
✅ Best For
Merchants needing exact order, tax, or inventory exports
Ops teams automating recurring reports into Sheets
Stores under $1M revenue watching software spend
⏰ One Honest Limitation
Scheduled exports do occasionally break quietly. Build a habit of checking that the file actually arrived.
💰 Pricing
[ $9 / Month to $35+ / Month ]
1.8 Better Reports [toc=1.8 Better Reports]
🔍 Why Did We Choose This Tool?
Better Reports covers the same job as Report Pundit with a stronger custom report builder. You define fields, filters, and calculated columns, then schedule the output.
✅ Flexibility on custom Shopify fields is its real strength. ❌ Like its peer, it reports and does not reason. Nothing here monitors your business while you sleep.
⚙️ Solutions Offered
Custom Shopify report builder with calculated fields
60+ prebuilt report templates
Scheduled delivery to email and Google Sheets
Multi-store reporting on higher tiers
Metafield and line-item level detail
📊 Core Reporting Metrics
Data layers covered: Commerce data only
Native connectors: Shopify native
Automated narratives: No
Scheduled digests and alerts: Yes, email and Sheets
Time to first insight: Same day
✅ Best For
Finance and ops teams needing precise recurring exports as part of wider Shopify reporting
Merchants with complex variant or metafield structures
Stores wanting reporting without a monthly platform fee
⏰ One Honest Limitation
Building the first few custom reports takes patience. Expect an afternoon of setup, not five minutes.
💰 Pricing
[ $19.90 / Month to $299 / Month ]
1.9 Improvado [toc=1.9 Improvado]
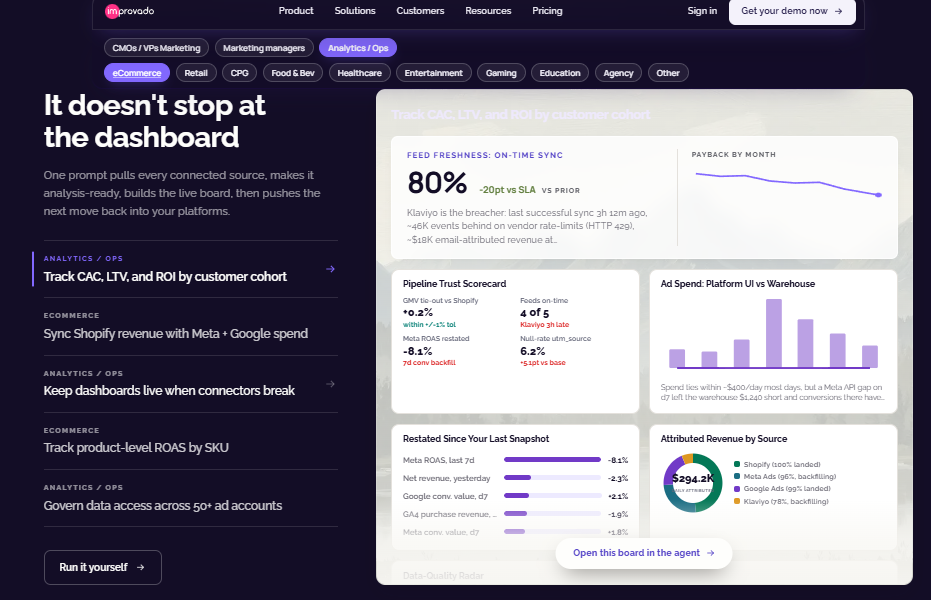
Improvado flags late feeds, restated ROAS and attribution gaps on one governed board
🔍 Why Did We Choose This Tool?
Improvado belongs here for brands with serious marketing complexity. It pulls from hundreds of platforms, transforms the data, and pushes clean tables into your warehouse or BI tool.
✅ Connector breadth and transformation power are enterprise grade. ❌ Verified reviewers describe a steep learning curve and inconsistent delivery depending on settings. It is a data engineering platform wearing a reporting label, closer to the reverse ETL tools category than to conversational reporting.
⚙️ Solutions Offered
500+ marketing and sales data connectors
Data transformation and normalization before load
Warehouse and BI delivery to BigQuery, Snowflake, and Looker
Governance controls and naming-convention enforcement
AI agent layer for querying prepared datasets
📊 Core Reporting Metrics
Data layers covered: Ads, CRM, commerce, and web
Native connectors: 500+ sources
Automated narratives: Yes, on governed datasets
Scheduled digests and alerts: Yes, via connected BI tools
Time to first insight: Four to twelve weeks of implementation
"The easines with which we can set data extractions from different platforms. That users can be onboarded easily. Good customer suppor when tickets are created. Too much push for AI. Inconsistent data delivery based on the settings selected. Lack of reporting / status information for data extractions." — Verified User, 4/5 Improvado G2 Verified Review
"There is a steep learning curve, and if you aren't familiar with databases, Excel, and data transformations, this could be a really tough software to implement. I'm having this issue myself, where I am currently the only person who knows how to use Improvado within my team, and getting my teammates onboarded is a lot of work." — Verified User, 3.5/5 Improvado G2 Verified Review
⏰ One Honest Limitation
Single-person dependency is the risk reviewers name most. If one person owns the platform, your reporting has one point of failure.
💰 Pricing
[ Custom, typically $2,000+ / Month ]
1.10 Whatagraph [toc=1.10 Whatagraph]
🔍 Why Did We Choose This Tool?
Whatagraph is the strongest option here if you report to other people for a living. It pulls multi-source data into white-label templates and schedules the delivery automatically.
✅ Client reporting workflow and template control are excellent. ❌ It is built for agencies, not single brands, and there is no commerce or finance depth. A €699 entry point is steep for one store.
⚙️ Solutions Offered
Multi-source data blending across ads, web, and email
White-label report templates with brand controls
AI summaries on report widgets
Automated report delivery on a set cadence
Warehouse transfer for raw data access
📊 Core Reporting Metrics
Data layers covered: Ads, web, email, and social
Native connectors: 55+ marketing platforms
Automated narratives: Yes, widget-level AI summaries
Scheduled digests and alerts: Yes, automated report sends
Time to first insight: Two to five days of template setup
✅ Best For
Agencies reporting to five or more clients monthly
In-house marketing teams reporting upward to leadership
Ecommerce specifics like COGS, refunds, and inventory are not its territory. You will need a second tool for profit reporting.
💰 Pricing
[ €699 / Month to €1,500+ / Month ]
📌 The Verdict by Brand Stage
Under $1M in revenue, start with Report Pundit or Better Reports and keep your cash in inventory. Between $1M and $5M with data spread across Shopify, ads, and accounting, a reasoning layer pays for itself faster than another dashboard. Above $10M with wholesale or Amazon in the mix, budget for Daasity or Improvado plus someone to own it.
Luca AI sits at the front of this list for one reason worth checking yourself. Luca AI normalizes every connected source at ingestion, so a question about margin reaches ads, refunds, fees, and accounting in a single answer. Most tools here report one layer well. That gap is the whole reason we built it, and you can see how Luca thinks before you commit to anything.
Q2. How Did We Score and Rank These AI Reporting Tools? [toc=2. Scoring Methodology]
Every tool on this list was scored across five weighted criteria: Reasoning Depth (25%), E-commerce Data Coverage (25%), Time to First Trustworthy Insight (20%), Pricing Transparency (15%), and Verified User Reviews (15%). Tools earn one star at the bottom band and five stars at the top. Luca AI holds five stars because the rubric rewards data breadth and reasoning, not time in market.
⭐ The Five Criteria and the Test Behind Each
Scoring Criteria and Weights for AI Reporting Tools
Criterion
Weight
What We Actually Tested
Reasoning Depth
25%
Can it find a root cause and model an alternative, or only chart the past?
E-commerce Data Coverage
25%
Does it read orders, refunds, COGS (cost of goods sold), fees, and inventory?
Time to First Trustworthy Insight
20%
How long until a number is safe to act on?
Pricing Transparency
15%
Is real pricing published, or hidden behind a call?
Verified User Reviews
15%
What do G2 and Trustpilot reviewers report, good and bad?
I published this before the rankings for a reason. You may weight things differently, and you should. If attribution is your only problem, move Reasoning Depth down and Data Coverage up.
📊 Why Reasoning Depth Beats Feature Count
Feature lists are easy to pad. A tool can ship an "AI insights" button that writes one sentence about a chart you already read.
Reasoning depth is harder to fake. It means asking why margin fell and getting the influencing components ranked. Luca AI measures this by testing whether a single question reaches ads, refunds, fees, and accounting in one answer, which is the standard we hold agentic analytics tools to.
⏰ The Criterion Nobody Publishes
Time to first trustworthy insight is the one buyers feel hardest. Pixel-based tools often need two to three weeks before the numbers settle. You pay for that window either way.
App-tier reporting on order data alone can be useful within a day. Warehouse projects like Daasity run four to twelve weeks. Budget the calendar, not just the invoice, before you rebuild your e-commerce tech stack.
💬 Why Verified Reviews Carry Real Weight
Reviewers name the failures vendors never mention. Two examples shaped how I scored data reliability.
"Very useful for top down view for a very fast reporting. Supports and tracks many different platforms as well. almost a no brainer for pulling out stats quickly. However, some stats are not so accurate in pulling in data; they do not tally with shopify" — Verified User, 4/5 Triple Whale G2 Verified Review
"Too much push for AI. Inconsistent data delivery based on the settings selected. Lack of reporting / status information for data extractions." — Verified User, 4/5 Improvado G2 Verified Review
Dashboard looks got zero weight. A prettier browser view is a courtesy, not the substance of the answer.
Raw connector counts also got no credit on their own. Five hundred marketing connectors do not help if none of them reads your refunds or landed cost, which is the gap most ecommerce analytics platforms leave open.
Luca AI holds its position here on data breadth and reasoning, and it loses points on review volume as a newer entrant. That trade is honest, and I would rather show it than hide it.
Q3. What Is AI Reporting Software, and What Should It Actually Compute for an Online Store? [toc=3. What It Is]
AI reporting software connects your data sources, analyses them automatically, and delivers the conclusion in words. You get narratives explaining what changed, scheduled digests, and alerts when a metric breaks its baseline. For a store, the real test is whether it computes fully burdened contribution margin per SKU, not just the gross margin Shopify already shows you.
🧠 From Showing to Recommending
A dashboard is descriptive. It shows what happened and leaves you to work out why.
AI reporting is meant to be prescriptive. It names the cause and the next action. That shift from monitoring to recommending is the whole point of decision intelligence tools, and most tools have not made it yet.
🔎 The Three-Question AI-Washing Test
Independent testing of nine reporting tools in 2026 found most had simply added an AI label to existing features. Only three genuinely automated analysis. Use these three questions on any demo.
Can it answer why a metric moved, not just that it moved?
Can it reach data outside marketing, like refunds, fees, and accounting?
Can it model an alternative, such as cutting your bottom ten SKUs?
Luca AI passes the second question by reading accounting and payment data alongside orders, which is where shipping, fees, and support costs actually live. That breadth is what separates real ecommerce data integration from a connector list.
💸 The Invoice That Ended a Scaling Plan
A founder once slid an invoice across the table at me. Her bestseller showed 72% gross margin, and she could not make them fast enough.
We pulled her P&L, shipping data, return rates, and support tickets. Twenty minutes later, the real contribution margin on that product came in at 8%. She had scaled a product that barely broke even, and the data was in her systems the whole time.
📊 What Gross Margin Hides
Cost Lines That Gross Margin Leaves Out
Cost Line
Where It Lives
Why Reports Miss It
Landed cost and duties
Supplier invoices, accounting
Rarely mapped per variant
Outbound shipping
3PL or carrier bills
Averaged, not allocated
Returns and refunds
Shopify plus payment processor
Netted at store level
Payment and platform fees
Stripe, Shopify Payments
Sits outside analytics tools
Support cost per unit
Helpdesk tickets
Almost never allocated
One practitioner framework allocates helpdesk cost directly to SKUs. In one case, a single product drove 42% of all support tickets, which worked out to $1.45 per unit. That line alone can flip a product from profitable to negative, which is the heart of the contribution margin versus gross margin problem.
✅ What a Real Ecommerce Report Must Compute
Fully burdened contribution margin by SKU and variant
Cohort retention and payback period by acquisition month
Inventory-adjusted cash position, not just revenue
Storefront speed, since a one second delay can cut conversions by 7%
Merchant reviews keep pointing at the same gap. Numbers that do not reconcile with Shopify are the most common complaint in this category.
"Its very easy to use and works good for a multichannel solution. Sometimes it does not update the numbers correctly and has errors with synchronisation." — Verified User, 3/5 Triple Whale G2 Verified Review
⏰ Your Monday Action
Pick your top five SKUs by revenue. Build the burdened margin view for those five only, using the cost table above. That single exercise usually reveals more than a month of ecommerce profit margin guesswork.
Luca AI reads accounting, payment, and order data in one normalized model, so the fee and refund lines land inside the margin number. Gross margin tells you what it costs to make the thing. It tells you nothing about what it costs to sell it.
Q4. Automated Narratives, Scheduled Digests and Anomaly Alerts: Which Do You Actually Need? [toc=4. Three Core Mechanics]
Automated narratives explain why a metric moved. Scheduled digests deliver a fixed metric set on a cadence. Anomaly alerts fire only when a metric breaches its baseline. Founders need alerts, Heads of Growth need narratives, and finance leads need digests. Luca AI runs all three from one scan, though most tools ship one properly and market the other two.
📊 The Three Mechanics Side by Side
Automated Narratives, Scheduled Digests, and Anomaly Alerts Compared
Mechanic
What It Does
When It Fires
Failure Mode
Automated narrative
Explains the cause behind a change
On request or with a report
Restates the chart without a cause
Scheduled digest
Sends a fixed metric set
Daily, weekly, or monthly
Arrives after the decision was made
Anomaly alert
Flags a breach of baseline
Continuously, on breach
Fires constantly, so you mute it
👥 Which Role Needs Which
Founders need alerts, because they cannot watch dashboards all day
Heads of Growth need narratives, because they must explain channel swings
Finance leads need digests, because cash reporting runs on a calendar
Ops managers need alerts on stock and fulfilment, not on ROAS
Ask Luca AI for a weekly CAC report with charts and reasoning across Meta and Google spend, and that lands as a digest with a narrative attached. That is what automated ecommerce reporting should feel like in practice.
⏰ Routing and Cadence Rules
Route alerts to Slack and digests to email. Alerts need speed, digests need a place to sit and be read.
Your weekly digest must land before your Monday standup, not during it. A report that arrives Monday afternoon is a record, not a decision tool. With median blended CAC climbing across DTC brands, five days of latency is real money.
⚠️ The Packaging Problem Nobody Warns You About
One operator ran five cohort analyses through an AI coding tool and ended up with roughly twenty executive summaries, each about 25 pages long. His reaction was blunt. He had no idea how to actually use any of it.
Constraint is the feature here. A 25 page auto-generated summary is worse than no report, because nobody opens it twice. Luca AI handles this with cohort-level vigilance and no cohort-level dashboard to wade through.
💬 What Operators Say About Report Depth
"Not being able to pull out the daily stats/ metrics to analyse in Excel. I would have liked to go deeper to see how it does on a daily basis or create my own custom reports." — Verified User, 4/5 Triple Whale G2 Verified Review
"Data Studio (Looker) with GA4 connector. Start there." — Verified User, r/ecommerce Reddit Thread
💰 The Combination We Recommend by Revenue Band
Under $1M: one weekly digest, plus a stockout alert. Nothing more.
$1M to $5M: weekly digest, daily anomaly alerts on CAC and ROAS, narratives on request.
Above $5M: daily digests by function, standard-deviation alerts, and monthly narrative reviews.
Luca AI scans connected data around the clock and pings you when outliers appear, such as a ROAS dip, a CAC spike, or inventory falling below threshold. The alert arrives with reasoning, so the first question after the ping is already answered. You can see the plans and pricing if you want to test that on your own numbers.
Q5. How Do You Configure Alerts and Trust the Output? [toc=5. Thresholds and Accuracy]
Set thresholds against a rolling baseline plus a tolerance band, never a fixed percentage. With 2025 CPMs at $14.19 and up 20% year over year, a static "+15% CPM" rule fires constantly. Use median ROAS of 1.86, MER of 0.49, and a conversion rate range of 1.70% to 2.69% as starting baselines. Luca AI supports standard-deviation alerting on any KPI for exactly this reason.
❌ Why Fixed-Percentage Alerts Fail
A percentage rule assumes the market stands still. It does not. Cost per thousand impressions rose 20.03% across 2025, so last year's threshold is this year's noise.
You end up muting the alert. Then you miss the one that mattered. That is how most alert systems die, and it is why ecommerce monitoring tools live or die on threshold design.
Median blended CAC is projected at $58 by Q3 2026, up from $44 a year earlier. That is a 32% climb across 6,800 Shopify brands. Latency in reporting now costs measurably more than it did last year, which is why your top ecommerce KPIs need live baselines.
⏰ The Five-Step Threshold Recipe
Pick a rolling baseline window of 28 days, not last month.
Set the tolerance band at two standard deviations from that baseline.
Widen the band by 30% during your known seasonal peaks.
Require the breach to hold for two consecutive days before firing.
Attach one required context field, such as spend or units sold.
Ask Luca AI for an alert phrased as "two or more standard deviations from rolling baseline" rather than a percentage that ages badly.
💸 A Worked Example on One SKU
Take a $60 product converting at 2.0% with a 28 day baseline. A drop to 1.75% sits inside normal weekly variance for most stores.
A drop to 1.4% held over two days is a real signal. Check page speed first, since a one second delay in load time can cut conversions by 7%, and confirm the drop in your ecommerce conversion tracking before you touch spend.
⚠️ Why Narratives Inherit the Error Beneath Them
Attribution match rates for Meta run roughly 70% to 85% on iOS-heavy audiences, per practitioner reports. Your alert is therefore directional, not absolute.
Retail calendars make this worse. Brands report on invoice sales or demand sales, and on 5-4-4 or 4-4-5 week structures. If those are not normalized first, your comparisons are wrong before the AI reads them, which is the case for disciplined ecommerce data management.
"The free version is not reliable - Google even says though themselves in their privacy policy. "Sessions" are a vague statistic that do not help define the quality/quantity of your web traffic." — Verified User in Marketing and Advertising, 0.5/5 Google Analytics G2 Verified Review
"The syncing of data is not very reliable. Even though its the same format but a different date." — Verified User, 1.5/5 Supermetrics G2 Verified Review
✅ The Two Alerts I Would Keep
Keep a contribution margin alert and a stockout alert. Everything else is optional at sub-$5M revenue.
Luca AI normalizes and standardizes data at ingestion, which is what lets an alert carry its cause alongside the number. A ROAS ping that arrives with the influencing components attached saves the twenty minutes you would otherwise spend hunting.
Q6. What Does AI Reporting Software Cost, and Which Tier Fits Your Stage? [toc=6. Pricing and Fit]
Shopify reporting apps run from free to about $49 per month. Ecommerce analytics platforms sit at $100 to $500 per month and usually scale with order volume. Agency reporting tools run $59 to $229 per month, governed data platforms start near €699, and enterprise BI is quote only. Luca AI starts at €299 per month for a single reasoning layer across all connected sources.
💰 What Each Tier Actually Costs
Entry Pricing Across the Ten AI Reporting Tools
Tool
Entry Price
What Scales the Bill
Report Pundit
$9 / month
Report volume and stores
Better Reports
$19.90 / month
Report count and stores
Lifetimely by AMP
$0 / month
Monthly order volume
Peel Insights
$149 / month
Order volume
Triple Whale
$129 / month
Ad spend and order volume
Luca AI
€299 / month
Plan tier, not per dashboard
Polar Analytics
$300 / month
Order volume and seats
Whatagraph
€699 / month
Data sources and users
Daasity
Custom, from ~$1,000 / month
Channels and warehouse usage
Improvado
Custom, from ~$2,000 / month
Connectors and data volume
Watch the add-ons. Several tools sell AI summaries separately, per dashboard, on top of the base plan.
📊 Cost Per Delivered Report
Take a brand doing 3,000 orders a month. A $300 platform sending four weekly digests plus a monthly review delivers about five reports monthly.
That is roughly $60 per report. Compare that to the hours you currently spend stitching sheets together, and to what proper ecommerce reporting is worth to you each week.
💸 The Real Benchmark Is Headcount
One multi-market operator described running one and a half full-time analysts just to scrape, clean, and map sheets from different systems. It was still hard.
That is €60,000 or more in salary against a few hundred euros a month in software. Luca AI is positioned as a replacement for a junior ecommerce data analyst, which is the comparison I would actually run.
⭐ The Stage Map
Under $1M revenue: Report Pundit or Better Reports. Keep the cash in inventory.
$1M to $5M with data in Shopify, ads, and accounting: a reasoning layer earns its fee.
$5M to $10M with heavy paid spend: add attribution depth alongside reporting.
Above $10M with wholesale or Amazon: budget for a warehouse plus an owner.
👥 Role Fit and the Agency Mismatch
Agency-built tools optimize for many clients, not one brand. You pay for white-label templates and seat management you will never use.
Founders and finance leads need cross-functional answers. Growth leads need channel depth. Ops managers need stock and fulfilment alerts, not report styling, which is where ecommerce inventory management data earns its place in the stack.
"They also consistently removed data features and kept the price the same." — Verified User, 0/5 Supermetrics G2 Verified Review
✅ What to Negotiate
Ask for order-volume headroom, not a discount. Overage charges are where these bills surprise people.
Luca AI is priced for single-brand operators between roughly €1M and €5M who run eight to twelve disconnected tools. Below that, honestly, a $19 report app plus discipline will serve you better.
Q7. Where Does AI Reporting Break, and How Long Until You Can Trust a Report? [toc=7. Setup Time and Failure Modes]
Expect 24 to 48 hours for app-tier reporting on order data alone. Allow one to two weeks once ad platforms and accounting connect. Pixel-based attribution needs two to three weeks before it is calibrated enough to trust. Luca AI standardizes every source at ingestion, which removes the data-cleanup phase most buyers discover only after signing.
⏰ Setup Time by Tool Type
Time to First Trustworthy Insight by Tool Type
Tool Type
Time to First Trustworthy Insight
Shopify report apps
Under one hour
Profit and LTV apps
Same day, after COGS input
Reasoning layers
Minutes to connect, days to tune
Pixel-based attribution
Two to three weeks of calibration
Warehouse platforms
Four to twelve weeks
Agency operators have reported clients needing two to three weeks before pixel data was trustworthy. You pay for that window regardless.
🧩 What Actually Eats the Time
Cost of goods mapping is the usual culprit. Someone has to attach landed cost to every variant, and nobody enjoys it.
Schema mismatches follow. One retail data lead described the mess of brands reporting invoice sales versus demand sales, on 5-4-4 or 4-4-5 week calendars, with nothing standard across them. Clean ecommerce data collection upfront is what shortens this phase.
🧠 The PhD On Their First Day
Think of AI reporting as hiring a PhD in every domain. Brilliant, and completely ignorant of your business on day one.
Tell that person to write the email with no context and they will fail. Luca AI carries persistent business memory across sessions, but you still need to load your commercial rules first. Nothing here works out of the box.
❌ Four Failure Modes and Their Fixes
Silent export breakage: scheduled files stop arriving. Fix by checking the file, not the setting.
Built-in vertical AI: one operator called their inventory system's own AI forecasting rubbish and stopped after six months. Fix by extracting clean data into a general reasoning engine.
Connector drift: reviewers report connectors that break or lag behind platform changes. Fix by reconciling one number against source weekly.
Context-blind chatbots: without back-end plumbing, they produce confident nonsense. Fix by testing on a question you already know the answer to, a rule worth applying when evaluating AI data agents.
💬 What Reviewers Report
"There is a steep learning curve, and if you aren't familiar with databases, Excel, and data transformations, this could be a really tough software to implement. I'm having this issue myself, where I am currently the only person who knows how to use Improvado within my team." — Verified User, 3.5/5 Improvado G2 Verified Review
"1. The tool promises a robust series of direct connectors; however, the connectors rarely update without breaking." — Verified User, 0/5 Supermetrics G2 Verified Review
⚠️ Two Rules I Will Not Bend
Never let AI be the final approver on anything a customer sees. One premium bike brand published a product image with the derailleur mounted on the wrong wheel. Keep the human sign-off.
Never paste sales or customer data into a free AI tier. Paid, API-driven workspaces keep your transaction data out of public training sets.
✅ Your Five-Day Onboarding Checklist
Day one: connect commerce and payments only.
Day two: load landed cost and fees per variant.
Day three: connect ad platforms and reconcile one week manually.
Day four: connect accounting and set your fiscal calendar.
Day five: set two alerts and one weekly digest. Stop there.
Luca AI gates autonomous action by confidence level, so reporting runs unattended while anything customer-facing waits for your approval. My honest question heading into 2027 is how much autonomy operators will actually hand over once the reporting proves itself. If you run this checklist, tell me where it broke. That is the part I still want to learn.
FAQ's
What is AI reporting software and how is it different from a dashboard?
AI reporting software connects your data sources, analyses them automatically, and delivers the conclusion in words rather than charts. A dashboard is descriptive. It shows what happened and leaves the interpretation to you.
Real AI reporting is prescriptive. It names the cause and the next action. The three mechanics that matter are:
Automated narratives that explain why a metric moved
Scheduled digests that deliver a fixed metric set on a cadence
Anomaly alerts that fire only when a metric breaches its baseline
Luca AI treats visualizations as a courtesy rather than the substance, because the data goes to the reasoning layer first and what reaches you is the conclusion. We built it that way after watching founders spend Monday mornings stitching Shopify, Meta, and Xero numbers together by hand.
The practical test for any vendor is simple. Ask whether the tool can answer why margin fell, not just that it fell. If the answer is a chart, you have bought a dashboard with a summarize button. If you want the longer explanation of the category shift, our guide to automated ecommerce reporting walks through what changes when reports start reasoning.
How much does AI reporting software cost for an ecommerce brand?
Pricing splits into four clear tiers, and the tier you need depends on revenue and data spread rather than headcount.
Shopify report apps: $9 to $49 per month, covering exports and custom order reports
Profit and LTV apps: free to $149 per month, scaling with order volume
Ecommerce analytics platforms: $129 to $500 per month, scaling with ad spend and orders
Agency and enterprise pipelines: €699 to $2,000 or more per month
Luca AI starts at €299 per month for a single reasoning layer across commerce, ads, accounting, and operations data, priced by plan tier rather than per dashboard or per seat. That matters because several tools in this category sell AI summaries separately, per dashboard, on top of the base plan.
The comparison we would actually run is against headcount. One multi-market operator described running one and a half full-time analysts just to scrape, clean, and map sheets from different systems, and it was still hard. That is €60,000 or more in salary against a few hundred euros a month in software.
Below roughly €1M in revenue, honestly, a $19 report app plus discipline serves you better. You can compare tiers on our pricing page before you commit.
Do AI reporting tools detect anomalies automatically, and can you trust the alerts?
Yes, but precision varies enormously, and the difference comes down to how the threshold is set rather than how clever the model is.
Fixed-percentage rules fail because the market moves. Cost per thousand impressions rose 20.03% across 2025 to $14.19, so a static "+15% CPM" alert fires constantly until you mute it. Then you miss the one that mattered.
Use these baselines as your starting point:
Median ROAS of 1.86 and MER of 0.49 across roughly 35,000 ad accounts
Conversion rate between 1.70% and 2.69%, depending on the dataset
Median blended CAC projected at $58 by Q3 2026, up from $44
Luca AI supports standard-deviation alerting on any KPI, so a threshold reads "two or more standard deviations from a rolling 28 day baseline" instead of a percentage that ages badly. We also require the breach to hold before the ping goes out.
One honest caveat. Attribution match rates for Meta run roughly 70% to 85% on iOS-heavy audiences, so alerts are directional, not absolute. Narratives inherit the error of the data beneath them. Our breakdown of platform ROAS versus true profitability covers why that gap matters.
Which metrics should AI reporting software compute for an online store?
The test that separates useful reporting from decoration is whether the tool computes fully burdened contribution margin per SKU, not just the gross margin Shopify already shows you.
Gross margin quietly ignores five cost lines:
Landed cost and duties, rarely mapped per variant
Outbound shipping, usually averaged rather than allocated
Returns and refunds, netted at store level
Payment and platform fees, sitting outside most analytics tools
Support cost per unit, almost never allocated at all
That last line is the one operators underestimate. In one teardown, a single product drove 42% of all support tickets, which worked out to $1.45 per unit and flipped the SKU from profitable to negative.
Beyond margin, a genuine ecommerce report should compute cohort retention and payback period by acquisition month, inventory-adjusted cash position rather than revenue, and storefront speed, since a one second delay in load time can cut conversions by 7%.
Luca AI reads accounting, payment, and order data in one normalized model, so fee and refund lines land inside the margin number instead of a system the report never opens. If you want the underlying method, our explainer on contribution margin versus gross margin shows the full cost stack.
How long does it take before an AI reporting tool produces a report you can trust?
Expect 24 to 48 hours for app-tier reporting on order data alone. Allow one to two weeks once ad platforms and accounting connect. Pixel-based attribution needs two to three weeks before it is calibrated enough to trust, and warehouse platforms run four to twelve weeks.
What actually consumes the time is rarely the software:
Cost of goods mapping, attaching landed cost to every variant
Schema mismatches between invoice sales and demand sales
Non-standard retail calendars running 5-4-4 or 4-4-5 week structures
Luca AI normalizes and standardizes data at ingestion, which removes the data-cleanup phase most buyers only discover after signing the contract. We still recommend loading your commercial rules before you trust the first output, because an AI reporting system is a brilliant new hire who knows nothing about your business on day one.
Budget the calendar, not just the invoice. Agency operators have reported clients paying for two to three weeks of a platform they could not yet use. Watch for silent export breakage and connector drift too, since both show up repeatedly in verified merchant reviews. Our notes on evaluating AI data agents list the tests worth running during a trial.
Enjoyed the read? Join our team for a quick 15-minute chat — no pitch, just a real conversation on how we’re rethinking Ecommerce with AI - Luca
Loading Schedule...
Your AI Co-Founder is here.
Here’s why:
Shopify, Meta, Xero - one brain.
"Should I scale?" Answered with real data.
Growth capital. No applications. One click.
Thank you! Your submission has been received! Please book a time slot for the Meeting
Oops! Something went wrong while submitting the form.