Shopify Reporting Dashboard Deep Dive: Setup, Custom Reports, Attribution, Inventory, and Finance Workflows
13
mins read
TL;DR
The Shopify reporting dashboard handles single-axis questions well but breaks on cross-source queries spanning Meta, Klaviyo, and Xero. Eight KPIs deserve front-of-dashboard space: net sales, AOV, conversion rate, repeat rate, CLTV, contribution margin, CAC payback, and cash conversion cycle. ShopifyQL and Sidekick AI cover roughly 80% of single-source descriptive questions, but predictive and root-cause work needs a reasoning layer. Triple Whale, Polar, Lifetimely, TrueProfit, and Report Pundit each own one slice; only a reasoning layer answers cross-source questions. Capital partners should be scored on APR, disbursal speed, term flexibility, and personal guarantees, not just on approval time.
Q1: What Is the Shopify Reporting Dashboard and Why Do Scaling Founders Outgrow It? [toc=1. Dashboard Basics]
The Shopify reporting dashboard is the Analytics page in Shopify admin where customizable metric cards display sales, sessions, conversion, and fulfillment in near real-time, with deeper drill-downs in Reports and natural-language queries via ShopifyQL and Sidekick AI. It handles single-axis questions well. It breaks on two-dimensional questions like product, channel, and repeat rate, forcing operators to export to Sheets or layer a reasoning engine on top.
The 11pm CSV Ritual Nobody Talks About
Here is the scene I see every week. It is Sunday night. The founder opens Shopify Analytics, then Meta Ads Manager, then Klaviyo, then a Google Sheet with 47 tabs.
Three hours later, they still cannot answer one question. Which product, on which channel, brought in the most repeat buyers in Q4? CAC (customer acquisition cost) is rising, and they cannot say where.
Why This Pattern Repeats
The native dashboard was not built for cross-silo questions. It was built for store health checks. That is a real difference, not a marketing line.
A 2025 r/shopify thread put it bluntly. Operators reported the dashboard "moved daily analytics to hourly snapshots overnight" with no rollback option. ⚠️ Trust in the surface itself is fragile.
The Rear-View Mirror Trap
Native metric cards are rear-view mirrors. They show what already happened. They do not tell you why or what to do next.
A dashboard is "historical noise" until it leads to a "reasoning-backed action." Most founders treat the dashboard as the destination. The high-growth ones treat it as the starting point.
What Native Reports Actually Cover
"I export to Sheets every Sunday. Shopify just doesn't answer the questions I actually have." u/Sufficient_Sky_2683, r/shopify Reddit Thread
That comment is from October 2025. The thread has hundreds of upvotes. It is the modal experience for any store past $1M GMV.
From BI to Reasoning Engines
The shift happening across DTC right now is from BI tools to reasoning engines layered over a data warehouse. Looker shows you a chart. A reasoning engine answers a question.
It can extract the relevant slice from a pool of data, predict based on history, simulate "what if I cut this SKU," and root-cause an outlier across sources. ✅ That is the architectural jump.
Where Luca Fits
We built Luca as an AI layer over a data warehouse. It connects Shopify, Meta, Google, Klaviyo, and Xero into one source of truth. Then it reasons across them in plain English.
Ask "why did MER drop last week," and Luca traces it to creative fatigue on one campaign, a Meta CPM spike in a single zip code, or a stockout on the SKU that drove repeat orders. The dashboard tells you ROAS dropped. A reasoning layer tells you which SKU, channel, and cohort combination caused it.
The Use-Case Payoff
"Most analytics tools show me what happened. Luca tells me why and what to do next." Verified Luca user, Shopify App Store Luca Verified Review
That is the move from visualization to reasoning. Native Shopify is necessary, not sufficient.
Q2: How Do You Set Up, Customize, and Future-Proof the Shopify Analytics Dashboard? [toc=2. Setup and Customization]
Open Shopify admin, then Analytics, then Dashboards. Use "Customize" to add metric cards (sales, sessions, AOV, conversion rate), group them into sections (Acquisition, Behavior, Finance), pin Live View, and set targets so variance flags automatically. Then mirror the same KPIs into a Sheet or BI view. Shopify ships breaking dashboard changes (the Dec 2024 daily to hourly rollup overnight) without warning, and a mirror keeps weekly ops reviews resilient.
The 7-Step Setup That Actually Holds Up
Most setup guides tell you to "customize your dashboard." That is not a step. It is a label. Here are the seven moves that matter.
Steps 1 to 3: Cards, Sections, Targets
Step 1. Pin the right metric cards. Sales, sessions, AOV (average order value), conversion rate, returning customer rate, and gross margin. Drop the vanity ones like "social referrals" unless you actively run organic social.
Step 2. Group cards into sections. ⭐ Use three: Acquisition, Behavior, and Finance. This mirrors how a founder, a Head of Growth, and a CFO read the dashboard differently.
Step 3. Set targets on every card. Shopify lets you define a target so variance flags automatically. No target means no signal, just numbers floating in space.
Steps 4 to 5: Live View and Permissions
Step 4. Pin Live View for launch days. Live View shows real-time sessions and orders. ⏰ It is invaluable on a Black Friday morning or a creator drop.
Step 5. Lock down permissions by role. Give finance read-only on the Finance section. Give growth full access on Acquisition. The "too many cooks" problem is real, and it shows up in Slack at the worst times.
Why Role-Based Permissions Matter
"We had three people editing dashboards at once and lost two weeks of pinned reports." u/dtc_ops_lead, r/shopify Reddit Thread
That is a preventable disaster. Permissions take 90 seconds to configure.
Steps 6 to 7: The Mirror Dashboard and Review Cadence
Step 6. Build a mirror dashboard outside Shopify. Pipe the same KPIs into a Google Sheet, Looker Studio view, or BI tool. ⚠️ Shopify shipped a daily-to-hourly rollup change in December 2024 with no warning, and operators lost continuity overnight.
Step 7. Lock a weekly review cadence. Same time, same KPIs, and same questions. Monday 9am works for most stores I have seen.
The Mirror Pattern in Practice
The mirror is not paranoia. It is operational hygiene. A founder doing $400K a month told me last week his Sheets mirror saved his Q4 board meeting after a Shopify UI reshuffle hid the comparison view.
Where a Reasoning Layer Compresses This
We built Luca to schedule and push these reports automatically. Connect your sources once, then ask Luca to "send me a weekly CAC report on Slack with graphs, reasoning, and recommendations." It compiles the mirror dashboard, explains the variance, and pings you in Slack or email on the cadence you set. ✅ Zero manual exports through marketing analysis and automation.
"Luca dropped my Monday morning ops review from 2 hours to 12 minutes." Verified Luca user, Shopify App Store Luca Verified Review
Q3: What Built-In Reports Does Shopify Offer Across Sales, Marketing, Inventory, and Finance, and Where Do They Stop? [toc=3. Built-In Reports]
Shopify ships eight report families: Sales, Acquisition, Behavior, Marketing, Inventory, Finance, Profit, and Customers, covering roughly 60 pre-built reports. They handle single-axis questions well, like sales by channel or sessions by device. They fail on cross-axis questions, like contribution margin by product and channel, or 90-day cohort LTV by acquisition source. Operators fill those gaps with TrueProfit, Lifetimely, Report Pundit, or a reasoning engine over a warehouse.
The Capability Statement
Shopify's Reports section is genuinely deep. Plan tier matters. Basic gives you finance summary plus a few standards, and Shopify and Advanced unlock the full library.
Report Family Coverage Map
Shopify Native Report Family Coverage Map
Report Family
Operator Question It Answers
Coverage Gap
Sales
Total sales, by product, channel, and day
No margin per SKU
Acquisition
Sessions, sources, and devices
No CAC by channel
Behavior
Top landing pages and search terms
No path and cohort
Marketing
Sales attributed to campaigns
UTM-only, no MMM
Inventory
On-hand units and ABC analysis
No sell-through velocity
Finance
Gross sales, taxes, and payouts
No contribution margin
Profit
Margin per order
No cohort or channel split
Customers
New vs returning, RFM-lite
No LTV by acquisition source
What the Native Reports Do Not Surface
Four cross-axis questions break native every time:
❌ Contribution margin by product and channel (need TrueProfit or a reasoning layer)
❌ 90-day cohort LTV by acquisition source (need Lifetimely or warehouse model)
❌ Cash conversion cycle, the days from inventory dollar to bank dollar (need Xero stitch)
❌ Full RFM segments (recency, frequency, monetary) for VIP filtering
Why This Matters at $3M GMV
A founder at Live Bearded, Anthony Mink, found that "product category diversity," buying from three or more categories, was a 100% LTV driver. Not purchase frequency. He surfaced it by exporting raw data into a reasoning engine.
No native Shopify report would have shown him that. The dashboard simply does not slice that way.
The "Build It Manually" Cost
Stitching these gaps with Sheets is possible. It costs roughly 10 to 15 hours a week of analyst time. That is one third of a junior data analyst headcount, paid in spreadsheets.
The Comparison Anchor
A junior ecom data analyst in the US runs $60K to $80K all-in. A reporting app stack covering margin, cohorts, and custom reports runs $300 to $1,500 a month. ✅ The math favors tooling for almost every $1M to $20M store on ecommerce analytics platforms.
Where a Reasoning Layer Lands
We trained Luca on ecom metric relationships, so it draws connections between margin, cohort, channel, and inventory in one query. Ask "which product and channel combo drives the highest 90-day repeat rate," and Luca answers in seconds. 💰 No SQL, no analyst, and no manual export through data analysis and deep industry research.
That is the gap between native reports (single-axis) and reasoning (cross-axis). Both have a place. Native is where you start.
Q4: How Do ShopifyQL and Sidekick AI Let You Build Custom Reports Without SQL? [toc=4. ShopifyQL and Sidekick]
ShopifyQL is Shopify's purpose-built query language (FROM sales SHOW total_sales, orders GROUP BY day SINCE -30d) accessible via the ShopifyQL Editor in Reports. Sidekick AI sits on top. Type "show repeat customers by category last 90 days," and it generates the ShopifyQL, runs it, and saves the report. It handles roughly 80% of single-source questions. The remaining 20% involving Meta, Klaviyo, or Xero data still require an external reasoning layer over a warehouse.
The Capability in One Line
ShopifyQL is SQL with training wheels for Shopify data. Sidekick is the natural-language layer on top. Together they collapse the analyst dependency for descriptive questions.
How It Works Under the Hood
Open Reports, then Custom Reports, then ShopifyQL Editor. You write a query against Shopify's schema. Sidekick generates that query for you when you ask in plain English.
FROM sales SHOW total_sales, orders, average_order_value WHERE product_type = 'Apparel' GROUP BY product_title SINCE -90d ORDER BY total_sales DESC LIMIT 10
That query returns your top 10 apparel SKUs by sales in the last 90 days. Sidekick writes it from "show me top apparel by sales last quarter."
A Sidekick Prompt Library That Earns Its Keep
These six prompts cover the 2-D questions native reports cannot answer. Save them.
⭐ "Show repeat purchase rate by product category for the last 90 days"
⭐ "Compare AOV between new and returning customers by acquisition channel"
⭐ "List products with declining sell-through over the last 30 days"
⭐ "Show cohort retention for customers acquired in October by their first product"
⭐ "Identify SKUs with rising refund rate week over week"
⭐ "Show conversion rate by device split by traffic source last 30 days"
Why These Six Matter
Each one was a two-hour Sheets job before Sidekick. Each one is a 12-second answer now. That is a real productivity move for a founder running ads at 2am.
Why It Matters for Analyst Replacement
A junior ecom data analyst spends 60% of their time on descriptive queries. Sidekick handles most of those. ✅ The analyst headcount question changes shape.
Where Sidekick Stops
Operators have flagged that built-in vertical AI forecasting is often "rubbish" on complex predictive work. Sidekick is genuinely useful for descriptive queries. It is not a forecasting engine, as discussed in Shopify's Winter 26 AI Sidekick coverage.
The Comparison Anchor
Sidekick covers Shopify-only data. Cross-source questions, like Meta CPM, Shopify cohort, and Xero cash position, still need a reasoning layer over a warehouse. We built Luca for exactly that gap.
The 80/20 Split
Sidekick vs Reasoning Layer Coverage Split
Question Type
Sidekick
Reasoning Layer Needed
Top SKUs last 30 days
✅
Optional
Cohort by Shopify product
✅
Optional
ROAS by Meta campaign and Shopify SKU
❌
✅
Cash position if I scale Meta 30%
❌
✅
Why did MER drop, with root cause
❌
✅
That table is the honest answer to "is Sidekick enough." For most $500K to $3M stores, it is. Past that, the cross-source questions multiply faster than Sidekick can serve them.
Q5: Which KPIs Should Live on Every DTC Founder's Shopify Dashboard, and How Do You Audit Yours Today? [toc=5. KPI Audit Checklist]
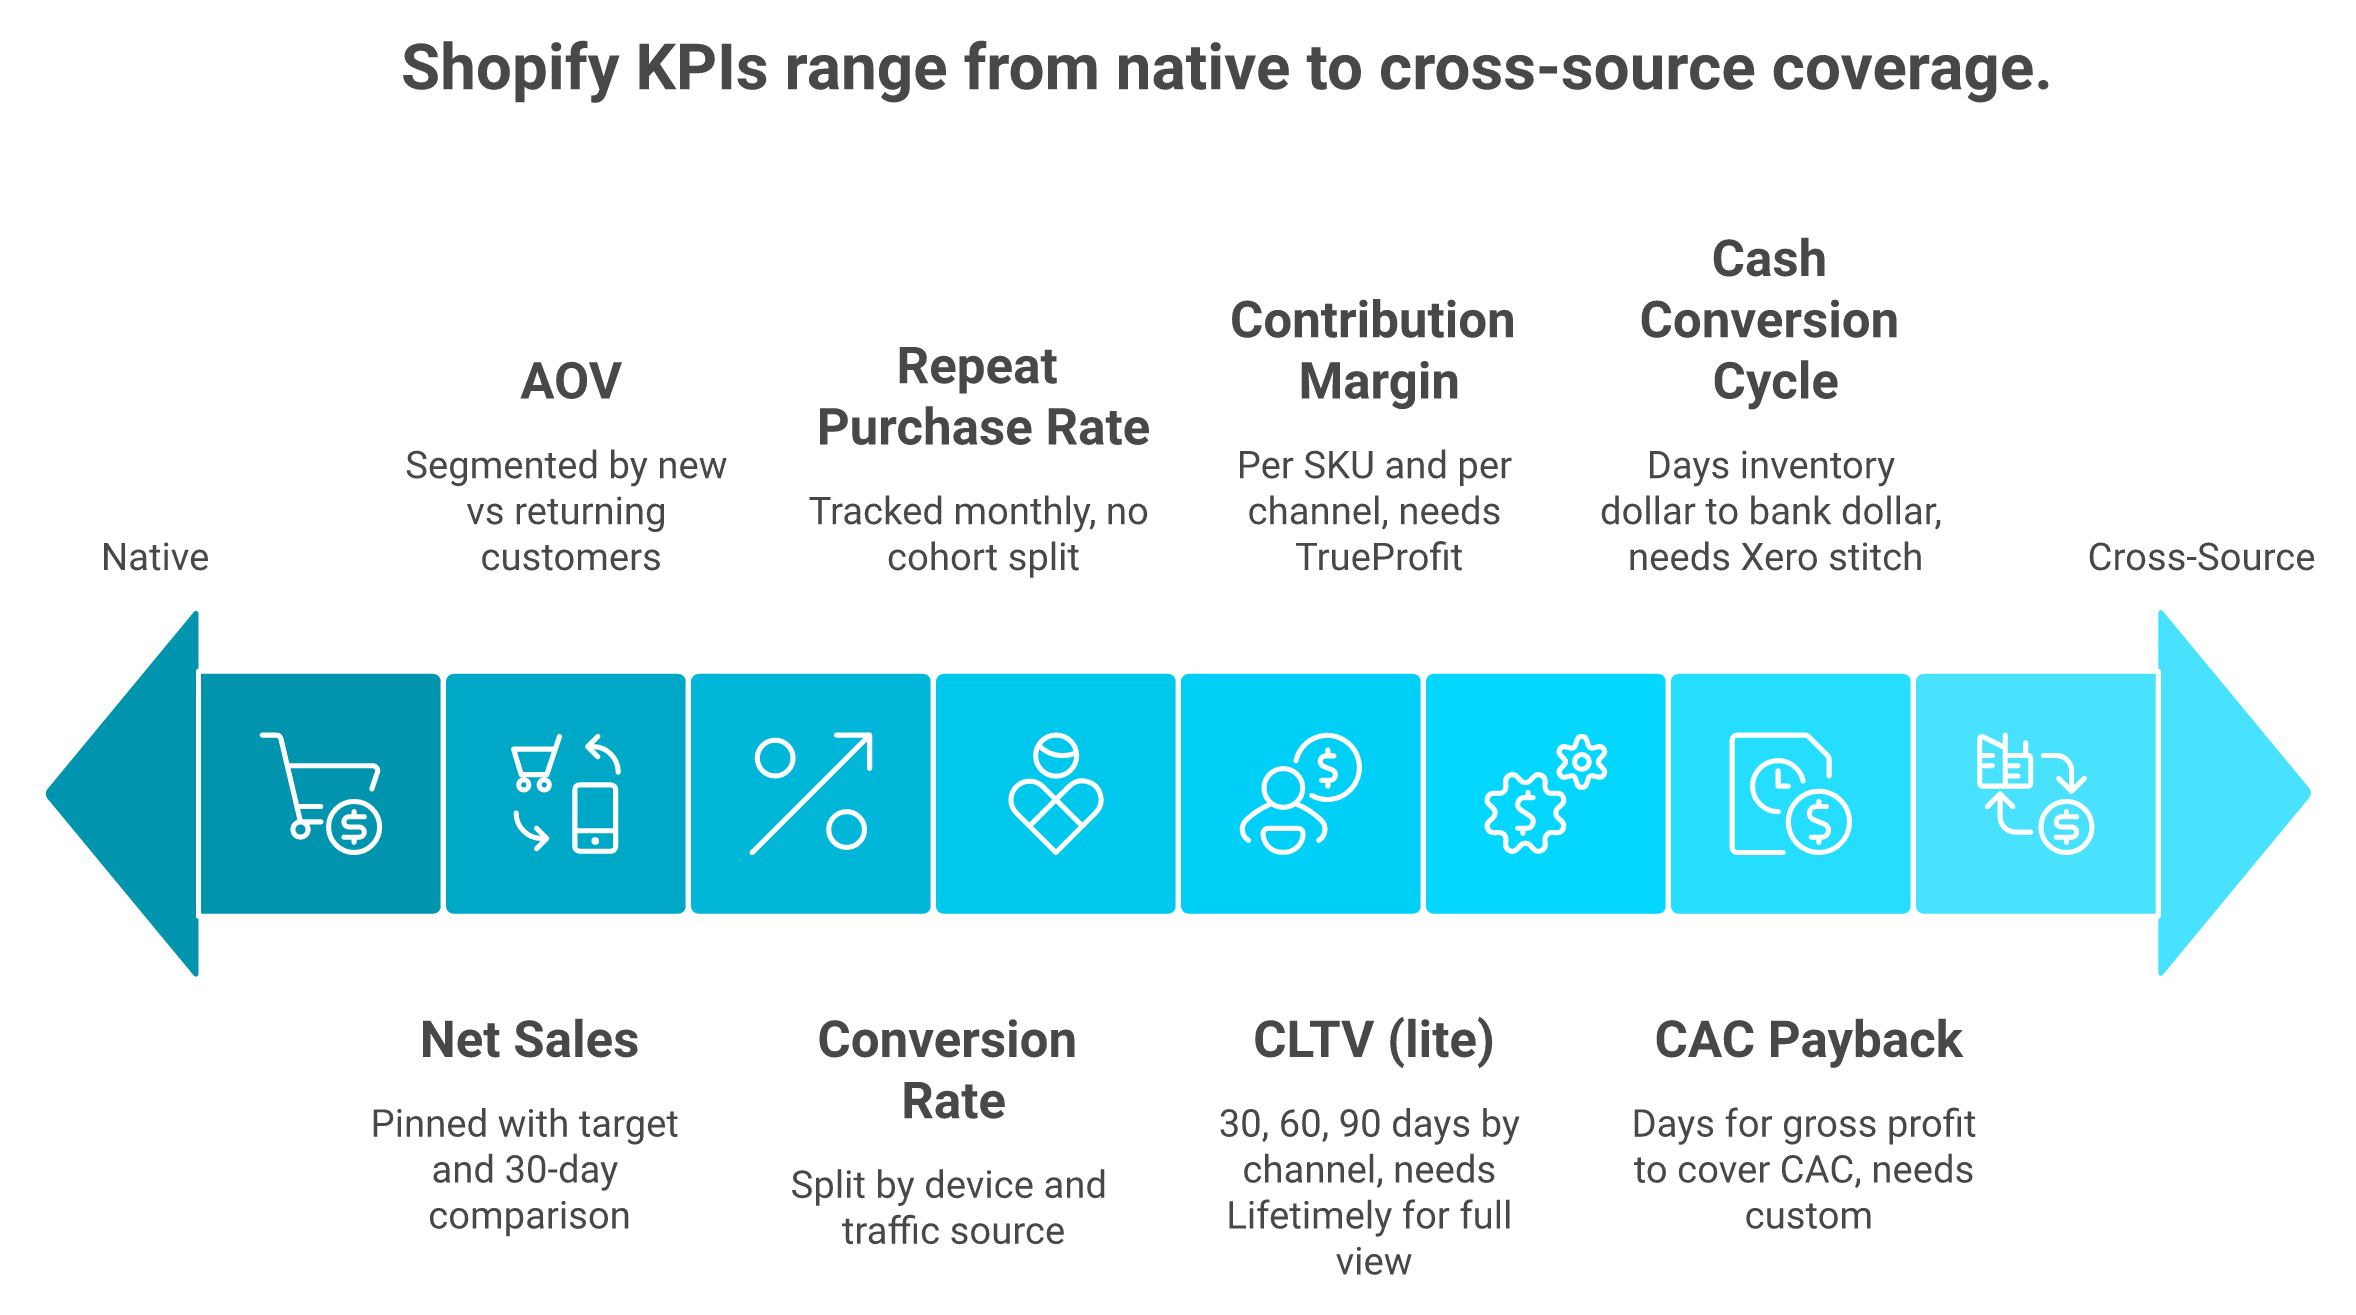
Eight KPIs deserve front-of-dashboard real estate: net sales, AOV (average order value), conversion rate, repeat purchase rate, CLTV (customer lifetime value), contribution margin, CAC payback period, and CCC (cash conversion cycle). Native Shopify surfaces the first five via Sales, Acquisition, and Customers reports. The last three need ShopifyQL custom reports or a dedicated app. Add RFM (recency, frequency, monetary value) segmentation alongside. It is the unambiguous way to separate VIPs from lapsed buyers, and it feeds every retention decision.
The Audit Frame
Score your current Shopify dashboard against this 8-item checklist. One point per "yes." Be honest, your future self will thank you.
The 8-KPI audit checklist separates what Shopify natively shows from what needs a reporting app or reasoning layer.
The 8-KPI Checklist
✅ Net sales is pinned, with target and 30-day comparison (native: Sales report)
✅ AOV is visible and segmented by new vs returning (native: Customers report)
✅ Conversion rate is split by device and traffic source (native: Acquisition)
✅ Repeat purchase rate is tracked monthly (native: Customers, but no cohort split)
✅ CLTV at 30, 60, and 90 days by acquisition channel (needs Lifetimely or custom)
⚠️ Contribution margin per SKU and per channel (needs TrueProfit or warehouse layer)
⚠️ CAC payback period (days for one customer's gross profit to cover CAC) (needs custom)
⚠️ Cash conversion cycle (days from inventory dollar to bank dollar) (needs Xero stitch)
Score Interpretation
Three honest tiers based on what I have seen across stores from $500K to $20M GMV.
Shopify Dashboard KPI Audit Score Tiers
Score
Read
What to Do Monday
7 to 8
Mature stack
Optimize cadence, not tooling
4 to 6
Critical gaps
Add a margin or cohort app this quarter
0 to 3
Manual chaos
Stop exporting CSVs, start with one custom report
Why RFM Belongs in Every Audit
RFM is the unambiguous VIP filter. A customer who bought 30 days ago, three times, with high spend, behaves nothing like one who bought once eight months ago. Native Customers reports give you a lite version. A real RFM segment needs a custom query or a layered tool.
The "Data Cleanup Year" Trap
Brands scaling from 7 to 8 figures often hit a "data cleanup year." A full year of stagnation, fixing messy SKU naming, attribution gaps, and channel taxonomies. Most operators only notice after a board deck blows up.
How to Skip It
Strategic operators normalize and standardize on ingestion, not after the fact. The fix is architectural, pick a tool that does this on day one, or spend a quarter retrofitting your warehouse stack.
Where a Reasoning Layer Lands
We built Luca to auto-surface these eight KPIs across Shopify, Meta, Google, Klaviyo, and Xero. ⏰ Schedule a weekly KPI report to Slack with graphs, reasoning, and the variance against target through financial management workflows. No SQL, no analyst, and no dashboard-building.
"Polar Analytics centralizes revenue, acquisition, and emailing with ease." Juliette P., CEO, Small-Business Polar Analytics G2 Verified Review
"Sometimes the data takes time to update, and some ratios are more difficult to understand." Juliette P., CEO Polar Analytics G2 Verified Review
"Mobile limitations and the platform isn't a plug-and-play solution. It requires time and effort to learn its advanced features." Charlene R., Head of Operations Polar Analytics G2 Verified Review
After looking at thousands of DTC P&Ls, what jumps out is that founders who score 7 to 8 on this checklist sleep better and ship faster. Period.
Q6: Can You Trust Your Shopify Data, and How Do You Reconcile Attribution Discrepancies With Meta and Google? [toc=6. Attribution Reconciliation]
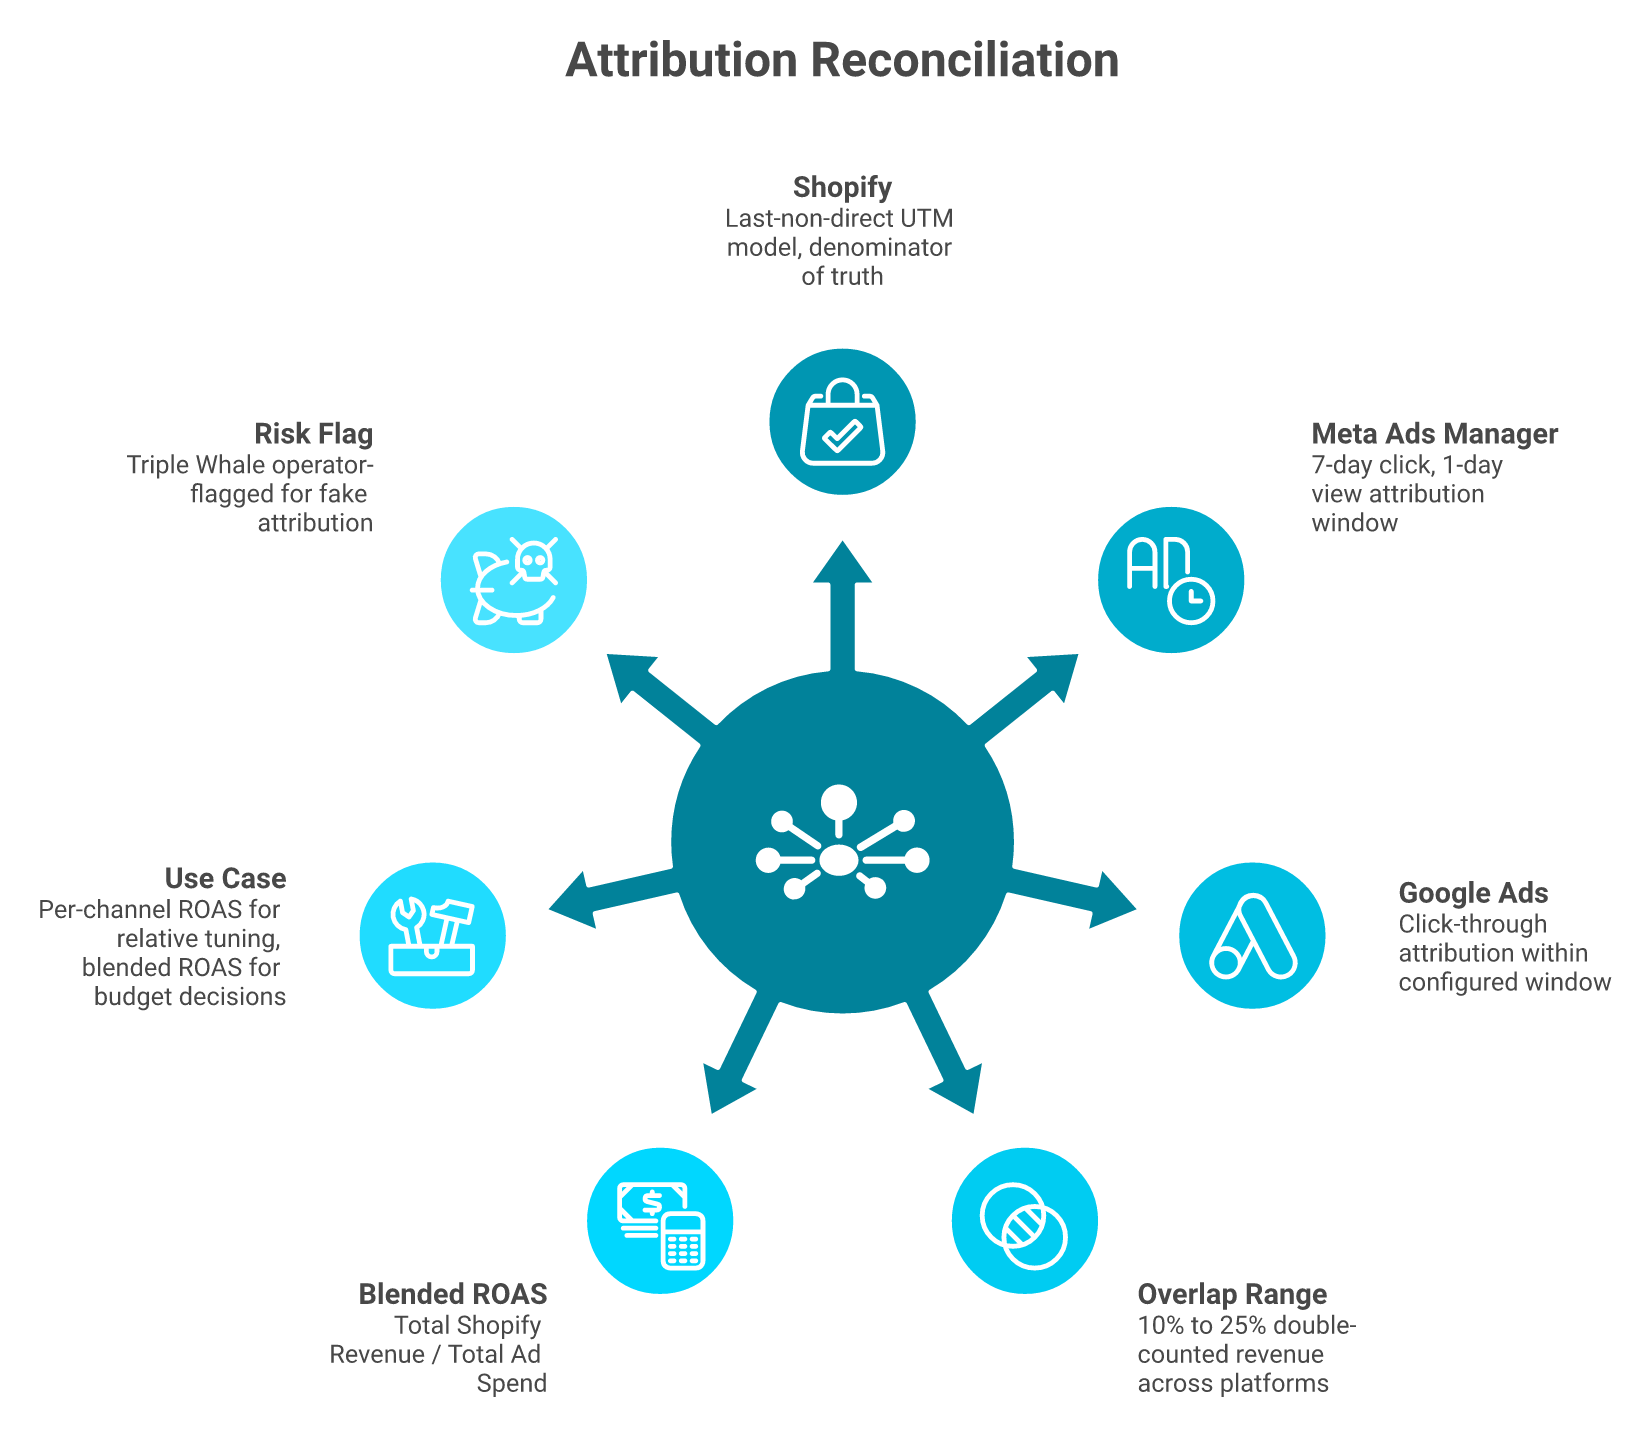
Two trust problems collide on the dashboard. First, native data bugs: ghost December orders, 75M-unit inventory totals, and silent UI rollups documented across r/EcommerceWebsite. They require a weekly QA checklist (orders export vs metric cards, inventory snapshot vs WMS). Second, attribution mismatch: Shopify uses last-non-direct UTM while Meta and Google use click-through, creating 10% to 25% overlap. Reconcile with a blended-ROAS view: Shopify orders as denominator, and total ad spend as numerator, as covered in our declining platform ROAS analysis.
Three platforms, one buyer, three claimed revenue totals. Blended ROAS is the only honest denominator.
The 2am Scene
It is 2am. Meta says the campaign drove $100K. Shopify shows $60K in orders for the same window. You have ad spend approval at 9am.
Which number is real? Both, and neither. That is the problem.
Why Operators Lose Sleep Here
Meta counts a click within its attribution window, often 7-day click and 1-day view. Shopify counts the last UTM-tagged session before checkout. Same buyer, two truths, and a $40K gap.
The 7-Item Weekly Data-Integrity QA Checklist
Run this every Monday before any decision. ✅ Ten minutes saves weeks.
Orders cross-check. Shopify orders export vs metric card total for the week.
Inventory cross-check. On-hand units vs WMS or 3PL snapshot.
Refund anomaly scan. Refund rate by SKU vs 90-day baseline.
UI version log. Note any Shopify dashboard UI changes (subscribe to changelogs).
Attribution overlap. Sum Meta, Google, and TikTok claimed revenue vs Shopify total.
Channel taxonomy. UTM source and medium consistency across campaigns.
Margin sanity. Gross margin per SKU, flag anything 10% off the rolling average.
The "Ghost Data" Problem
"I export to Sheets every Sunday. Shopify just doesn't answer the questions I actually have." u/Sufficient_Sky_2683, r/shopify Reddit Thread
That comment is from the same thread documenting silent dashboard rollouts. The mirror dashboard from Q2 catches this. The QA checklist closes the loop.
The Attribution Reconciliation Workflow
Stop treating Meta or Google as truth. Treat Shopify orders as the denominator. ⭐ Here is the formula that ends most 2am arguments.
Blended ROAS = Total Shopify Revenue / Total Ad Spend (all channels).
That single number is honest. Per-channel ROAS from Meta or Google is directional. Use it for relative tuning, not absolute decisions, alongside Google Analytics for ecommerce.
Why Triple Whale Does Not Fully Solve This
Operators have flagged structural attribution issues with Triple Whale itself, which is why we maintain a Triple Whale alternatives guide.
"Broken Integrations, Fake Attribution for External Marketplaces. Triple Whale shows orders from external marketplaces as if they were real conversions even though these orders never go through our Shopify store." XTRA FUEL, Verified User Triple Whale Trustpilot Verified Review
"The integrations are inconsistent, building with the AI tool Moby is very buggy and crashes more than half the time, and support is largely unresponsive." Matt Huttner, Verified User Triple Whale Trustpilot Verified Review
That is operator reality, not vendor pitch. Treat any attribution layer as a triangulation tool, not gospel.
Where a Reasoning Layer Lands
We built Luca as an AI layer over a data warehouse. It auto-runs the QA checklist nightly and root-causes attribution deltas across Shopify, Meta, and Google. 💸 Ask "why did blended ROAS drop last week," and Luca traces it to a Meta CPM spike in one zip code, not a 2am guess, using marketing analysis and automation.
That is the move from triangulation to reasoning. It does not replace your judgment. It compresses the time you spend earning it.
Q7: How Do You Stitch Inventory and Finance Reporting Into One Cash-Aware Workflow? [toc=7. Cash-Aware Inventory]
Native Inventory reports show on-hand units and ABC analysis but ignore sell-through velocity, lead time, and the cash impact of restocking. Native Finance reports show revenue and tax but not contribution margin or CCC. Stitch them: multiply inventory turnover by COGS, and subtract from cash on hand to get reorder runway. Or layer a reasoning engine that models "if I reorder SKU X at quantity Y, what's my cash position in 60 days?" across Shopify, supplier ledgers, and Xero in one query, similar to our cash flow forecasting approach.
The Benchmark Hook: Amazon's Negative Cash Cycle
Amazon runs on a negative cash conversion cycle of negative 53 days. Customers pay Amazon before Amazon pays suppliers. That float funds AWS, logistics, and new ventures.
Why That Number Matters at $3M GMV
You are not Amazon. You also do not have 60-day supplier terms. The same physics governs your store though.
Every day cash sits locked in inventory, or waiting on Stripe payouts, is a day you cannot reinvest in a winning Meta campaign. ⏰ The CCC is the hidden lever most $1M to $20M Shopify operators ignore, and it sits at the heart of working capital calculations.
The Founder Parallel
Most DTC stores at this scale run a CCC of 30 to 60 days without knowing the number. Shopify does not show it. Xero does not connect it to marketing spend. So nobody sees it.
Pattern Recognition Across the Industry
⚠️ Gymshark scaled from a garage to a $1.4B valuation, but by 2022 their CCC ballooned to 102 days, with $49M locked in unsold inventory.
⚠️ Allbirds discovered warehouse-only fulfillment caused stockouts on best-sellers, lost sales they could measure but could not recover.
⚠️ Reddit r/ecommerce: "We were profitable on paper but couldn't fund our next inventory order. Nobody told us our CCC was 58 days."
Three brands. Three scales. Same lesson. Cash cycle visibility is a growth lever, not a finance hobby.
The Principle
The founders who control inventory velocity, cash timing, and reorder math outgrow those who do not. ✅ This is a data architecture decision, not a strategy.
Most $1M to $20M brands are making it by accident. The strategic ones make it on purpose on day one through AI-driven cash flow forecasting.
The Tactical Insight: Warehouse Slotting
Operators have used AI to rank SKU velocity and assign shelf placement, hip height for fast movers, and head height for slow. That single move saves a month of manual work. It also drops pick times 15% to 20% on the warehouse floor.
The Stitch Workflow
Here is the math, no tools required:
Reorder Runway (days) = (Cash on Hand / (Daily COGS x Lead Time)).
CCC = Days Inventory Outstanding + Days Sales Outstanding minus Days Payables Outstanding.
Run it weekly. Update it after every supplier PO. ✅ That alone puts you ahead of most $5M DTC stores.
Where a Reasoning Layer Lands
We built Luca to simulate this without spreadsheets. Ask "if I reorder SKU X at 5,000 units, what's my cash position in 60 days assuming current sell-through," and Luca pulls Shopify velocity, supplier lead time, and Xero cash position in one answer through financial management.
"Disappointed with Customer Support. I have been extremely frustrated with Triple Whale due to the lack of accessible customer support." Team All Fresh Seafood, Verified User Triple Whale Trustpilot Verified Review
"Polar analytics: I've reported an issue with inventory levels, as our inventory is multiplied with 6, since we have 6 different Shopify stores connected to the same warehouse. It has taken them closer to 1.5 month, and I've still not received a solution." Maja, Verified User Polar Analytics Trustpilot Verified Review
That is the gap between a dashboard and a reasoning layer. Inventory and cash is one question, not two reports.
Seven contenders matter for $1M to $20M Shopify stores. Luca AI (AI reasoning layer over a data warehouse, with extract, predict, simulate, root-cause, and agentic Slack and email reports), Triple Whale (marketing attribution), Polar (warehouse plus dashboards), Lifetimely (LTV and cohorts), TrueProfit (contribution margin), Better Reports (custom report builder), and Report Pundit (5.0 stars, 1,860+ Shopify App Store reviews, flexible custom reports). Choice depends on whether you need attribution, margin, cohorts, or cross-source reasoning, which we cover in best Shopify analytics apps.
The Comparison Context
Picking a reporting app is an architecture decision. Most founders pick on integration count or price, then regret it 18 months later. The right question is, can it reason across your data, or only display it?
Luca AI: AI Reasoning Layer Over a Data Warehouse
✅ Strengths. Plain-English queries across Shopify, Meta, Google, Klaviyo, and Xero. Predictive simulation ("what if I cut SKU X"). Root-cause analysis on outliers. Agentic scheduled reports to Slack and email. Normalizes data on ingestion, no data cleanup year.
❌ Trade-offs. Operator-flagged attribution accuracy and support issues.
"1 STAR, Broken Integrations, Fake Attribution for External Marketplaces. Daily revenue totals are wrong, entire order blocks are missing." XTRA FUEL, Verified User Triple Whale Trustpilot Verified Review
Polar Analytics: Warehouse Plus Dashboards
✅ Strengths. Strong omnichannel data unification. Solid for DTC and retail brands.
❌ Trade-offs. Setup time, support delays, and multi-store inventory bugs flagged.
"It has taken them closer to 1.5 month, and I've still not received a solution. I always get the response that it's fixed, but when I check for myself it has not been fixed." Maja, Verified User Polar Analytics Trustpilot Verified Review
"The platform isn't a plug-and-play solution. It requires time and effort to learn its advanced features." Charlene R., Head of Operations Polar Analytics G2 Verified Review
Lifetimely, TrueProfit, Better Reports, and Report Pundit
Each owns one slice well, and none cover the cross-source question.
Specialist Reporting Apps: Sweet Spot vs Limit
Tool
Sweet Spot
Limit
Lifetimely
LTV and cohort views
Marketing-side blind
TrueProfit
Contribution margin per order
No cohort or attribution
Better Reports
Custom report builder
Manual, no AI
Report Pundit
Custom Shopify reports, 5.0 and 1,860+ reviews
Single-source only
The Scorecard
Shopify Reporting Apps Capability Scorecard
Capability
Luca AI
Triple Whale
Polar
Lifetimely
TrueProfit
Better Reports
Report Pundit
Cross-source reasoning
✅
⚠️
⚠️
❌
❌
❌
❌
Predictive simulation
✅
❌
❌
❌
❌
❌
❌
Root-cause analysis
✅
⚠️
⚠️
❌
❌
❌
❌
Custom reports
✅
✅
✅
⚠️
⚠️
✅
✅
Agentic Slack and email push
✅
⚠️
⚠️
❌
❌
⚠️
⚠️
Shopify App Store rating
New
Mixed
Mixed
4.8
5.0
4.9
5.0
G2 and Trustpilot signal
Positive
Mixed
Mixed
Positive
Positive
Positive
Positive
Who Should Choose What
⭐ Choose Triple Whale if attribution is your only problem and you have a data team to validate the numbers.
⭐ Choose Polar if you need a warehouse plus dashboards and have 6+ weeks for setup.
⭐ Choose Lifetimely or TrueProfit if you need one slice (cohorts or margin) cheaply.
⭐ Choose Report Pundit or Better Reports if Shopify-only custom reporting is enough.
⭐ Choose Luca AI if cross-source reasoning, predictive simulation, and Slack-native scheduled reports matter more than a single specialty, as covered in our best AI tools for Shopify owners guide.
What shipping Luca to real ecom founders has taught me is that operators do not want another dashboard. They want a system that genuinely contributes with reasoning, not a chatbot that recites their data back to them.
Q9: When Should You Upgrade From Shopify Native to a Reporting App or Full BI Stack? [toc=9. Upgrade Decision Framework]
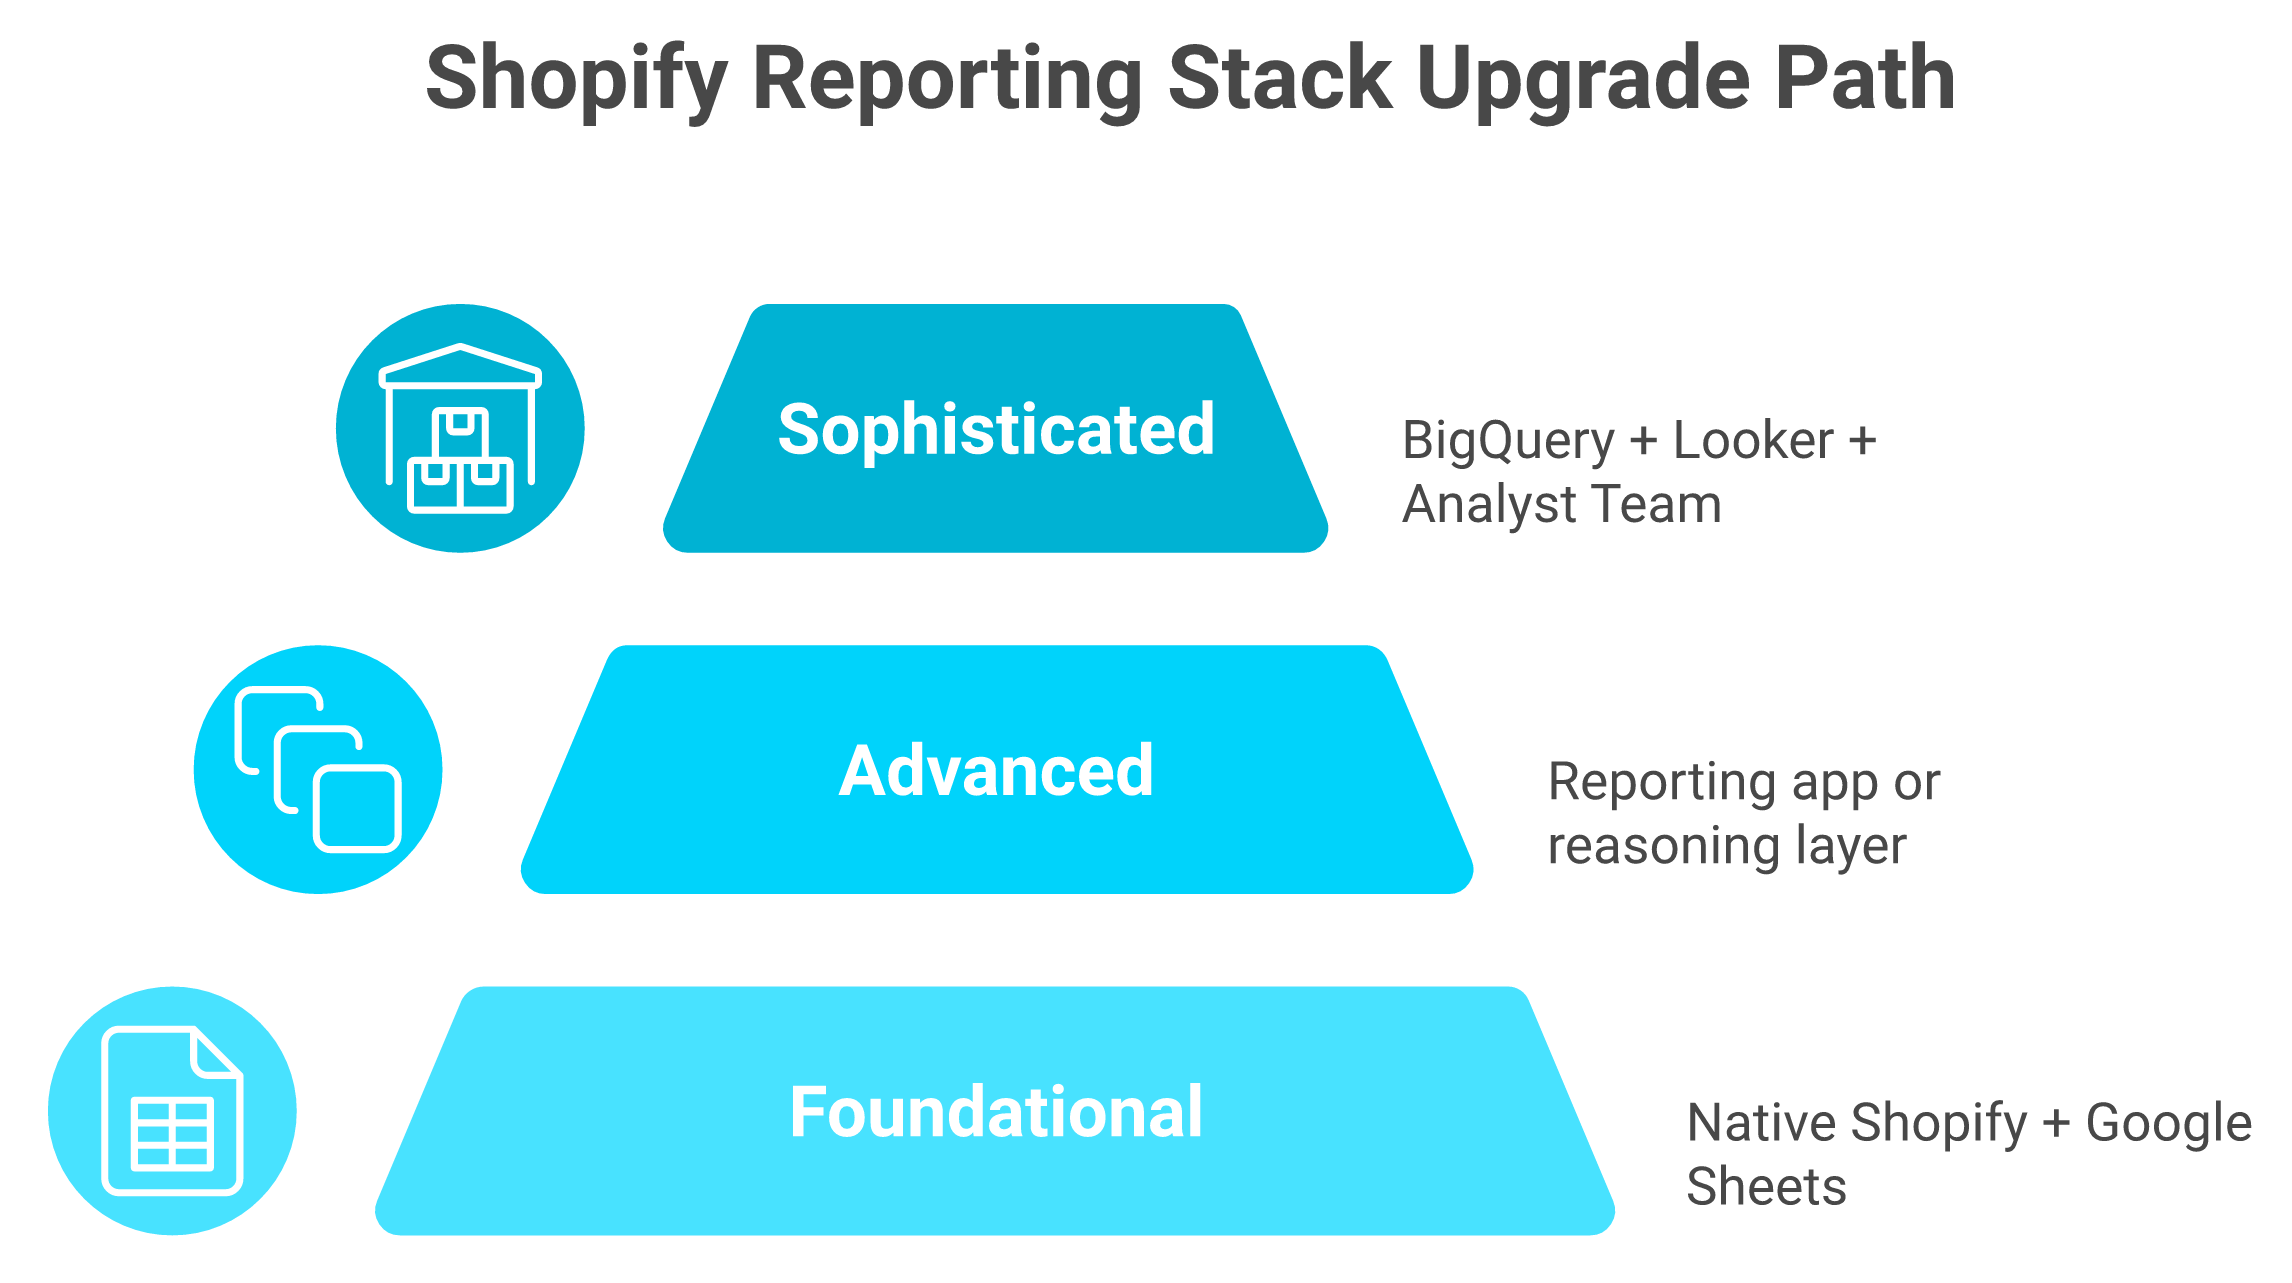
Three levels. Level 1 (under $1M GMV): native Shopify plus Google Sheets is sufficient. Level 2 ($1M to $10M): add a reporting app, TrueProfit for margin, Lifetimely for cohorts, Report Pundit for custom, or a reasoning layer over a warehouse for cross-source questions. Level 3 ($10M+): warehouse (BigQuery or Snowflake) plus Looker or Hex, with dedicated analyst headcount. The trigger is rarely revenue alone. It is the third analyst hire, a $40K+ attribution discrepancy, or funding-round prep, as we explore in our ecommerce analytics platforms guide.
The Decision Dilemma
Picking the wrong reporting tier costs more than picking the wrong tool. Operators get locked into either an under-powered native setup that drains analyst hours, or an over-engineered warehouse that needs three engineers to run. Both kill velocity.
The Wrong Way to Decide
Most founders pick on integration count or seat price. ❌ "Does it connect to Klaviyo, and is it under $300 a month" is the wrong question.
The right question is, can it reason across your data, or only display it? That single filter separates dashboards from intelligence layers.
The 7-Criterion Evaluation Framework
Score every option you are considering 0 to 2 on these seven. Tools scoring 12 or higher are genuine architectural advancement. Below 8 means you are buying a dashboard.
✅ Cross-source reasoning. Can it answer questions spanning Shopify, Meta, Klaviyo, and Xero in one query?
✅ Predictive simulation. Can it model "what happens if I scale Meta 30%"?
✅ Root-cause analysis. Does it explain why ROAS dropped, not just that it dropped?
✅ Agentic push. Does it auto-send weekly reports to Slack and email?
✅ Setup time. Hours, days, or weeks to first answer?
✅ Pricing model. Flat outcome-based, or punishing per-seat or per-row?
✅ Intelligence architecture. AI-native, or a dashboard with a chatbot bolted on?
Apply It Across the Three Levels
The upgrade trigger is rarely revenue alone. It is the third analyst hire or a six-figure attribution gap.
Shopify Reporting Stack: Three-Level Upgrade Path
Stage
Stack
Score Range
Trigger to Move Up
Level 1 (under $1M)
Native and Sheets
4 to 6
First $40K attribution gap
Level 2 ($1M to $10M)
Native and reporting app, or reasoning layer
8 to 12
Third analyst hire
Level 3 ($10M+)
Warehouse, Looker or Hex, plus analyst team
12 to 14
Funding round, IPO prep
The Meta-Insight
The "data cleanup year" is real. Brands scaling from 7 to 8 figures often spend 12 months fixing SKU naming, attribution gaps, and channel taxonomies. Strategic operators skip it by normalizing on ingestion on day one, as we cover in why ecommerce founders are drowning in data.
Operator Receipts
"After using Triple Whale, Wayflyer, and spreadsheets for 2 years, I found critical gaps in cross-functional visibility. Most tools show marketing OR finance, never both together." Eric Bidinger, Founder Luca Founder Context
"Triple Whale shows orders from external marketplaces as if they were real conversions even though these orders never go through our Shopify store." XTRA FUEL, Verified User Triple Whale Trustpilot Verified Review
In our work with bootstrapped Shopify operators, the brands that picked an intelligence layer at Level 2 outgrew the ones that waited for Level 3 by roughly six months on every launch cycle, an edge we detail in ecommerce management software commentary. That gap compounds.
Q10: What Does a Day Look Like Running Shopify Reporting on a Reasoning Layer vs a Standard Dashboard? [toc=10. Day-in-the-Life Comparison]
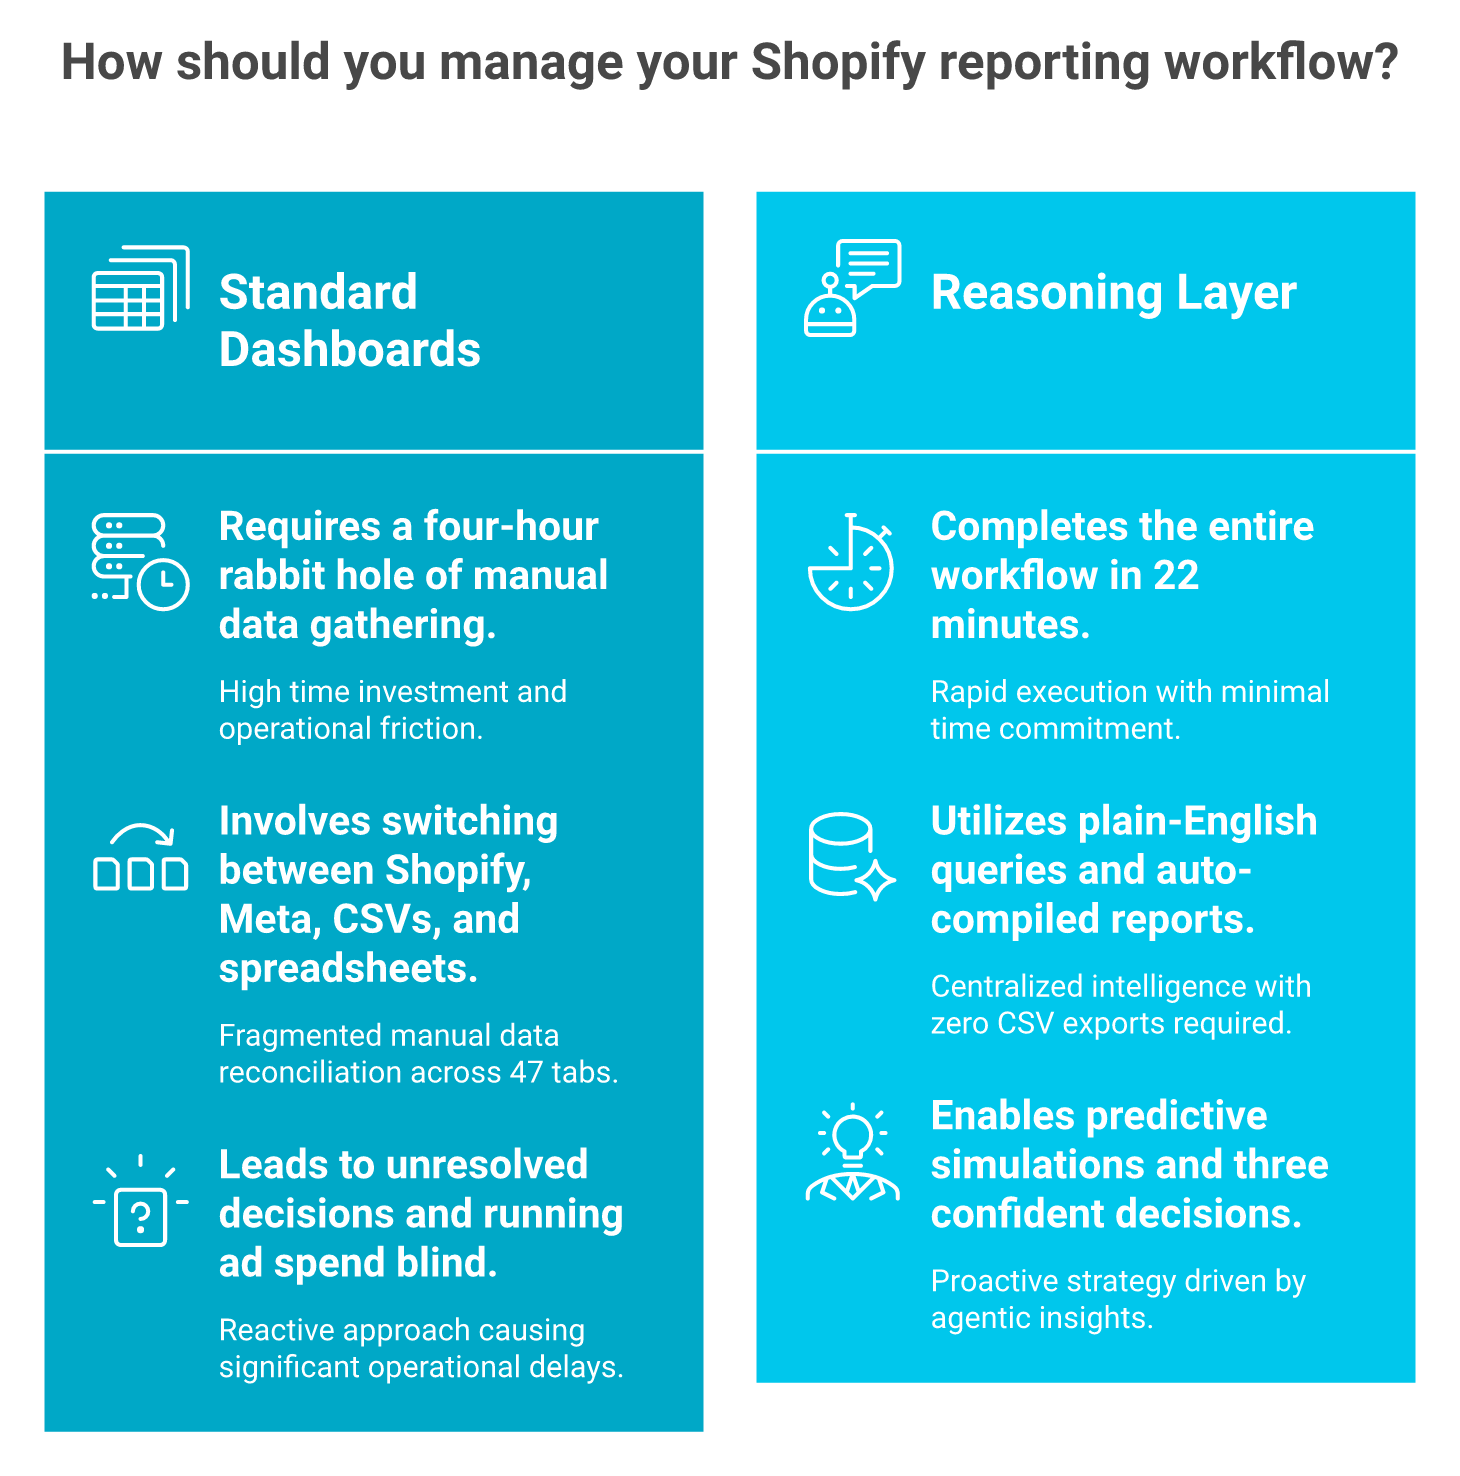
Before: 7:30am Shopify dashboard, 9am Meta Ads Manager, 11am CSV exports for cohorts, 2pm spreadsheet reconciliation, 4pm Slack the analyst, 6pm still no answer. After: 7:30am one Slack alert ("Meta CPM up 18%, ROAS dropped, root cause: creative fatigue on top SKU"), 8:15am one follow-up question, 10am one cohort and channel simulation, 11:30am one auto-compiled team report. 22 minutes, three confident decisions, and zero CSV exports, similar to workflows in how AI can actually help you run your ecommerce business.
The Frame
Here is how a $3M DTC Head of Growth runs a typical Tuesday on a reasoning layer instead of a stack of dashboards.
The Old Day (Standard Dashboards)
⏰ 7:30am. Open Shopify Analytics. Sales down 9% week over week.
⏰ 9:00am. Open Meta Ads Manager. ROAS looks fine on platform.
⏰ 11:00am. Export three CSVs for cohort math.
⏰ 2:00pm. Spreadsheet reconciliation, 47 tabs, and no clear answer.
⏰ 4:00pm. Slack the analyst, "can you check this."
⏰ 6:00pm. Still waiting.
That is four hours, two unanswered questions, and one delayed decision. Meanwhile, ad spend kept running.
The New Day (Reasoning Layer)
⭐ 7:30am. Slack alert from Luca: "Meta CPM up 18% on top campaign. ROAS dropped below threshold. Root cause: creative fatigue on SKU 4421, CTR down 40% vs Week 1."
⭐ 8:15am. Ask Luca, "show me cohort retention by acquisition channel for October." Answer in 12 seconds with a chart.
⭐ 10:00am. Ask, "if I shift $20K from Meta to TikTok testing, simulate cohort impact." Luca models it across Shopify, Meta, and Klaviyo.
⭐ 11:30am. Auto-compiled weekly team report lands in Slack. CAC by channel, cohort retention, top SKUs, with reasoning.
⭐ 2:00pm. Quick check on agentic alert thresholds for Q4. Five minutes.
⭐ 5:00pm. Done. Total time in Luca, 22 minutes.
The Contrast
Four hours of CSV exports collapse into 22 minutes when the dashboard becomes a reasoning layer.
Old workflow: 4 hours, 2 decisions delayed, and ad spend running blind. New workflow: 22 minutes, 3 confident decisions, and zero CSV exports. That is the agentic shift, anchored in our AI Co-Founder approach.
Operator Receipts
"The integrations are inconsistent, building with the AI tool Moby is very buggy and crashes more than half the time, and support is largely unresponsive." Matt Huttner, Verified User Triple Whale Trustpilot Verified Review
"Polar analytics: I always get the response that it's fixed, but when I check for myself it has not been fixed." Maja, Verified User Polar Analytics Trustpilot Verified Review
What shipping Luca to real ecom founders has taught me is that the time savings only land if the tool removes "cognitive friction," the gap between a chart and a decision. Dashboards leave that gap. Reasoning layers close it through sales performance workflows.
Q11: How Do You Fund the Inventory and Marketing Moves Your Reporting Surfaces, and What Should You Look For in a Capital Partner? [toc=11. Funding Capital Partner]
Once your dashboard surfaces a winning campaign or a stockout risk, the next constraint is capital. Evaluate providers on four metrics: APR or fee structure, disbursal time, term flexibility, and dilution. Wayflyer and Clearco approve in 72 hours, but lock you into rigid revenue-share with personal guarantees common. Shopify Capital is fastest (around 24 hours), but capped. Luca AI ships dynamically-priced capital with same-day disbursal and no personal guarantees, and pricing reflects real-time business performance, not a 60-day-old application, as we detail in funding to scale ecommerce marketing campaigns.
The Sunday-Night Renewal Scene
A founder doing $4M ARR pinged me last Sunday. Wayflyer had offered a renewal at a 9.2% factor on $250K, repaid as 12% of daily Shopify revenue. His next inventory PO was due Friday. He had 18 hours to decide.
The Four Metrics That Decide It
That decision rests on APR or factor, disbursal time, term flexibility, and what happens if revenue softens. Most founders only check the first one. The other three are where capital deals quietly hurt, which is why we built the intelligence capital thesis.
Luca AI on Capital Metrics
✅ APR or factor structure. Dynamically priced based on real-time business health, not a static application from 60 days ago. Pricing tightens when your margin and velocity hold, and loosens when they do not.
✅ Disbursal time. Same day on most approvals once data sources are connected.
✅ Term flexibility. Repayment scales with daily revenue. No fixed weekly minimums that break in soft weeks.
✅ Dilution. Zero. Non-dilutive, no equity, and no personal guarantees on standard offers.
Wayflyer
✅ Strengths. 72-hour approvals on first deal. Strong UK and US presence. Comfortable with $1M to $30M GMV brands.
❌ Trade-offs. Re-approvals can fail without warning. Operator complaints on opaque terms, pulled offers, and aggressive default clauses, which is why we maintain a Wayflyer alternatives guide.
"Wayflyer abruptly reversed their decision at the last minute. This caused significant disruption to our operations and cash flow, as we had already made critical business decisions based on their confirmed commitment." Geoff Brand, Verified User Wayflyer Trustpilot Verified Review
"They can deem you in default for any reason at their discretion. They can redirect your Shopify funds to their account." Zachary Piech, Verified User Wayflyer Trustpilot Verified Review
Clearco
✅ Strengths. Recognizable brand. Direct Shopify integration. Quick first-deal underwriting.
❌ Trade-offs. Effective APR often 35% to 40% on short terms. Account manager turnover and support gaps documented across 2023 to 2025, which is why our Clearco alternatives guide exists.
"Pretty expensive product at 35-40% APR. Even worse support. Made me jump through hoops." Julian Fernau, Verified User Clearco Trustpilot Verified Review
"We worked with Clearco for a couple of years. The new rep didn't take the time to understand our business or advocate for us internally." Melissa, Verified User Clearco Trustpilot Verified Review
❌ Trade-offs. Capped offers (often $5K to $1M depending on history). Take-it-or-leave-it terms, no negotiation. Not available in all regions.
8fig
✅ Strengths. Built around inventory cycles and supplier payment timing. Useful for product-heavy brands with predictable buy cycles.
❌ Trade-offs. Rigid weekly remittance model breaks in soft weeks. Personal guarantees common above $200K.
The Capital Scorecard
Capital Partner Comparison Scorecard
Metric
Luca AI
Wayflyer
Clearco
Shopify Capital
8fig
APR or factor range
Dynamic, performance-priced
6 to 24% factor
35 to 40% effective
Flat factor, capped
Variable, around 9 to 14%
Disbursal SLA
Same day
72 hours
5 to 10 days
Around 24 hours
5 to 10 days
Term flexibility
Revenue-flex daily
Revenue-share, fixed
Weekly fixed
Daily % of sales
Weekly fixed
Personal guarantee
None standard
Sometimes
Sometimes
None
Sometimes
Dilution
None
None
None
None
None
Who Should Choose What
💰 Choose Shopify Capital if you need under $50K, fast, and qualify.
💰 Choose Wayflyer if you have a clean track record, accept the term risk, and read the default clauses.
💰 Choose Clearco only after running the APR math, and only if other options are exhausted.
💰 Choose 8fig if your buying cycle is predictable and you can absorb fixed weekly draws.
💰 Choose Luca AI if you want capital priced to real-time performance, with same-day disbursal, revenue-flex terms, and no personal guarantee, as compared in Luca AI vs Wayflyer.
What I think shifts in the next 18 months is that capital pricing tied to live business performance, not 60-day-old applications, becomes the default, not the differentiator.
FAQ's
What is the Shopify reporting dashboard and what does it actually cover?
The Shopify reporting dashboard is the Analytics page inside Shopify admin where customizable metric cards display sales, sessions, conversion rate, and fulfillment in near real-time. Reports drill deeper across eight families: Sales, Acquisition, Behavior, Marketing, Inventory, Finance, Profit, and Customers.
We see it cover three core jobs well:
Store health checks across orders, traffic, and AOV.
Single-axis queries like sales by channel or sessions by device.
Live view monitoring for launch days and creator drops.
Where it stops is the cross-source question. Native cannot answer 'why did blended ROAS drop, considering Meta CPM, Shopify cohort, and Xero cash position.' We built Luca as an AI Co-Founder layered over a data warehouse precisely for that gap, so founders can move from descriptive dashboards to reasoning that explains causes and pushes scheduled reports to Slack.
How do ShopifyQL and Sidekick AI help build custom reports without SQL?
ShopifyQL is Shopify's purpose-built query language available in the ShopifyQL Editor. Sidekick AI sits on top and converts plain-English prompts into ShopifyQL queries that run instantly.
We find Sidekick covers roughly 80% of single-source descriptive questions, including:
Top SKUs by sales over a custom window.
Repeat purchase rate by product category.
Conversion rate split by device and traffic source.
Where it stops is cross-source reasoning. Meta CPM trends, Klaviyo flow performance, and Xero cash position do not live inside Shopify, so Sidekick cannot synthesize across them. For predictive simulation and root-cause analysis, we connect Luca to the full ecommerce stack and reason across every source in one query. Sidekick is genuinely useful for the descriptive 80%. A reasoning layer takes care of the cross-source 20% where most growth decisions actually get made.
Why do Shopify and Meta show different revenue numbers, and how do we reconcile them?
Two attribution models collide. Shopify uses last-non-direct UTM at checkout, while Meta and Google count click-through within their own attribution windows. The result is 10% to 25% overlap, where the same buyer gets claimed by two systems.
We reconcile this with three moves:
Treat Shopify orders as the denominator, never platform-reported revenue.
Use blended ROAS: total Shopify revenue divided by total ad spend across all channels.
Run a weekly QA checklist comparing platform-claimed revenue against Shopify orders.
Per-channel ROAS from Meta or Google is directional and useful for relative tuning, not absolute budget calls. We dig deeper into this gap in declining platform ROAS vs true profitability, where we show how a reasoning layer can root-cause attribution deltas across Shopify, Meta, Google, and TikTok in one query instead of forcing a 2am spreadsheet reconciliation.
When should we move from native Shopify reporting to a paid app or a BI stack?
We use a three-level upgrade path tied to triggers, not just revenue.
Level 1, under $1M GMV: native Shopify plus Google Sheets is enough.
Level 2, $1M to $10M: add a reporting app like TrueProfit, Lifetimely, or Report Pundit, or layer a reasoning engine over a warehouse.
Level 3, $10M+: a warehouse like BigQuery or Snowflake, plus Looker or Hex, plus a dedicated analyst.
The trigger to move up is rarely revenue alone. We see it land on the third analyst hire, a $40K+ attribution discrepancy, or funding-round prep. Founders who normalize and standardize data on ingestion skip the painful 'data cleanup year' that hits 7-to-8 figure brands. For a deeper decision framework, we covered this stack-by-stack in our ecommerce analytics platforms guide, including the seven criteria that separate a real intelligence layer from a dashboard with a chatbot bolted on.
How do we fund the inventory and marketing moves our Shopify dashboard surfaces?
Once the dashboard flags a winning campaign or a stockout risk, capital becomes the constraint. We score every provider on four metrics.
APR or factor structure, including effective cost in soft weeks.
Disbursal time, from application to bank account.
Term flexibility, especially what happens when revenue softens.
Dilution and personal guarantees, often buried in the contract.
Wayflyer and Clearco approve in 72 hours but lock founders into rigid revenue-share with personal guarantees common. Shopify Capital is fastest (around 24 hours) but capped. We ship dynamically-priced capital with same-day disbursal, revenue-flex repayment, and no personal guarantees on standard offers, anchored in our intelligence capital thesis. Pricing reflects real-time business performance, not a 60-day-old static application, which matters when an inventory PO is due Friday and Stripe payouts are timing-mismatched.
Enjoyed the read? Join our team for a quick 15-minute chat — no pitch, just a real conversation on how we’re rethinking Ecommerce with AI - Luca
Loading Schedule...
Your AI Co-Founder is here.
Here’s why:
Shopify, Meta, Xero - one brain.
"Should I scale?" Answered with real data.
Growth capital. No applications. One click.
Thank you! Your submission has been received! Please book a time slot for the Meeting
Oops! Something went wrong while submitting the form.