Customer Lifetime Value Prediction: Models, LTV:CAC and Next Purchase
13
mins read
TL;DR
Predicted CLV forecasts each customer's margin over a set window, such as 12 months; Shopify's historical CLV is often just one first order in revenue.
Every CLV model answers two questions: how many more orders, and how much each is worth. BG/NBD and Gamma-Gamma need only recency, frequency, customer age, and spend.
Small stores should start with cohort curves; complex models tend to pay off only around 10,000 or more active profiles. Always backtest on a cutoff 12 months back.
Judge LTV:CAC on contribution margin, not revenue, and read it with payback. A 3:1 revenue ratio can be 1.2:1 on margin.
Set CAC ceilings per channel from predicted margin inside your cash window, and predict the next order from each customer's median reorder gap.
A second product category is the most underused CLV lever; one founder saw 50% to 100% higher LTV among body-care buyers.
It is Monday morning, and a founder of a men's grooming brand has Shopify's customer report open in one tab and Meta Ads Manager in the other. Shopify says customer lifetime value is $181. Meta wants another $20,000 this month. The bank balance says the last $20,000 has not come back yet.
That gap is what customer lifetime value prediction is for. Customer lifetime value prediction forecasts how much margin each customer will generate over a set future window, such as the next 12 months, using their own order history. It tells you what a customer is worth before they finish paying you back, which is the number your ad budget actually needs.
This guide sits inside Luca AI's wider work on predictive analytics for e-commerce. It covers the models, the LTV:CAC math, and how to predict the next purchase, in the order you would use them.
What is the difference between historical CLV and predicted CLV?
Historical CLV adds up what customers have already spent with you. Predicted CLV forecasts what each customer will spend, in margin, over a set future window such as 12 months. The difference matters because historical averages blend loyal old buyers with this quarter's new customers. A store can look healthy on the blended number while its newest cohort (the group of customers who first bought in the same month) never comes back.
⚠️ Why the Shopify number misleads
Most stores quote the CLV their platform shows them. In a 2025 Shopify Analytics walkthrough on YouTube, Brendan Gillen divided 589 orders by 578 customers and got 1.01 orders per customer. Multiplied by average order value, that produced a "lifetime value" of $181.
Look closely at that math. With 1.01 orders per customer, the $181 is basically one first order. It says nothing about the next 12 months, and it is revenue, not profit. This is the same trap covered in our breakdown of how Shopify LTV is calculated.
✅ What each version answers
Historical CLV vs Predicted CLV
Dimension
Historical CLV
Predicted CLV
Question it answers
What did customers spend?
What will each customer spend next?
Unit
Usually revenue, store-wide average
Margin, per customer or per cohort
Time window
Since the first order
A set future window (3, 6, or 12 months)
Best used for
Reporting and investor decks
Ad budgets, CAC caps, and retention timing
Microsoft's documentation for its customer insights product defines predicted CLV the same way: predicted value from active customers over a defined future period. The defined window is the part most store reports skip.
💸 The blended rate hides the leak
Blended averages hide cohort decay, the slow drop in how many customers from one month keep buying. AMP's 2023 analysis makes the point directly: a store with a large, loyal base can show a healthy returning-customer rate while new buyers barely return. The loyal 2022 customers carry the average, and the 2025 cohort quietly fails. Our guide to ecommerce customer lifetime value shows how that decay looks cohort by cohort.
Operators feel the tooling gap too. One r/shopify reply put it plainly:
"Shopify has built-in reports you can export, but on the lower-tier plans you only get the basics and you'll need to log in and pull them manually." r/shopify user, 2025, r/shopify Reddit Thread
Another operator in the same thread recommended piping data into Google Sheets or BigQuery before any analysis. That is a lot of work just to see the right number.
⭐ The position I take
Luca AI's read is that a CLV with no time window and no margin basis is not a number you can spend against. I would rather see a smaller, honest 12-month margin figure than a big lifetime revenue figure. The smaller number tells you what your ad account can afford this quarter. The bigger one only tells you what to put in a pitch deck.
Hormozi makes the same cut in $100M Offers: lifetime value is gross profit across all purchases, not revenue. Once you use margin (see contribution margin vs gross margin), prediction stops being a vanity exercise and becomes a budget tool.
✅ How Luca AI reads it
Luca AI connects Shopify, Klaviyo, Meta, and Google data and groups customers by first-order month. The operator can ask, in plain English, what March's new customers are likely to be worth by next March. That replaces the blended store figure with a cohort-level forecast, and Luca AI flags when a new cohort is tracking below the ones before it.
How does a CLV model actually work?
A CLV model splits the future into two questions: how many more orders will this customer place, and what will each order be worth? BG/NBD predicts order count and the probability a customer is still active. Gamma-Gamma predicts spend per order. Together they need only recency, frequency, customer age, and order value. Machine-learning models use more signals but need far more data.
✅ Three model families, in plain English
There are three honest ways to forecast customer value. Each trades simplicity for precision.
Cohort curves. Group customers by first-order month and track cumulative margin per customer over time. You project the next months from how older cohorts behaved.
Probabilistic models (BG/NBD plus Gamma-Gamma). These are often called "buy till you die" models. They assume each customer buys at their own rate until they quietly stop.
Machine-learning models. These learn value from many features at once, such as products bought, discount use, channel, and browsing.
⏰ How BG/NBD and Gamma-Gamma split the work
Fader, Hardie, and Lee introduced BG/NBD in 2005 in the journal Marketing Science. It reads three numbers per customer: frequency (repeat orders), recency (time since the last one), and T (customer age, meaning time since the first order). From those, it estimates future orders and the probability the customer is still "alive."
Gamma-Gamma then estimates average spend per order. The open-source BTYD and lifetimes libraries combine the two into a CLV forecast. One caveat matters: customers with few orders get pulled toward the store average.
💰 Which model fits your store
CLV Model Comparison by Store Size
Method
Data needed
What you get
Best fit
Cohort curves
Order export by customer
Margin per customer by cohort
Most stores under $5M
BG/NBD + Gamma-Gamma
Recency, frequency, age, and spend
Per-customer forecast and probability active
Repeat-purchase stores with steady order history
Machine learning
Many features, large history
Per-customer forecast using all signals
Large catalogs with data teams
Luca AI
Connected Shopify, ad, and cost data
Cohort and predictive answers in plain English
$1M to $40M stores without an analyst
Large companies do use machine learning. Expedia uses gradient-boosted trees, a method that stacks many small decision trees. Google researchers treat new-customer value as a regression problem using all customer features.
⚠️ Where the fancy model loses
The contested ground is small stores. Ivan Mazour's view, cited by Kunle Campbell in E-commerce Growth Strategy, is that complex predictive models give poor return until a brand has roughly 10,000 or more active profiles. Below that, cohort math and good post-purchase flows win.
Custom builds also age fast. Ari Tulla, CEO of ELO Health, said his company spent about $10 million building a data-to-meaning system, then LLMs arrived "10 times better."
✅ Where Luca AI sits
Luca AI is trained on how ecommerce variables relate to each other. It runs cohort and predictive work on a store's own connected history, so the operator never picks a library or writes SQL. The output is the forecast plus the reasoning, which is the part a spreadsheet or Python notebook leaves to you. That is the gap an AI data analyst for ecommerce is built to close.
How do you predict customer lifetime value, step by step?
To predict customer lifetime value, export order history by customer and strip out shipping, tax, and discounts. Then compute recency, frequency, customer age, and margin per order. Fit a purchase model and a spend model, or a cohort curve, over a 3-, 6-, or 12-month horizon. Finally, backtest the forecast against what customers actually did.
⏰ Before you start: do you have enough data?
Microsoft's guidance asks for at least 100 unique customers, and preferably more than 10,000. Under a few hundred repeat customers, stick to cohort curves. The probabilistic models need repeat behavior to learn from.
✅ The six steps
Export orders by customer. You need customer ID, order date, order value, and products. One row per order.
Clean the order value. Kunle Campbell's advice is to remove shipping, handling, and discounts from AOV (average order value), or you inflate the result.
Convert revenue to margin. Subtract product cost, pick and pack, shipping you pay, and expected returns. Hormozi excludes indirect costs like rent, admin, and software.
Compute the inputs. For each customer: frequency, recency, customer age, and average margin per order. Use the median, not the mean, for time between orders.
Fit and pick a horizon.Treasure Data's CLTV documentation lists 3, 6, or 12 months as the common forecast windows. Choose the one your cash cycle cares about.
Backtest. Train on data up to a cutoff, then compare the forecast with real behavior after it.
❌ The two most common mistakes
The first mistake is modeling revenue instead of margin. The second is skipping the backtest. Both produce a confident number that will not survive contact with your bank account.
💰 How to backtest without a data team
Expedia's team trains its model on a cutoff date 12 months in the past. You can copy that. Pretend it is a year ago, run the forecast, and compare it with what those customers actually spent since.
If the forecast was off by 40% for your best cohort, you know how much weight to put on it. If it was within 10% to 15%, you can start setting budgets with it.
Run the backtest by cohort, not just store-wide. A forecast can be accurate on average while it overestimates your newest, discount-heavy cohorts and underestimates your oldest ones. Those errors cancel out in the total and hurt you in the ad account.
⭐ What operators run into
The data plumbing is the real barrier. One r/shopify reply recommended moving data into Google Sheets or BigQuery through connectors before any analysis:
"I'd suggest starting simple with some tests using tools like Windsor.ai, Fivetran or Airbyte to move the data into Google Sheets or BigQuery, then visualize in Looker Studio." r/shopify user, 2025, r/shopify Reddit Thread
That works, but it is three tools before step four. Our guide to ecommerce data integration covers why that plumbing breaks so often.
✅ Where the hours go
Luca AI handles steps one to three on ingestion. It joins Shopify orders with cost and ad data and normalizes them, so the operator starts at the forecast instead of the cleanup. You still judge the backtest; Luca AI just removes the week of spreadsheet work before it. See how this fits into ecommerce data management more broadly.
How do you predict when a customer will buy next?
Use each customer's own median gap to time reminders, not a store-wide 90-day rule.
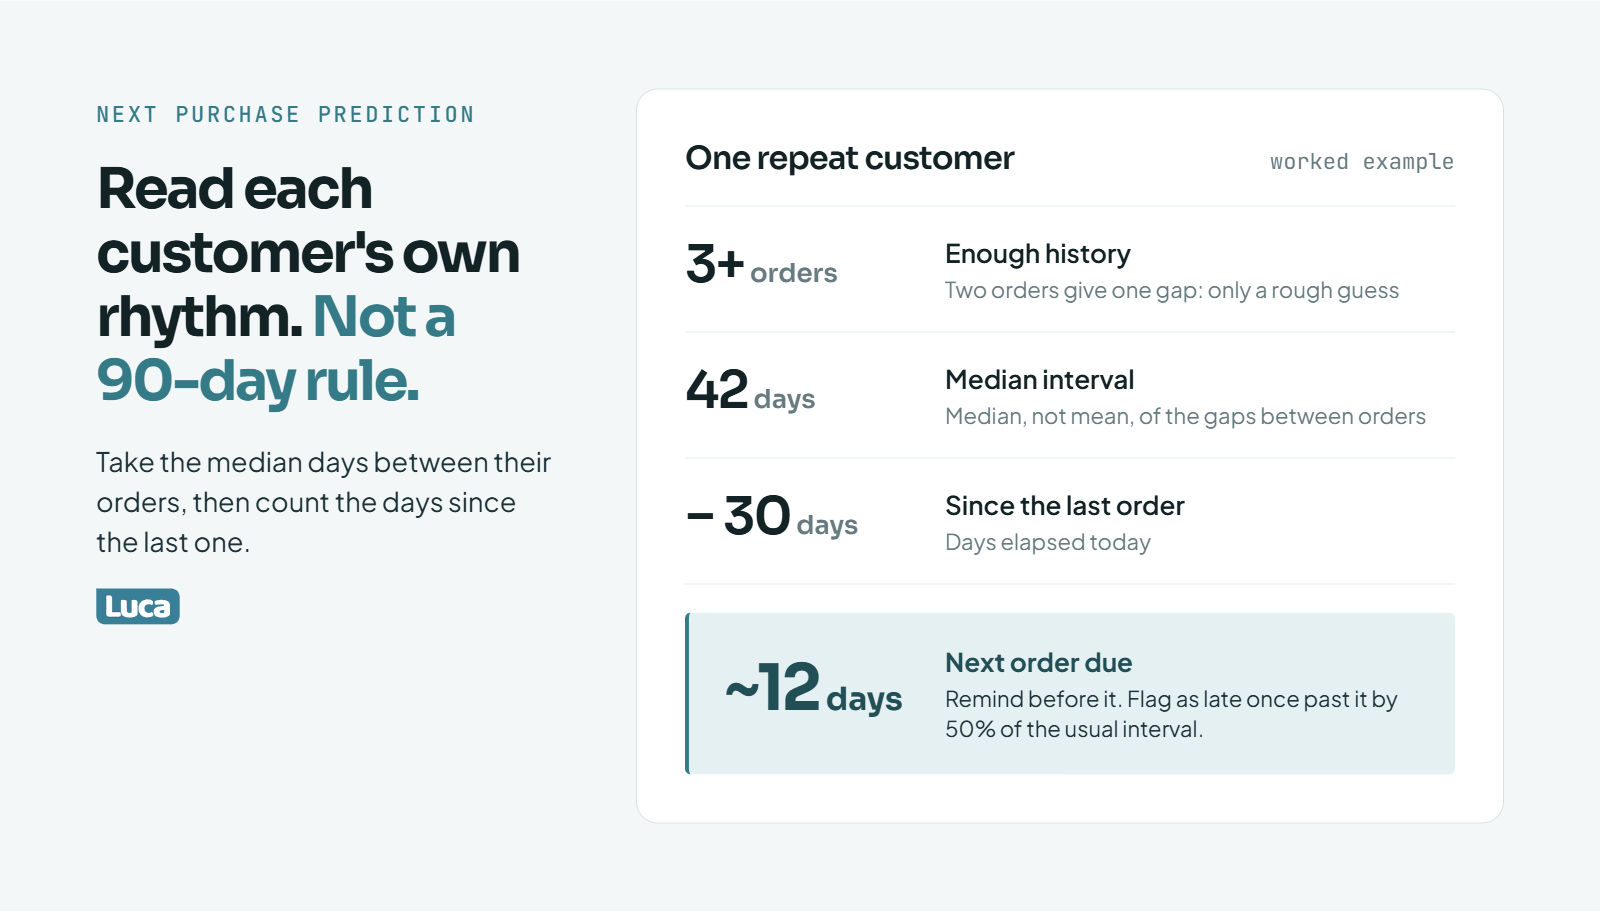
Predict the next purchase from each customer's own rhythm: the median days between their orders, adjusted for how long it has been since the last one. Probabilistic models add the probability that the customer is still active. Klaviyo shows an expected next order date once a profile has enough history. Message customers before that date, and treat anyone well past it as at risk.
⏰ Start with the median interval
The simplest method works surprisingly well. For each repeat customer, take the days between each pair of orders and use the median. Kunle Campbell recommends the median because a single very long or very short gap distorts the mean.
If a customer's median interval is 42 days and their last order was 30 days ago, their next order is due in about 12 days. That date becomes a trigger, not just a statistic.
⚠️ Speed matters more than level
Campbell cites research by Peter Fader and Wendy Moe on visit frequency. A customer with a high baseline who is visiting less often is less likely to convert. A customer with a low baseline who is visiting more often is more likely to convert.
So watch the direction, not just the level. A loyal customer whose gaps are stretching from 30 to 45 to 60 days is already leaving. Our customer churn analysis guide covers how to spot that drift early.
✅ What Klaviyo gives you
Klaviyo's predictive analytics shows an expected date of next order for each eligible profile. Its docs describe this as the date expected without intervention. The field stays blank when a profile lacks enough order history.
That limit matters for a store with many one-time buyers. The customers you most need to predict are often the ones with blank fields.
💰 Turning the date into flows
Replenishment: send a reminder a few days before the expected date for consumables.
Late signal: flag customers who pass their expected date by 50% of their usual interval.
Win-back: send a non-discount reason to return first, and save the discount for the second touch.
Suppress: stop paid retargeting for customers who are not yet due.
Campbell's RFM benchmark helps set the outer limit: for many industries, an order within four months counts as recent. For more flows built on this timing, see our ecommerce customer retention strategies.
⭐ My working rule
Luca AI's view is that a customer late against their own rhythm is a stronger churn signal than any store-wide 90-day rule. A 90-day rule treats a monthly buyer and a twice-a-year buyer the same. I could be wrong for very seasonal categories, where gift buyers break every pattern, but for consumables it holds.
For a two-order customer, the median is just one gap, so treat their date as a rough guess. Once a customer has three or more orders, the interval becomes reliable enough to drive a flow on its own.
✅ How Luca AI watches it
Luca AI watches cohort reorder timing continuously and pushes an alert to Slack or email when a segment slips past its usual reorder window. The operator hears about it in the week it starts, not at month-end. You then decide which flow to run. This is how Luca AI works as one of the ecommerce monitoring tools operators lean on.
What are purchase propensity scores and how should you use them?
A purchase propensity score is the predicted probability that a customer buys within a set window, or buys a specific product category. Predicted CLV says how much a customer is worth. Propensity says how likely they are to act now. Used together, they decide who gets a discount, who pays full price, and who gets nothing. The most valuable score is often propensity for a second category.
✅ The three scores worth building
Most stores only need three propensity scores. Each answers a different money question.
Three Propensity Scores and Their Uses
Score
Question it answers
Typical use
Purchase propensity
Will this customer order in the next 30 days?
Decide who needs a nudge and who does not
Category propensity
Will this customer buy from a second category?
Choose the cross-sell offer
Churn propensity
Has this customer likely stopped buying?
Trigger win-back or stop paid retargeting
Klaviyo's predictive analytics already scores churn risk and expected next order date for eligible profiles. Category propensity is the one most stores never build, and it is the one that moved LTV most in the cohort work below.
⭐ The finding that flips the usual playbook
Anthony Mink, CEO of Live Bearded, ran four or five cohort analyses on his store's data. He expected purchase frequency and new launches to drive lifetime value. Instead, product category diversity came out as the leading driver.
Customers who bought body care in addition to beard products showed roughly 50% to 100% higher LTV. In his words, his "secondary products are primary products to drive LTV." Post-purchase focus shifted from more of the same product to the next category.
💰 How the score changes what you send
Luca AI's read is that most post-purchase flows are built around frequency, not category. The flow says "buy again." The higher-value message is often "try this next."
A category propensity score tells you which second category each customer is closest to. Someone who bought beard oil and browsed soap is a better body-care prospect than someone who only opened one email. Send them the soap, not another oil reminder. Our guide to customer behavior analytics covers the browsing signals that feed this score.
❌ Do not discount the people who were going to buy
High purchase propensity is a reason to hold back a discount, not to send one. If a customer is 80% likely to reorder this month, a 15% code mostly gives away margin. Save discounts for high-value customers whose propensity is falling.
This is where propensity and CLV work as a pair. A high predicted CLV with falling propensity deserves effort. A low predicted CLV with high propensity needs no help.
⚠️ What I am still unsure about
Luca AI has seen the category effect clearly in consumables and personal care. I am less sure it holds for one-off durable goods, like furniture or electronics. There, the second category may just be accessories with thin margins. Test the score on your own cohorts before rewriting your flows around it.
✅ Running the category test
Luca AI can run the cross-category cohort comparison Mink ran by hand as one plain-English question: "Which second category raises 12-month margin per customer the most?" Luca AI then keeps watching it, and flags when a new cohort starts adopting the second category more slowly than the last. You decide which flow to change. This is conversational analytics for ecommerce applied to retention.
What is a good LTV:CAC ratio for ecommerce?
Recompute LTV:CAC on contribution margin before it touches a budget.
A good LTV:CAC ratio for ecommerce is about 3:1 or better, when LTV is measured on contribution margin over a fixed 12- to 24-month window. Read it next to CAC payback, because a 3:1 ratio that takes 14 months to recover cash can still starve a growing store. Luca AI calculates the ratio per channel by joining ad spend with Shopify orders and cost data.
💸 Where 3:1 comes from, and where it breaks
LTV:CAC compares what a customer is worth to what it cost to acquire them. CAC means customer acquisition cost: ad spend divided by new customers. Kunle Campbell notes in E-commerce Growth Strategy that a 3:1 or 4:1 ratio is common in ecommerce.
He also cites an average DTC customer lifetime value of $168, ranging from $55 for tea to $477 for CBD oil. Those ranges show why one universal ratio is risky. A tea brand and a CBD brand cannot carry the same CAC.
❌ The revenue ratio is a vanity ratio
Here is an illustrative example. A customer generates $210 in revenue over 12 months, and CAC is $70. That reads as 3:1. At a 40% contribution margin, the margin LTV is $84, and the real ratio is 1.2:1.
Contribution margin means revenue minus product cost, shipping, pick and pack, returns, payment fees, and service costs. Luca AI's position is that any LTV:CAC built on revenue should be recomputed on contribution margin before it touches a budget. Our guide on how to track ecommerce unit economics walks through each cost line.
⚠️ The invoice that changed the math
Supply Chain Lara, in her video "Profitable on Paper, Broke in Reality," describes a founder who called a knife set her best seller at a 72% gross margin. Line by line, contribution margin came to 8%. Returns added $6.20 per unit, customer service $1.45, and acquisition $31. She was losing $21.31 on every set sold.
Lara's summary is blunt: "Gross margin is a lie." It shows what it costs to make the product, not what it costs to sell it. Our breakdown of ecommerce profit margins shows where those hidden costs usually sit.
Platform dashboards can hide the same leak. One Triple Whale user wrote on G2:
"The dashboard part, for some reason the data is not correct, its as if the dont take into account returns or something, on the dashboard I get overestimated sales and ROAS." G2 reviewer, 3.5 stars, April 2023, Triple Whale - G2 Verified Review
The ratio says if a customer is profitable. Payback says when. Campbell cites Bain & Company research that the average ecommerce company takes about 12 months to break even on a new customer.
Eightx's 2026 benchmark puts median DTC CAC payback near 3.4 months. It calls 3 to 6 months good and over 12 months a red flag. Beauty and personal care runs 2 to 4 months there.
💰 The check to run this week
Take a cohort from 12 months ago.
Sum contribution margin per customer.
Divide by that month's blended CAC, then by channel CAC.
Note the month each channel's cohort crossed breakeven.
✅ Calculating it per channel
Luca AI joins Meta and Google spend with Shopify orders, returns, and cost data. LTV:CAC is then computed per channel on contribution margin, rather than read off one platform's dashboard. The operator asks, "What is 12-month margin LTV to CAC for Meta versus Google customers?" and gets the reasoning with the number.
How much can you spend to acquire a customer based on predicted CLV?
Set your maximum CAC from predicted contribution margin over the window your cash can carry. If a customer is forecast to bring $90 of contribution in 90 days and you want 1.5x coverage, the ceiling is $60. Set separate ceilings per channel, because a Meta customer and an email-captured customer rarely forecast the same. Reset them as each cohort's real results arrive.
⏰ Pick the window your cash can carry
The ceiling depends on how long you can wait to get paid back. A brand with tight cash should use a 60- or 90-day window. A brand with a cash cushion can use 6 or 12 months.
Luca AI's rule is simple: spend against the CLV you can bank inside your cash cycle. The year-three CLV you hope for does not pay this month's inventory bill. If you are unsure how long your cycle is, start with how to forecast cash flow for e-commerce.
💰 The formula
CAC ceiling = predicted contribution margin in your window ÷ coverage multiple
Predicted contribution margin comes from your CLV model (Q3).
The coverage multiple is your safety buffer. Use 1.5x for steady cohorts and 2x to 3x for new or volatile ones.
✅ Why some founders spend more than first-order profit
Ryan Daniel Moran, in 12 Months to $1 Million, tells the story of Joel Marion, who was willing to lose money up front. "If I know that I am going to make thirty dollars from a customer after ninety days, then I am willing to spend twenty-five dollars up front."
That is the formula in action: $30 of predicted 90-day value, a $25 ceiling, and about 1.2x coverage. It only works because the 90-day number was measured, not assumed.
⚠️ The front-end trap
Anthony Mink described spending almost 12 months focused on better ads, landing pages, and conversion rate. The front end improved. The real LTV lever, the second product category, sat untouched on the back end.
A CAC ceiling ties the two together. When predicted CLV rises, the ceiling rises, and you can outbid competitors on the same auction.
💸 Set ceilings per channel
Here is an illustrative example for one store:
Illustrative CAC Ceilings by Channel
Channel
Predicted 90-day contribution
Coverage
CAC ceiling
Meta prospecting
$54
1.5x
$36
Google branded search
$75
1.5x
$50
Influencer code
$36
2x
$18
If Meta CAC runs at $42, that channel is over its ceiling by $6, even if blended CAC looks fine. Blended numbers hide the channel that is burning cash. Channel-level views like this are the core of AI marketing analytics for ecommerce.
✅ Keeping the ceiling honest
Ceilings drift. Creative fatigue raises CAC, and discount-heavy promos lower predicted CLV. Recheck each ceiling monthly against the newest cohort's actual 30- and 60-day margin. If actuals land more than 20% below the forecast for two months running, lower the ceiling before you scale spend again.
✅ Watching the ceiling weekly
Luca AI can send a weekly CAC-by-channel report, with graphs and reasoning, against each channel's predicted-CLV ceiling. It also alerts in Slack or email when CAC spikes past a ceiling midweek. You still decide whether to cut, hold, or test new creative. That is automated ecommerce reporting tied to a real spending rule.
Which CLV segments should you build, and what do you do with each?
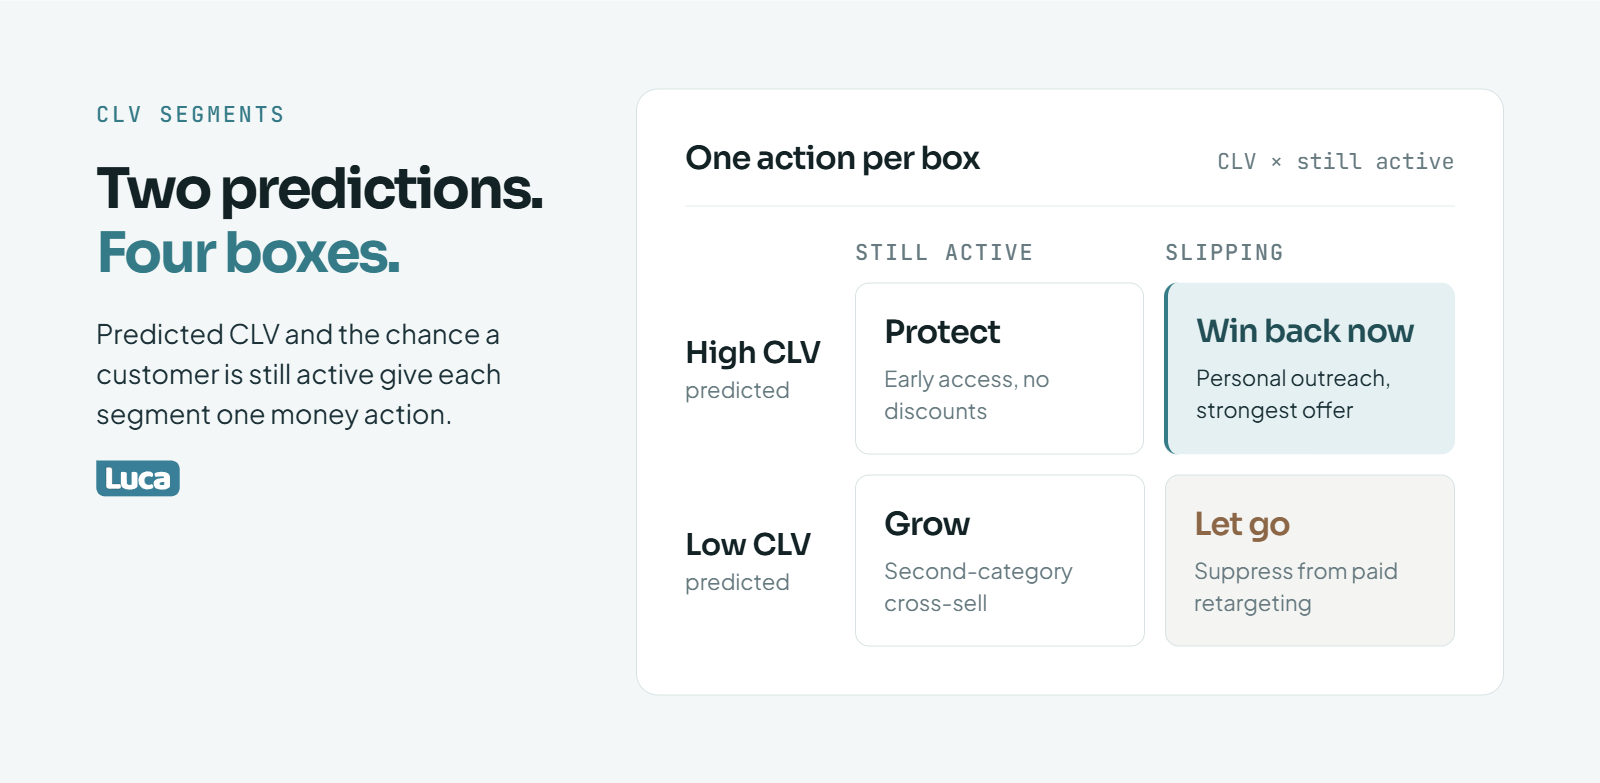
Two predictions give four segments, and each box gets exactly one money action.
Build four segments from two predictions: predicted CLV, high or low, and probability the customer is still active, high or low. High value and active: protect them and skip discounts. High value and slipping: win them back now. Low value and active: cross-sell a second category. Low value and slipping: stop paying to reach them. This grid replaces most segments a Klaviyo account accumulates.
✅ The four-box grid
CLV Segment Grid and Actions
Predicted CLV
Still active (high)
Slipping (low)
High predicted CLV
Protect: early access, no discounts
Win back now: personal outreach, strongest offer
Low predicted CLV
Grow: second-category cross-sell
Let go: suppress from paid retargeting
Each box gets one money action. If a segment has no clear action, it does not need to exist.
⭐ Why fewer segments win
Luca AI's view is that twenty RFM buckets nobody uses lose to four segments with clear actions. RFM stands for recency, frequency, and monetary value. It is a useful input, not a strategy. Our guide to ecommerce customer segmentation goes deeper on the inputs.
Campbell's RFM benchmark is a good anchor: for most brands, three purchases a year marks a frequent buyer. Use it to sanity-check who lands in the "active" column.
💰 What each box earns you
Protect. These customers carry your margin. Discounts here mostly give money away.
Win back. This is the highest-return box. A slipping high-value customer is worth a real offer and a personal email.
Grow. These customers are active but buy narrowly. A second category is usually the cheapest CLV gain (see Q5).
Let go. Retargeting them burns CAC twice. Keep them on cheap email only.
Tools already support this kind of split. One Glew user on G2 wrote:
"Glew gives our e-commerce business stronger analytical reporting than available in Shopify. It also allows you to segment and export customer data based on purchase frequency, product, and lifetime value." G2 reviewer, 3.5 stars, September 2019, Glew - G2 Verified Review
Exporting a segment is the easy part. Keeping it current is not. If you are weighing that trade-off, see our Glew alternatives comparison.
⚠️ The honeymoon problem: Day 1 churn
One group often lands in "low value, slipping" within weeks: discount-only buyers. Digital Darts calls them people "who would marry you for the honeymoon suite and file for divorce the next morning."
Brez cut its churn rate from 24% to 17% by planning for them, according to the Digital Darts breakdown. The brand told these customers up front that a real gift was coming in month two. The promise gave them a reason to stay past the first order.
✅ Applying it to your grid
Tag first orders that used a large discount code. Track how many move into "slipping" within 45 days. If the number is high, fix the offer before you fix the flow.
✅ Keeping the grid current
Luca AI keeps the four boxes updated from connected Shopify and Klaviyo data. It flags customers moving from "high value, active" to "slipping," which a static segment export cannot do. Luca AI surfaces the move; the operator chooses the win-back offer.
What actually raises predicted CLV?
Predicted CLV rises when you change the inputs the model reads: a faster second order, a second product category, less discount-driven early churn, and more margin per order rather than bigger baskets. Category expansion is the lever most stores underuse. In one founder's cohort analysis, buyers who added body care showed 50% to 100% higher lifetime value.
✅ Lever 1: a second product category
A CLV model reads frequency and spend. A customer who buys from two categories usually scores higher on both. Anthony Mink, CEO of Live Bearded, found category diversity was the leading LTV driver in his store. Body-care buyers showed about 50% to 100% higher LTV.
Luca AI's read is that this lever is cheap because the customer already trusts you. You are not buying attention again. You are pointing an existing buyer at the next shelf.
⭐ How to find your second category
Pull customers who bought two or more categories in their first 90 days. Compare their 12-month margin with single-category buyers. The category that shows up most often in the high-margin group is your post-purchase lead. Our guide to customer profitability analysis shows how to run that comparison.
⏰ Lever 2: a faster second order
The second order is where most CLV is won or lost. Luke Bean, CEO of Valente, shared his cohort numbers: about 20% of new customers make a second purchase within 30 days. By 12 months, roughly 65% to 75% have made multiple purchases.
Your numbers will differ by category. The point is to know your own 30-day second-order rate and push it up. Every week you shorten the gap moves predicted CLV and payback at the same time.
💰 What retention is worth
Campbell cites the classic Bain & Company finding: a 5% increase in retention can raise profit by 25% to 95%. Treat that range as directional. It still explains why a few points of second-order rate matter more than a few points of conversion rate.
⚠️ Lever 3: fewer customers who leave after one order
Some early churn is built into the offer. Discount-first buyers often never return (see Q8). Better onboarding helps the rest.
Campbell describes how Doe Lashes added a quiz asking if shoppers were new to false lashes. The answers personalized product picks and post-purchase emails. Revenue and satisfaction rose because beginners got beginner guidance.
⏰ Your tailwind from older cohorts
The Hammersley Brothers frame repeat buying as a tailwind in their video on ecommerce forecasting mistakes. In their example, about 30% of last year's buyers buy again this year. About 10% from two years ago return, and about 5% from three years ago. Knowing your own version tells you how much revenue you start each year with before any new ad spend.
💸 Lever 4: margin per order, not AOV
High AOV is not high CLV. A big first basket with heavy returns and no second category can be worth less than a modest one. Campbell's advice is to strip shipping, handling, and discounts from AOV before you trust it.
Raise margin per order instead. Bundle a high-margin item with a hero product. Set free-shipping thresholds that lift contribution margin, not just basket size. For more levers that compound, see our ecommerce growth strategy guide.
✅ Seeing which lever moved the forecast
Luca AI ties each lever back to the forecast, so the operator sees which change moved a cohort's predicted CLV and which did not. Ask, "Did the new body-care cross-sell flow raise 90-day margin for May's cohort?" Luca AI answers with the comparison and the reasoning. You decide whether to keep the flow. This is where ecommerce customer analytics turns into a decision.
What does a CLV prediction look like for a real store?
At $38, Meta CAC sits above both ceilings that 12 months of margin can safely support.
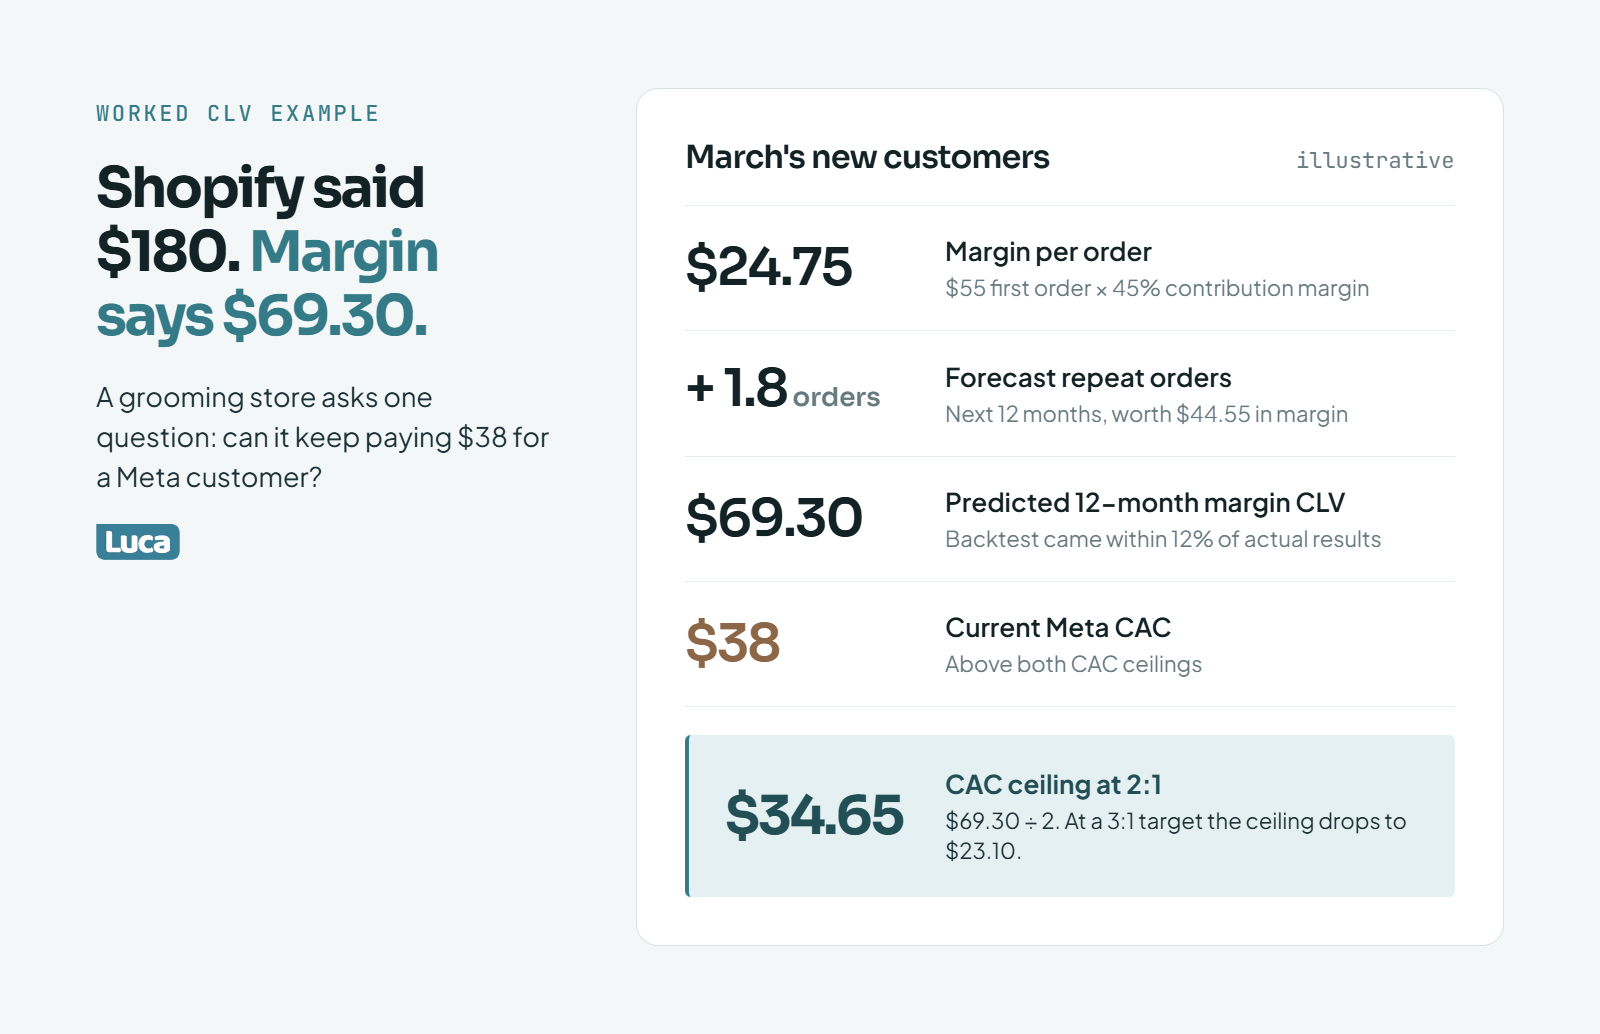
Here is an illustrative example. A grooming store has a $55 first order and a 45% contribution margin, so each order earns $24.75. If the model forecasts 1.8 more orders in 12 months, predicted 12-month margin CLV is $24.75 plus 1.8 times $24.75, which is $69.30. At a 3:1 target, the CAC ceiling is $23.10. At 2:1 with fast payback, it is $34.65.
✅ The situation
Meet a representative operator: a founder selling beard oil, balm, and soap on Shopify. The store does about $150,000 a month, and most new customers come from Meta. Shopify shows a CLV near $180, and Meta CAC has crept up to $38.
The founder wants to know one thing. Can the store keep paying $38 for a customer? The numbers below are an illustrative example, not a real store's data.
💰 Step 1: margin per order
Average first order, after removing shipping and discounts: $55
Contribution margin, after product cost, pick and pack, shipping, returns, and fees: 45%
Margin per order: $55 × 0.45 = $24.75
⏰ Step 2: the forecast
The founder runs a BG/NBD plus Gamma-Gamma model on two years of orders (see Q2). For March's new customers, the model forecasts 1.8 more orders over 12 months.
Repeat orders: 1.8 × $24.75 = $44.55
First order: $24.75
Predicted 12-month margin CLV: $69.30
A backtest on last year's March cohort came within 12% of actual results. That is close enough to set budgets with.
❌ Step 3: the CAC decision
Illustrative CAC Ceilings from Predicted CLV
Target
Calculation
CAC ceiling
3:1 on margin
$69.30 ÷ 3
$23.10
2:1 with fast payback
$69.30 ÷ 2
$34.65
Current Meta CAC
-
$38.00
At $38, Meta is above both ceilings. The store is paying more for a customer than 12 months of margin can safely support. The blended Shopify CLV of $180 hid that.
⭐ Step 4: the lever that changes the answer
The same model shows customers who bought soap within 60 days forecast 2.6 more orders, not 1.8. Their predicted CLV is $24.75 plus 2.6 times $24.75, which is $89.10.
At 2:1, that supports a $44.55 ceiling. Now the decision is not "cut Meta." It is "get more first-time buyers into soap, then Meta at $38 works."
The founder adds a soap sample to every first beard-oil order and tracks the 60-day soap rate weekly. If it climbs, the forecast and the ceiling climb with it.
⏰ Step 5: the next-order trigger
The cohort's median gap between orders is 45 days. The founder sets a reminder at day 40 and a late flag at day 68, about 1.5 times the usual gap. Customers past day 68 move into the win-back flow from Q8.
✅ Running the chain as one question
Luca AI can answer the same chain as one plain-English question against the store's real connected data: "What is predicted 12-month margin CLV for March's Meta customers, and what CAC does it support at 2:1?" Luca AI returns the figure, the ceiling, and the cohort comparison. The founder decides what to change. Track the inputs behind it with our list of ecommerce KPIs.
Which tools can predict customer lifetime value for an ecommerce store?
Luca AI predicts customer lifetime value across connected Shopify, ad platform, and cost data, and answers questions in plain English, so the forecast is in margin and by channel. Klaviyo gives a 365-day predicted CLV and expected next order date inside its email platform. Shopify Analytics shows historical cohorts but no forecast. Lifetimely, Triple Whale, and Glew report LTV with different focuses. Python's lifetimes library is free but needs an analyst.
✅ The tools, side by side
CLV Prediction Tools Compared
Tool
What it predicts or shows
Best fit
Where it stops
Luca AI
Cohort and predictive CLV in margin, by channel, in plain English
$1M to $40M stores without a data analyst
Not an attribution pixel; needs enough order history
Klaviyo
365-day predicted CLV, expected next order date, churn risk
Stores already running email on Klaviyo
Revenue-based; blank for thin profiles
Shopify Analytics
Historical customer and cohort reports
Early-stage stores
No forecast, limited exports on lower plans
Lifetimely
Cohort LTV and profit reporting for Shopify
Stores focused on cohort LTV
Reporting-first, not a reasoning layer
Triple Whale
Attribution with customer purchase journeys
Brands buying heavily on Meta
Attribution-first; CLV is secondary
Glew
Segment and export by frequency, product, and LTV
Teams that want exports
Reviewers report slow loads
Python lifetimes
BG/NBD and Gamma-Gamma CLV
Teams with an analyst
You build, clean, and maintain it all
⭐ 1. Luca AI
Luca AI connects Shopify, Meta, Google, Klaviyo, and accounting tools and normalizes the data on ingestion. The operator asks CLV, cohort, and CAC questions in plain English and gets the reasoning with the number. Luca AI also pushes proactive alerts when a cohort's reorder timing or CAC drifts. See Luca AI use cases for how operators apply it.
Luca AI is not an attribution pixel and does not replace one. It also does not fit enterprises that already run a data team.
✅ 2. Klaviyo
Klaviyo's predicted CLV estimates spend over the next 365 days, and it shows an expected next order date. The limit: predictions stay blank for profiles without enough order history, and values are revenue, not margin.
⚠️ 3. Shopify Analytics
Shopify shows historical customer and cohort reports. Operators often find it thin for forecasting, a gap covered in our roundup of the best Shopify analytics apps:
"Shopify has built-in reports you can export, but on the lower-tier plans you only get the basics and you'll need to log in and pull them manually." r/shopify user, 2025, r/shopify Reddit Thread
💸 4. Triple Whale and Glew
Both report well. A five-star Triple Whale reviewer praised a "clear overview of business metrics" in a February 2025 G2 review. A Glew reviewer liked the segmentation but noted:
"Sometimes the software is slow to load or glitchy with realtime results. I think the software could also offer better automatic & actionable insights." G2 reviewer, 3.5 stars, September 2019, Glew - G2 Verified Review
The open-source lifetimes and BTYD libraries implement BG/NBD and Gamma-Gamma for free. Ari Tulla's warning applies: his company spent about $10 million building a custom data system before LLMs outpaced it.
✅ Picking by stage
Under a few hundred repeat customers, start with Shopify cohorts and a spreadsheet. Klaviyo users can use its predicted CLV for flows. Luca AI fits the stage where you need margin-based CLV by channel and cannot justify an analyst. For a wider view of the category, see the best predictive analytics tools for ecommerce.
References
G2 reviewer, "Great for attribution," Triple Whale review, 3.5 stars, April 2023. G2
G2 reviewer, "Simple Shopify Integration with just a few clicks," Triple Whale review, 5 stars, February 2025. G2
G2 reviewer, "Powerful tool, product sales and audience analytics," Glew review, 3.5 stars, September 2019. G2
r/shopify user, comment on Shopify built-in reports and manual exports, 2025. Reddit
r/shopify user, comment on moving Shopify data into Google Sheets or BigQuery, 2025. Reddit
Anthony Mink, CEO of Live Bearded, interview remarks on cohort analysis and product category diversity.
Luke Bean, CEO of Valente, interview remarks on 30-day and 12-month repeat purchase rates.
Ari Tulla, CEO of ELO Health, interview remarks on a $10M data system and LLMs.
Klaviyo, "Guide to Klaviyo's predictive analytics," Klaviyo Help Center. Klaviyo
Fader, P., Hardie, B., and Lee, K. (2005). "Counting Your Customers the Easy Way: An Alternative to the Pareto/NBD Model." Marketing Science, 24(2).
Wang, X., Liu, T., and Miao, J. (2019). "A Deep Probabilistic Model for Customer Lifetime Value Prediction." arXiv:1912.07753
AMP, "Why cohort analysis beats all other approaches to calculating LTV," 2023. AMP
Matt Putra, "CAC payback period benchmark: the number that beats ROAS," Eightx, July 2026. Eightx
Kunle Campbell, E-commerce Growth Strategy, citing Bain & Company, Reichheld and Schefter, Peter Fader and Wendy Moe, Ivan Mazour, and Doe Lashes.
Alex Hormozi, $100M Offers.
Ryan Daniel Moran, 12 Months to $1 Million, citing Joel Marion.
Supply Chain Lara, "Profitable on Paper, Broke in Reality: The Math You're Avoiding," video.
Digital Darts (Nick Shackelford), "How To Scale Your Shopify Store So FAST It feels ILLEGAL," video.
Hammersley Brothers, "The Ecommerce Forecasting Mistake That Kills Growth," video.
Brendan Gillen, "Shopify Analytics 2025 For Beginners. Everything You NEED To KNOW!" video.
Microsoft, "Predict customer lifetime value (CLV)," Dynamics 365 Customer Insights documentation. Microsoft Learn
Expedia Group Technology, "Expedia Group's Customer Lifetime Value Prediction Model." Medium
Treasure Data, "Customer Lifetime Value (CLTV) Forecasting," product documentation. Treasure Data
FAQ's
How accurate is customer lifetime value prediction for a small Shopify store?
Accuracy depends mostly on how much repeat history you have, not on which model you pick. Luca AI's approach is to treat a store with a few hundred repeat customers very differently from one with tens of thousands.
Under a few hundred repeat customers: we use cohort curves. Per-customer forecasts are too noisy to trust.
A few thousand repeat customers: BG/NBD plus Gamma-Gamma starts to work, especially for consumables with steady reorder cycles.
Around 10,000 active profiles or more: richer machine-learning models begin to earn their cost.
The only honest way to know your accuracy is a backtest. We pretend it is a year ago, run the forecast, and compare it with what those customers actually spent. If the error is within 10% to 15% for your main cohorts, we are comfortable setting budgets with it. If it is 40% off, we use the forecast for direction only.
We also check accuracy by cohort, not just store-wide. A forecast can look right on average while it overestimates discount-heavy cohorts. For the groundwork behind this, see our guide to predictive analytics for e-commerce.
Should customer lifetime value be calculated on revenue or profit?
We calculate customer lifetime value on contribution margin, not revenue. Revenue LTV tells you how much a customer spends. Margin LTV tells you how much you can afford to pay to acquire them.
Contribution margin is revenue minus the costs that move with each order:
Product cost and landed cost
Pick, pack, and shipping you pay
Returns and refunds
Payment fees and customer service time
Indirect costs like rent, software, and salaries stay out, because they do not change with one more customer.
The difference is large. In an illustrative case, a customer worth $210 in revenue at a $70 CAC looks like 3:1. At a 40% contribution margin, the real figure is $84, or 1.2:1. That is the gap between scaling and slowly running out of cash.
Luca AI joins Shopify orders with cost, returns, and ad data so the margin version is the default view, not a spreadsheet project. Our breakdown of contribution margin vs gross margin covers each cost line in more detail.
How often should we update customer lifetime value predictions?
We refresh CLV predictions monthly for most stores, and weekly for the signals that move fast. The model itself does not need retraining every week, but the inputs do.
Monthly: refit the purchase and spend models with the latest month of orders. Compare each new cohort's early results with the forecast.
Weekly: watch CAC by channel against your CLV-based ceiling, and track reorder timing for key segments.
After big changes: rerun the forecast after a major promotion, price change, or new product category launch. These shift behavior faster than a monthly cycle catches.
A useful rule is to lower your CAC ceiling if a cohort's actual margin lands more than 20% below forecast for two months running. That keeps the prediction honest without constant tinkering.
Luca AI handles the weekly layer through proactive alerts. It flags when a cohort slips past its usual reorder window or when CAC spikes past its ceiling, so the operator does not have to open a dashboard to notice. See how this works in our guide to automated ecommerce reporting.
Does customer lifetime value prediction work for subscription brands?
Yes, but the model changes. Subscription revenue is contractual: the customer tells you when they leave by canceling. Probabilistic models like BG/NBD are built for non-contractual buying, where customers quietly stop without telling you.
For subscription brands, we use different tools:
Survival or retention curves: track what share of each starting cohort is still subscribed at month 1, 2, 3, and beyond.
Margin per billing cycle: multiply surviving subscribers by contribution margin per shipment.
One-off add-ons: model these separately, since they behave like normal repeat orders.
One warning: subscription renewals inflate repeat purchase rate if you mix them with one-time orders. A store that blends the two can think its retention is strong when it is really just billing. We keep them apart.
Early churn matters even more here. Many subscription brands lose a large share of customers after the first discounted box, so we watch month-one and month-two retention closely. You can ask Luca AI to split subscription and one-time orders into separate cohort views, so each gets the right model. Our guide to customer churn analysis covers the retention side in depth.
Can you predict lifetime value for a customer after only one order?
Yes, but not from that customer's own history. After one order, there is no rhythm to read yet. We predict first-order customers from the behavior of similar customers who came before them.
The signals that help most at the first order:
Acquisition channel: customers from search, email, and referrals often behave differently from paid social buyers.
Discount use: heavy first-order discounts often predict lower repeat rates.
Product category: some first purchases lead to a second category far more often than others.
Basket size and margin: margin per order matters more than order value.
We group new customers by these traits and use the matching cohort's curve as their starting forecast. Once they place a second or third order, their own rhythm takes over. That second order is the moment the prediction becomes truly individual.
This matters because your CAC decision happens at the first order, not the third. You can ask Luca AI to build these first-order cohort forecasts from connected Shopify and ad data, so the operator can see what each new channel's customers are likely to be worth early. For more on reading early signals, see our guide to customer behavior analytics.
Enjoyed the read? Join our team for a quick 15-minute chat — no pitch, just a real conversation on how we’re rethinking Ecommerce with AI - Luca
Loading Schedule...
Your AI Co-Founder is here.
Here’s why:
Shopify, Meta, Xero - one brain.
"Should I scale?" Answered with real data.
Growth capital. No applications. One click.
Thank you! Your submission has been received! Please book a time slot for the Meeting
Oops! Something went wrong while submitting the form.