E-commerce Demand Forecasting: Methods, Seasonality and Templates
13
mins read
TL;DR
Forecast demand, not sales: stockout weeks understate demand and promo or viral weeks overstate it, so clean the history before choosing any model.
Match the method to the SKU: averages or smoothing for evergreen items, a seasonal index or Holt-Winters for seasonal items, and analogs for launches.
A seasonal forecast is baseline times seasonal index; plan BFCM as its own week and place the purchase order a full lead time earlier.
Forecast promotions as baseline times lift minus the pull-forward dip, and tag promo weeks so they never inflate the baseline.
Turn the forecast into a reorder point, an order size, and a cash timeline, then score it weekly with WAPE and bias against a naive forecast.
A spreadsheet template is the right start; at scale, the real cost is the weekly refresh across SKUs and channels, not the math.
Every October, someone at a Shopify brand opens last year's sales export, sees a quiet month, and trims the buy. Then November arrives, and the bestseller is gone a week before Black Friday. The export was not wrong. It just recorded what the store had in stock, not what customers wanted.
Ecommerce demand forecasting fixes that by estimating weekly units per SKU from clean history, seasonality, promotions, and channel data, so purchase orders go out before demand arrives. This guide covers the methods, the seasonal and promo math, a build-it-yourself template, and one worked example. It is one part of predictive analytics for e-commerce, and the part where most of the cash moves.
What does ecommerce demand forecasting actually predict, and why is your sales history lying to you?
Ecommerce demand forecasting estimates how many units of each SKU (stock keeping unit, one sellable variant) customers will want in each future week, whether or not you have stock. That target is called unconstrained demand. Sales history understates it whenever a SKU was out of stock, and overstates it during promotions or viral spikes. A forecast built on raw sales repeats last year's mistakes at a larger scale.
📦 The Monday export that started the wrong buy
Picture an operations lead at a Shopify skincare brand pulling last year's units for a hero moisturizer. October shows 410 units. It looks like a slow month, so the buy for this October gets trimmed.
But that SKU was out of stock for 11 days in October. Customers wanted it. The store simply had nothing to sell. Shopify recorded what shipped, not what people tried to buy.
⚠️ Sales are a record of supply, not of demand
Every number in your order export is capped by what you had on the shelf. When stock hits zero, the sales line goes flat, and the forecast learns that demand went flat too. Skymetrics makes the same point in its Shopify forecasting guide: compare forecasts only against unconstrained actuals, because a stockout makes demand look smaller than it was (Skymetrics).
The opposite error comes from spikes. The Hammersley Brothers describe a "Netflix effect" on a tallow face cream, where a documentary sent demand up and then back down. Their advice is to "build last year's figures without that boost," or the forecast comes out "radically wrong".
❌ Stockout weeks: sales understate demand
❌ Promo and viral weeks: sales overstate baseline demand
✅ Clean weeks: the only honest input for a baseline
💸 Why this is a cash problem first
Forecast errors do not stay in a spreadsheet. Brendan Gillen calls an ecommerce business "a cash eating monster," with stock "sitting on the water for 3 months and all our money is tied up". Underbuy a bestseller, and you lose sales plus ad momentum. Overbuy a slow SKU, and the cash sits in a warehouse.
The team at TaxCloud and Settle put it as two train tracks: "One side is your inventory, the other side is your cash". The demand forecast is the thing that keeps both tracks parallel.
🧭 What the forecast feeds downstream
A clean demand forecast feeds four decisions: what to reorder, when to place the purchase order, how much safety stock to hold, and how much cash to set aside. Every later section in this guide builds on that one number per SKU per week.
One founder put the frustration plainly on Reddit:
"I run a fashion brand on Shopify and built an analytics app after getting frustrated with how hard it is to understand product-level performance, especially once returns and stock risk come into play." Reddit user, r/ShopifyAppDev Reddit Thread
Luca AI connects Shopify, ad platforms, Klaviyo, accounting, and 3PL data, and normalizes it on ingestion. That means stockout days and promo weeks can be flagged in one place before anyone fits a model. You can ask Luca AI which weeks a SKU was out of stock and get the list, instead of rebuilding it from three exports.
Which demand forecasting methods work for an online store: time series or machine learning?
Most stores need three demand forecasting methods, not one. Use a moving average or exponential smoothing for steady evergreen SKUs, and a seasonal method such as Holt-Winters or a seasonal index for SKUs with a yearly cycle. Use analog products and judgment for launches. Machine learning demand forecasting earns its keep only with hundreds of SKUs, two or more years of clean history, and drivers such as ad spend and price.
📉 Why the 30-day average fails first
The default method in most stores is a trailing average: units sold in the last 30 or 60 days, divided by days. It is fast and easy to explain. It also breaks on any SKU with a season.
A Shopify Community post from the forecasting app team at DemandMind states the problem directly (Shopify Community):
"A simple 30-60 day average often underestimates peaks and overestimates off-season demand." DemandMind, Shopify Community Community Thread
In plain terms, the average always looks backwards. In September it tells you about August, right before demand doubles.
🔁 Smoothing and Holt-Winters
Exponential smoothing is an average that weighs recent weeks more than old ones. Holt-Winters extends it with two more parts: a trend (is demand growing?) and a season (which weeks run hot?). Excel's FORECAST.ETS function runs a version of this, so you can use it without code.
ARIMA and Prophet are statistical time series models. ARIMA models how each week relates to past weeks. Prophet, an open-source tool from Meta, handles holidays and multiple seasons well. Both need a year or more of clean weekly data.
🤖 Where machine learning fits, and where it does not
Machine learning models learn from many inputs at once: price, discount depth, ad spend, email sends, and weather. That power needs volume. With 40 SKUs and 18 months of messy data, a model mostly learns your stockouts.
Deb Farnworth-Wood, CEO of Issada, tested her inventory system's built-in AI forecasting for about six months. "We couldn't rely on it," she said, describing it as "hallucinating and telling fibs" before her team shut it down. Her team now exports the data and analyzes it in a general AI assistant instead.
🗂️ Pick the method by SKU type
Demand forecasting method by SKU type
SKU type
Method
Minimum clean history
Evergreen, steady
Moving average or exponential smoothing
8 to 12 weeks
Seasonal
Seasonal index or Holt-Winters
52 weeks (one full cycle)
New launch
Analog SKU plus judgment
None, use a similar product
Intermittent (slow, lumpy)
Average demand per sale event, reviewed monthly
26 weeks
Large catalog with drivers
Machine learning
2+ years, hundreds of SKUs
Luca AI's read is that most stores below $10M should earn complexity, not start with it. A seasonal index you understand beats a model you cannot check. You can ask Luca AI in plain English which SKUs behave seasonally, and it compares velocity across periods without SQL or a built model.
What data do you need before you can forecast demand?
You need weekly net units by SKU or variant, stockout days, price and discount per week, promo and ad-spend calendars, returns, and supplier lead times. With fewer than 8 to 12 clean weeks, use an analog instead of a model. Use the median, not the mean, for lead times so one late container does not inflate every order.
🧾 The minimum dataset per SKU
Net units per week, by variant. Gross orders minus returns and cancellations. Skymetrics notes that returns and cancellations are demand that did not stick (Skymetrics).
Stockout flag. Days per week with zero available stock.
Price and discount. The actual selling price, not the list price.
Promo calendar. Every sale, bundle, and influencer push, with dates.
Lead time per supplier. Order date to sellable date, logged per PO.
🧹 Cleaning rules that matter more than the model
Strip shipping and discounts out of revenue figures. Kunle Campbell advises removing shipping, handling, and discounts from average order value "to avoid an inflated view". The same logic applies to demand: count units, not inflated revenue.
Next, remove or adjust flagged weeks. Replace stockout weeks with the average of nearby in-stock weeks. Tag promo weeks so they never feed the baseline.
⏰ Lead time: use the median
Kunle Campbell also recommends median, not mean, lead times, to "eliminate large outliers". Example (illustrative): five POs took 8, 9, 9, 10, and 21 weeks. The mean is 11.4 weeks. The median is 9. Planning to 11.4 weeks ties up extra cash on every order. Hold the long tail in safety stock instead.
📤 Where the data actually lives
Most of this is scattered. Richie Jones, CEO of VAST, remembers early days that were "so Excel based," with "exports from Shopify, exports from returns system" every Monday. Reviewers say the same about native reports:
"Shopify has built-in reports you can export, but on the lower-tier plans you only get the basics and you'll need to log in and pull them manually." Reddit user, r/shopify Reddit Thread
Even paid tools can trip on the basics. One Polar Analytics customer reported that "our inventory is multiplied with 6, since we have 6 different shopify stores connected to the same warehouse" (Trustpilot):
"I've also reported an issue with inventory levels... it has taken them closer to 1,5 month, and I've still not received a solution." Maja, Trustpilot Review
Luca AI pulls Shopify, Klaviyo, ad platforms, accounting, and 3PL data into one source of truth and normalizes it on ingestion. That replaces the Monday export routine with a question: ask Luca AI for weekly net units by variant with stockout days flagged.
How do you forecast seasonal demand and BFCM peaks?
A seasonal index plans November at 792 units; a flat 30-day average would fall 352 units short.
Seasonal demand forecasting multiplies a clean baseline by a seasonal index for each period, then adjusts for growth. Build the baseline from normal weeks and compute the index from at least one full year of history. For BFCM (Black Friday and Cyber Monday), forecast the peak week separately and work backwards from lead time, because the order that matters is placed months before November.
📐 The seasonal index, step by step
Shopify's seasonal forecasting guide gives the core formula: the seasonal index is actual demand for a period divided by average demand across all periods, and "Seasonal Forecast = Base Demand × Seasonal Index" (Shopify).
Take 12 months of clean monthly units.
Find the monthly average.
Divide each month by that average. That is the index.
Multiply next year's baseline by each month's index.
Adjust for growth you can defend.
🧮 Worked example (illustrative)
A SKU sold 4,800 clean units last year, so the monthly average is 400. November sold 720 units, so its index is 720 ÷ 400 = 1.8. February sold 280, so its index is 0.7.
This year's baseline is running 10% higher, at 440 a month. November forecast: 440 × 1.8 = 792 units. February forecast: 440 × 0.7 = 308 units. A flat 30-day average taken in October would have planned November at roughly 440, short by 352 units.
🦃 Treat the BFCM week as its own forecast
Monthly indexes blur the peak. Forecast the BFCM week separately, from last year's BFCM week, adjusted for this year's offer and ad budget. Then work backwards.
Example (illustrative): supplier lead time is 10 weeks, freight and receiving add 3 more. Stock must be sellable two weeks before Black Friday to cover early deals. That puts the purchase order about 15 weeks before Black Friday, in mid-August.
⚠️ The cost of optimism
Elyse Breanne Design ordered 3,600 Halloween cases in April for a window of about four weeks. Looking back, she said, "I was very optimistic". The Hammersley Brothers describe the fix as turning stock orders into "an asymmetrical bet," where "heads I win a lot, tails I don't lose much". Size seasonal buys so a miss is survivable, and plan a reorder for the bestsellers instead of one big bet.
Cyndi Thomason adds a cash rule: keep a separate inventory account and build it up before the season, because "the inventory account is sacred".
Luca AI studies performance across months and years and flags when a seasonal SKU's run rate departs from its usual curve. That gives the reorder call weeks earlier than a monthly review would.
How do you forecast a promotion without wrecking your baseline?
Subtract the post-promo dip: the sale adds 126 units of demand, not the 180 the promo week suggests.
Promotion forecasting treats a sale as baseline demand times a lift factor taken from comparable past promos, minus the dip that follows when customers bought early. Tag every promo week in your history and keep it out of the baseline. If you do not, each sale inflates next month's forecast, and you end up overstocked on the exact SKUs you just discounted.
🏷️ The spreadsheet that learned the wrong lesson
Here is the pattern I see most often. A brand runs a 25% off weekend in March. Units triple. Nobody tags the week, so the trailing average jumps. April's reorder is sized off a number that only existed because of the discount.
Six weeks later, the warehouse holds two months of stock for a SKU that is back to normal speed. The promo worked. The forecast did not.
✅ Baseline × lift, then subtract the dip
The method has three parts:
Baseline. Normal weekly demand with promo and stockout weeks removed.
Lift factor. Promo-week units divided by baseline units, taken from past promos with similar depth and channel.
Pull-forward dip. The drop in the weeks after, when buyers who stocked up stay away.
Amazon seller guides give the same instruction for velocity: exclude one-off promotion spikes and stockout-recovery periods from the average (SupplyKick).
🧮 Worked example (illustrative)
A SKU's baseline was 100 units a week. Last year's 20% off promo sold 250 units that week, so the lift factor is 2.5. The two weeks after sold 70 and 85 units, or 0.70 and 0.85 of baseline.
This year's baseline is 120. Promo week forecast: 120 × 2.5 = 300 units. The following two weeks: 120 × 0.70 = 84, and 120 × 0.85 = 102. The net extra demand across the three weeks is 300 + 84 + 102 - 360 = 126 units, not the 180 the promo week alone suggests.
⚠️ Cannibalization and the spike you did not plan
Discounting one SKU often steals from its siblings. If a bundle goes on sale, forecast a lower week for the single units inside it.
Then there are spikes nobody scheduled. The team at Common Thread Collective points to the moment Deion Sanders wore Blenders Eyewear sunglasses at a conference, and notes that "sometimes you have an ad that just pops off". Treat these like promos. Tag them, measure them, and keep them out of the baseline.
📣 What to do with your promo calendar
Put next quarter's planned promos into the forecast before the PO goes out, not after. Each promo row needs a date, depth, channel, and expected lift. Without that row, the buyer guesses.
How do you forecast a new product with no sales history?
Forecast a launch from an analog: the closest existing SKU's first 8 to 12 weeks, scaled for price and audience. Cap the first order and reorder from early sell-through. Pre-orders, waitlists, and email click rates sharpen the estimate. Work backwards from target price and required profit to set the budget you can afford to risk.
🔍 Pick the right analog
An analog is an existing product similar enough that its launch curve is a fair guide. Match on price band, category, audience, and launch support. A new serum is a better analog for a new serum than your bestselling cleanser.
If the analog launched with a big email push and the new product will not, scale it down. If the price is 20% higher, expect fewer units.
🧮 Worked example (illustrative)
The analog SKU sold 600 units in its first 10 weeks. The new product sits at a higher price, so you scale to 0.8, or 480 units. Instead of buying all 480, you buy 250 and set a reorder trigger at 60% sell-through.
If 150 units sell in the first four weeks, the trigger fires early and the reorder is sized from real data. If they do not, you are holding 250 units, not 480.
📨 Signals before launch day
Waitlist sign-ups. Count them, then apply your usual waitlist-to-order rate.
Pre-orders. Real demand with a payment attached.
Email clicks on the teaser. A rough interest signal, weaker than pre-orders.
Wholesale commitments. Shopify's seasonal guide notes that signed wholesale deals belong in the forecast (Shopify).
💰 Set the budget from profit, not hope
Cyndi Thomason describes a seller who starts every launch with two numbers: the expected sales price and the profit he needs. "Then he subtracts the desired profit from the expected price. What remains is the budget to get the product made and ready for market".
That budget caps the first buy. It matters more in size-run categories. Jen Van Wart, CEO of Twigs, explains that one denim style across sizes is "a $6,000 commitment" for her stores. Multiply that by four new styles, and a wrong guess is a season's margin.
⏰ Make the first buy small enough to be wrong
My read is that operators overbuy launches because reorders feel slow. A short-lead reorder costs less than dead stock. If your supplier lead time is long, negotiate a split order: a first batch now, the second released on a sell-through trigger.
What is the difference between sales forecasting and demand forecasting?
Demand forecasting predicts the units customers want per SKU, regardless of stock. Ecommerce sales forecasting predicts the revenue you will actually book, after stock limits, price, discounts, and returns. Buy inventory from the demand forecast. Plan cash, hiring, and financing from the sales forecast. Mixing them makes you underbuy after every stockout.
⚖️ Side by side
Demand forecast vs sales forecast
Measure
Demand forecast
Sales forecast
Unit
Units per SKU per week
Revenue per period
Capped by stock?
No
Yes
Includes discounts and returns?
No, demand only
Yes
Main use
Purchase orders, safety stock
Cash plan, budgets, financing
Owner
Operations or buyer
Founder or finance
Shopify's retail guide draws a similar line between forecasting future orders and planning, which turns forecasts into buying, staffing, and fulfillment decisions (Shopify).
🔄 How they connect
Run demand first. Then cap it by the stock you expect to have, apply prices and expected discounts, and subtract returns. The result is the sales forecast. Example (illustrative): demand is 1,000 units, but only 850 will be in stock. At $40 net price with 8% returns, the sales forecast is 850 × $40 × 0.92 = $31,280.
If you forecast sales directly from last year's revenue, every stockout gets baked in as lower demand. You buy less, stock out again, and the loop repeats.
💸 Why revenue is still not profit
Neither forecast tells you what you keep. Supply Chain Lara puts it bluntly: "Gross margin is a lie. It only tells you what it costs to make the thing. It tells you nothing about what it costs to sell the thing". Shipping, fulfillment, returns, and acquisition cost all sit between the sales forecast and cash in the bank.
Luca AI reads Shopify, ad spend, and accounting data together, so a demand forecast and the margin behind each SKU can be checked in one question rather than two spreadsheets.
How do you forecast demand on Shopify and Amazon?
On Shopify, export weekly net units by variant and forecast in a sheet or an inventory app, since Shopify's standard reports show history rather than a demand forecast. On Amazon, Seller Central's restock tools suggest reorder quantities from recent sales velocity. Forecast each channel separately, add Amazon receiving time to your lead time, then sum demand against shared stock.
🛍️ The Shopify workflow
Export sales by variant, weekly, for at least 52 weeks.
Add inventory history so stockout weeks can be flagged.
Shopify's own guide to demand forecasting software lists the data an ecommerce forecast should draw on: online, POS, marketplace, inventory, and returns data (Shopify).
📦 Amazon sales forecasting
Amazon's restock tool "looks at recent sales velocity and suggests reorder quantities," and SupplyKick advises using it "as a sanity check, not as your only forecasting input" (SupplyKick). Pull units for the last 30, 60, and 90 days to see recent shifts and smoothed trends.
Lead time on Amazon is longer than your supplier's. SupplyKick lists Amazon receiving time and the time from "receiving" to "available" as extra steps. "Add all of those up. That is your real lead time" (SupplyKick).
🔗 Combining channels against one stock pool
Example (illustrative): a SKU sells 60 units a week on Shopify, 40 on Amazon, and 20 through wholesale. Total demand is 120 a week from one pool. Amazon stock needs 13 weeks of cover (8 supplier, 3 freight, 2 receiving), while Shopify stock from your own warehouse needs 11.
Forecast each channel on its own curve. Amazon peaks on Prime Day, and your DTC site peaks on your own promos. Then add them up for the purchase order.
Stock location matters too. Nicolo Grange describes keeping about 3,000 labels stocked locally for express shipping, while the other 7,000 ship on a "15 to 20 days" lead time. Forecast fast-moving SKUs for the short-lead location first.
"Although Amazon Sales can be integrated with Triple Whale, there are many functionalities that do not take this sales channel in consideration making it hard to consolidate information... Sales velocity and stock demand calculations." Verified reviewer (Triple Whale) G2 Verified Review
Luca AI connects multiple sources into one place, so Shopify and marketplace demand sit in one view. You can ask Luca AI for combined weekly units for a SKU across channels, and it answers from the unified data rather than separate exports.
How do you turn a demand forecast into a buying plan and a cash plan?
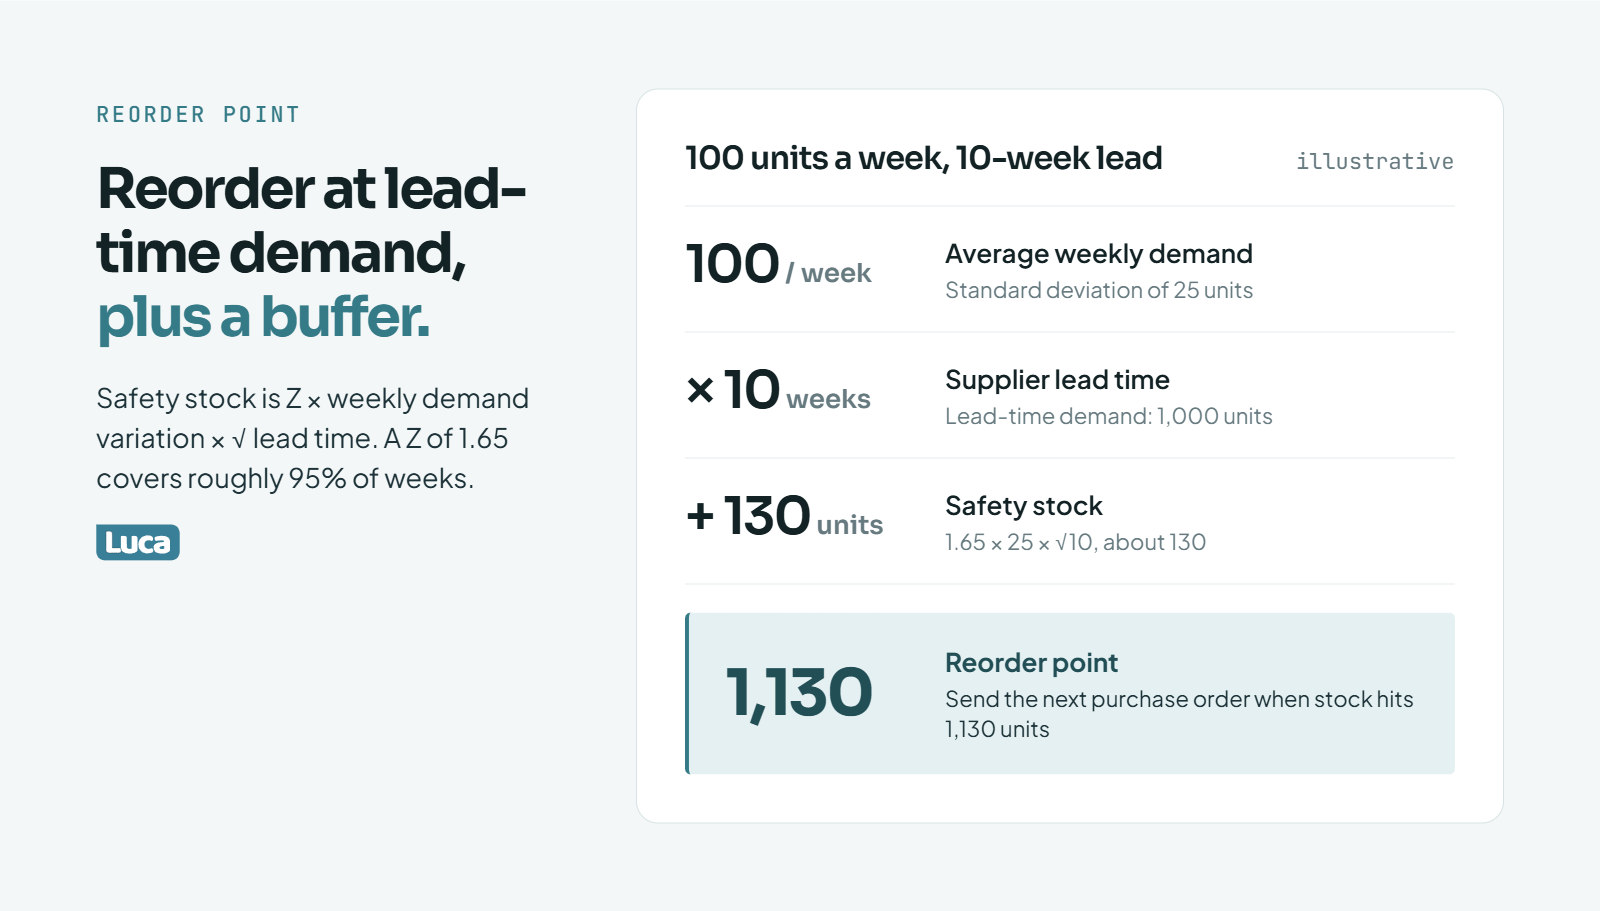
Reorder when stock covers lead-time demand plus a safety buffer, here 1,130 units.
Turn weekly demand into a reorder point (demand during lead time plus safety stock), size the order to cover demand until the next arrival, and map payment dates against expected sales. A demand forecast is only useful when it tells you three dates: when cash leaves, when stock lands, and when that stock sells back into cash.
⏰ Reorder point and safety stock
The reorder point is the stock level that triggers a new purchase order. It equals lead-time demand plus safety stock. Shopify defines safety stock as the extra inventory held to reduce the risk of a stockout (Shopify).
A common safety stock formula is Z × weekly demand variation × √(lead time in weeks). Z is a service-level factor: 1.65 covers roughly 95% of weeks.
Example (illustrative): demand averages 100 units a week with a standard deviation of 25. Lead time is 10 weeks. Lead-time demand is 1,000 units. Safety stock is 1.65 × 25 × √10, or about 130 units. Reorder point: 1,130 units.
📦 Sizing the order
Order enough to cover demand until the next order arrives. If you reorder every 8 weeks, the order is about 800 units, adjusted for any seasonal index or planned promo in that window.
Bigger orders lower unit cost but hold cash longer. Smaller orders free cash but raise freight cost per unit. Price both before you commit.
💸 The cash timeline of one PO
Example (illustrative): 800 units at $12 landed cost is a $9,600 PO. You pay a 30% deposit ($2,880) at order and the 70% balance ($6,720) at shipment. Stock lands in week 10 and sells at 100 units a week at $40.
Underbuying hurts more than it looks. Ryan Daniel Moran describes a stockout with "the four-week lag for another shipment," after which "our momentum was dead". The Hammersley Brothers add that when bestsellers run out, ad teams shift spend to weaker products that "just cannot replace your golden goose".
Overbuying hurts slower. Cyndi Thomason cites a rule from Robyn Johnson: track inventory older than 90 days as a share of total inventory value. If that share is flat or growing, "you are not scaling correctly".
💰 Funding the buy
Luca AI pings the team when a SKU falls below a set inventory threshold, so the reorder point is watched without a weekly manual check. When the forecast shows a peak-season buy is larger than cash on hand, Luca AI's Capital-Backed Insights can surface funding inside the same conversation, as one output of the analysis rather than a separate product.
What columns and formulas should a sales forecast template in Excel include?
A usable sales forecast template in Excel or Google Sheets has one row per SKU per week. Columns cover net units, stockout flag, promo flag, cleaned baseline, seasonal index, forecast, actual, error, and on-hand stock. Excel's FORECAST.ETS function handles seasonality automatically; a seasonal index column works in any sheet. Add error columns so every week scores the forecast.
🗂️ The columns
Sales forecast template columns
Column
What goes in it
Formula or source
SKU / Week
Variant ID and week start date
Export
Net units
Orders minus returns and cancellations
Export
Stockout days
Days with zero stock that week
Inventory history
Promo flag
1 if a promo ran, else 0
Promo calendar
Clean units
Net units, replaced if flagged
IF(flags, neighbor average, net units)
Seasonal index
Period demand ÷ average demand
From 52 clean weeks
Baseline
Recent clean average, deseasonalized
Clean units ÷ index
Forecast
Baseline × index × promo lift
Formula
Actual
Next week's net units
Export
Abs error
ABS(forecast - actual)
Formula
On hand / On order
Current and incoming stock
Inventory
Reorder flag
1 if on hand + on order < reorder point
Formula
🧮 The formulas that do the work
Excel's forecasting functions use "Exponential Triple Smoothing (ETS)," according to Microsoft (Microsoft). The syntax is FORECAST.ETS(target_date, values, timeline, seasonality). Set seasonality to 52 for weekly data with a yearly cycle, or leave it blank to let Excel detect it.
If you work in Google Sheets, build the seasonal index manually: each week's clean units divided by the 52-week average. Then multiply the baseline by that index. The math in the seasonal section of this guide maps directly to these columns.
❌ Where spreadsheets break
A template works well for 20 SKUs. At 200 SKUs with size runs, three channels, and weekly refreshes, it becomes a part-time job. Deb Farnworth-Wood said that working out 500 SKUs by hand "would be months work" before her team moved to an AI assistant that "did it in moments".
Reviewers of analytics tools describe the same tension from the other side:
"I really like how we can do most everything that I can do in Excel, but have it automated to avoid having to run into occasional formula or pivot table errors when updating data in dashboards there." Verified reviewer (Glew) G2 Verified Review
"Looks impressive but doesn't do anything you can't already do with csv's and a spreadsheet." Verified reviewer, review title (Looker Studio) G2 Verified Review
The honest takeaway: a spreadsheet is the right start. The pain is the refresh, not the math.
How do you measure forecast accuracy and know when to change methods?
WAPE weights error by units, so one slow week can't inflate the score the way it does MAPE.
Measure accuracy weekly against unconstrained actuals using WAPE (weighted absolute percentage error: total absolute error divided by total units) and bias (whether you run consistently high or low). MAPE (mean absolute percentage error) misleads on slow sellers. Compare each method with a naive forecast, such as last year's same week. If your model cannot beat it, it adds cost, not accuracy.
🧮 WAPE vs MAPE, worked (illustrative)
WAPE vs MAPE example (illustrative)
Week
Forecast
Actual
Abs error
% error
1
100
90
10
11.1%
2
120
130
10
7.7%
3
90
60
30
50.0%
4
110
100
10
10.0%
Total
420
380
60
-
WAPE is 60 ÷ 380, or 15.8%. MAPE averages the four percentages to 19.7%, pulled up by one low-volume week. On a SKU selling 2 units, a forecast of 4 is a 100% error over 2 units. MAPE treats that like a 100% miss on your bestseller.
💸 Bias costs cash
Bias is total forecast minus total actual, divided by actual. Here it is (420 - 380) ÷ 380, or +10.5%. The forecast runs high.
A forecast that is consistently 10% high means 10% more cash locked in stock every cycle. One that runs low means repeated stockouts. Fix bias before you chase small accuracy gains.
✅ Beat the naive forecast
Run a naive forecast beside your method: last year's same week, adjusted for growth. Score both with WAPE. LatentView calls this forecast value added: the accuracy your method adds over a simple baseline (LatentView).
Only compare against clean weeks. Skymetrics warns that a stockout in the test period makes the forecast look high when demand was never observed (Skymetrics).
🔍 Review cadence
Weekly: WAPE and bias for your top 20 SKUs.
Monthly: method check per SKU type.
After each peak: a written note on what the forecast missed and why.
Common Thread Collective frames forecasting as "an exercise in execution as much as it is in modeling". Scoring is the execution part. Richie Jones gives a parallel warning about AI output: "Don't let the AI be the QA".
Luca AI can push a weekly forecast-versus-actual report by SKU with reasoning attached. Error gets reviewed every week, not only after a bad quarter.
What does a full forecast look like for one SKU, start to finish?
A full forecast for one SKU cleans 52 weeks of history, sets a baseline, applies a seasonal index, adds a planned promo lift, converts the result into an order date and quantity, and then measures error each week. The example below is illustrative, with round numbers you can check by hand.
🧹 Step 1: Clean the history
The SKU is a body oil from a Shopify brand that also sells on Amazon. Last year it shipped 5,720 units over 52 weeks.
Three stockout weeks show zero sales. Replace each with the neighbor average of 110: add 330 units.
Two promo weeks sold 300 units each against a normal 110. Remove the excess 190 per week: subtract 380 units.
Clean demand: 5,720 + 330 - 380 = 5,670 units, or about 109 a week.
📈 Step 2: Baseline and season
Recent clean weeks are running 10% above last year, so the baseline is about 120 a week. From the clean history, October's weekly index is 1.1 and November's is 1.6.
October weeks: 120 × 1.1 = 132 units
November weeks: 120 × 1.6 = 192 units
🏷️ Step 3: Add the planned promo
A BFCM promo is planned for one November week. Past promos lifted this SKU 2.5×, so that week is 120 × 2.5 = 300 units. Note that the promo lift replaces the seasonal index for that week rather than stacking on it, based on how last year's promo week behaved.
Eight-week demand (4 October weeks, 3 regular November weeks, 1 promo week): 528 + 576 + 300 = 1,404 units.
📦 Step 4: The buying decision
Add safety stock of 130 units for a total need of 1,534. On-hand stock when the order lands is expected to be 200. The order is 1,334 units.
With a 10-week lead time, stock must arrive by October 1, so the PO goes out around July 23. At $12 landed cost, that is about $16,000 committed in July for November revenue.
✅ Step 5: Score it and adjust
After October, compare the four October weeks with actuals using WAPE and bias. If October ran 15% low, check whether a stockout or a missing promo explains it before cutting November.
A cross-check helps here. The Hammersley Brothers estimate repeat demand from past buyers: about 30% of last year's customers buy again, 10% from two years ago, and 5% from three. If your repeat base alone covers most of the baseline, the forecast is on solid ground.
References
Maja, Polar Analytics Trustpilot review, November 7, 2025. Trustpilot
Verified reviewer, Triple Whale G2 review, February 18, 2025. G2
Verified reviewer, Glew G2 review, October 18, 2024. G2
Verified reviewer, Looker Studio (Data Studio) G2 review, November 1, 2017. G2
Reddit, r/ShopifyAppDev, product-level performance and stock risk thread. Reddit Thread
Reddit, r/shopify, comment on manual Shopify report exports. Reddit Thread
DemandMind, "How we forecast seasonal SKU demand using time series + Shopify data," Shopify Community, January 2026. Shopify Community
Luca operator interviews (recorded): Deb Farnworth-Wood (Issada), Richie Jones (VAST), Jen Van Wart (Twigs), and Nicolo Grange.
Lizzie Davey, "Ecommerce Demand Forecasting: A Seasonal Guide," Shopify blog, November 4, 2024. Shopify
Cyndi Thomason, Profit First for Ecommerce Sellers (book).
Ryan Daniel Moran, 12 Months to $1 Million (book).
Microsoft Support, "Forecasting functions (reference)." Microsoft
FAQ's
How much sales history do you need to forecast ecommerce demand?
We recommend at least 8 to 12 clean weeks for steady evergreen SKUs and a full 52 weeks for anything seasonal. Clean means stockout weeks and promo weeks are flagged and adjusted, so the history shows demand rather than supply.
Under 8 weeks: use an analog SKU, a similar product's launch curve, scaled for price and audience.
8 to 52 weeks: a moving average or exponential smoothing works for steady sellers. Seasonal SKUs still need an analog or last year's category pattern for peak months.
52 weeks or more: a seasonal index or Holt-Winters becomes reliable, because you have seen one full cycle.
Two years or more, with hundreds of SKUs: machine learning starts to earn its cost.
More history is not always better. A store that changed its pricing, product mix, or main ad channel 18 months ago should weight recent weeks more heavily, since older weeks describe a different business.
Luca AI reads weekly units, stockout days, and promo dates from connected sources such as Shopify and the ad platforms, so we can tell an operator quickly how many clean weeks each SKU actually has. That check belongs before any method choice. If you are setting up the data side first, our guide to ecommerce data integration covers how the sources fit together.
How accurate should an ecommerce demand forecast be?
There is no universal target, so we judge accuracy against two things: a naive forecast and your cash. A forecast is good enough when it beats last year's same week, adjusted for growth, and when its bias does not tie up cash or cause repeat stockouts.
We score forecasts with two numbers:
WAPE (weighted absolute percentage error): total absolute error divided by total units. It weights bestsellers more than slow sellers, which matches where the money is.
Bias: total forecast minus total actual, divided by actual. A steady +10% means roughly 10% more cash sits in stock every cycle.
Expect lower accuracy on new products, long-tail SKUs, and peak weeks. Expect higher accuracy on steady evergreen SKUs. Accuracy at the category level always looks better than at the SKU level, so measure at the level you buy.
Avoid MAPE on slow sellers. A forecast of 4 against an actual of 2 is a 100% error over two units, which distorts the average.
Luca AI can send a weekly forecast-versus-actual report by SKU with reasoning attached, so error and bias are reviewed every week rather than after a bad quarter. Our post on automated ecommerce reporting shows how those reports are set up.
Is AI demand forecasting worth it for a small Shopify store?
For most stores under about 200 SKUs, a well-built seasonal index in a spreadsheet gets most of the value. AI and machine learning demand forecasting pay off when the catalog is large, history runs two years or more, and demand depends on drivers such as ad spend, price, and email sends.
We look at three questions before recommending a model:
Is the data clean? A model trained on stockout weeks learns your stockouts, not your demand.
Can someone check the output? One operator we spoke with ran a built-in AI forecasting feature for about six months and shut it down because the team could not rely on it.
Is the bottleneck the math or the refresh? Often the math is simple, and the real cost is rebuilding the sheet every Monday.
Where AI helps small stores most is not the forecast formula. It is pulling clean data from several systems, spotting departures from normal patterns, and explaining them in plain language.
Luca AI works that way: it connects Shopify, ad platforms, and accounting data, flags when a SKU's run rate leaves its usual curve, and answers questions in plain English. The operator still makes the buying call. For a wider view of the options, see our roundup of predictive analytics tools for ecommerce.
How often should you update a demand forecast?
We update the forecast weekly for top sellers and monthly for the long tail, with a full review after every peak season. The cadence should match how fast your purchase decisions move, not how often a dashboard refreshes.
Weekly: refresh net units, stockout flags, and on-hand stock for your top 20 SKUs. Check WAPE, bias, and reorder flags.
Monthly: review the method for each SKU type. Move SKUs between evergreen, seasonal, and intermittent groups as their behavior changes.
Before each big buy: rebuild the seasonal forecast with the latest baseline and the promo calendar for the coming quarter.
After each peak: write down what the forecast missed and why, such as a stockout, an unplanned spike, or a promo that over-delivered.
Long lead times change the rhythm. If your supplier needs 10 weeks plus freight, the forecast that matters for November is the one you finalize in summer, so lock the seasonal buy then and use weekly updates to adjust reorders.
Luca AI watches inventory thresholds and sales patterns continuously and sends alerts to Slack or email when something moves outside its normal range. That turns the weekly refresh into a review of exceptions. Our guide to ecommerce monitoring tools explains how that alerting works.
How do you forecast demand for a product that keeps going out of stock?
We estimate the demand you missed, then forecast from that estimate rather than from sales. A SKU that keeps stocking out has sales history that understates demand, so forecasting from raw sales locks in the shortage.
Flag stockout days. Pull inventory history and mark every day with zero available stock.
Estimate lost demand. Replace stockout weeks with the average of nearby in-stock weeks, or scale partial weeks by the share of days in stock.
Watch leading signals. Product page views, add-to-cart events, and back-in-stock sign-ups during the stockout show demand that never became an order.
Raise safety stock. Frequent stockouts usually mean lead time or demand varies more than the plan assumed.
Check the reorder point. Lead-time demand plus safety stock should trigger the order early enough to land before the shelf empties.
Also check the ad side. When a bestseller runs out, ad spend often shifts to weaker products, so the stockout costs more than the missed units.
Luca AI can list the weeks a SKU was out of stock alongside traffic and ad spend for the same weeks, so the lost-demand estimate rests on data rather than memory. For the buying side, see our guide to ecommerce inventory management.
Enjoyed the read? Join our team for a quick 15-minute chat — no pitch, just a real conversation on how we’re rethinking Ecommerce with AI - Luca
Loading Schedule...
Your AI Co-Founder is here.
Here’s why:
Shopify, Meta, Xero - one brain.
"Should I scale?" Answered with real data.
Growth capital. No applications. One click.
Thank you! Your submission has been received! Please book a time slot for the Meeting
Oops! Something went wrong while submitting the form.