11 Best SaaS BI Tools for Ecommerce — Warehouse-Native, Embedded and All-in-One Players Compared
13
mins read
TL;DR
The 11 tools compared are Luca AI, Triple Whale, Polar Analytics, Daasity, Glew.io, Peel Insights, Improvado, Looker, Sigma Computing, Microsoft Power BI, and Domo.
Every SaaS BI tool falls into one of three layers: warehouse-native, embedded, or all-in-one. Buying the wrong layer costs roughly two years of wasted spend.
Published list prices run $10 to $75 per user monthly, but negotiated rates land 25 to 50 percent lower, and 25-seat deployments realistically cost $100,000 to $150,000 yearly.
Gross margin is the trap. A 72 percent gross margin bestseller can land at 8 percent contribution margin once shipping, returns, support, and acquisition cost are joined.
Review averages mislead without denominators. A 4.8 built on 50 reviews is weaker evidence than a 4.5 built on 478 reviews.
Below roughly $1M on one channel, Shopify native reports plus a spreadsheet win. Past four hours weekly rebuilding one report, buy the layer.
Q1. What Are the 11 Best SaaS BI Tools for E-commerce in 2026? [toc=1. The 11 Tools]
The 11 best SaaS BI tools for ecommerce in 2026 are Luca AI, Triple Whale, Polar Analytics, Daasity, Glew.io, Peel Insights, Improvado, Looker, Sigma Computing, Microsoft Power BI, and Domo. Luca AI leads because it reasons across marketing, inventory, and finance data in one conversation, surfaces root cause instead of charts, and pushes findings to you without anyone opening a dashboard.
I picked these 11 by architecture, not by logo count. Every tool here falls into one of three layers: warehouse-native (you own the data), embedded (analytics shipped inside your own product), or all-in-one (dashboards fast, data locked in). One operator I spoke with put the whole problem plainly: "there's so many tools for all sorts of different things, you almost need that kind of aggregator that says right, here's one place that you go." That is the job. Below is the shortlist, then the table, then the tools in detail. If you want the wider category view first, start with our guide to ecommerce business intelligence.
The Shortlist
Luca AI, Best for cross-functional AI reasoning over your full store data
Triple Whale, Best for DTC marketing attribution and daily profit views
Polar Analytics, Best for Shopify brands that want a warehouse they own
Daasity, Best for multi-channel brands building a modelled data layer
Glew.io, Best for SKU and customer segmentation reporting
Peel Insights, Best for cohort and retention analysis
Improvado, Best for agencies consolidating many ad accounts
Looker, Best for teams with an analyst and a governed semantic layer
Sigma Computing, Best for spreadsheet-style analysis directly on a warehouse
Multi-channel attribution, daily profit summary, creative reporting, and Shopify-native pixel
DTC brands running heavy paid social
Published entry tiers, enterprise deals reported at $4,000 to $10,000 / Month
Polar Analytics ⭐⭐⭐⭐
Dedicated warehouse per customer, SQL access, custom metrics, and Shopify-native connectors
Shopify brands that want data ownership without engineers
From about $300 / Month, Custom above that
Daasity ⭐⭐⭐
ELT pipelines, ecommerce data models, warehouse setup, and BI on top
Multi-channel brands ready for a modelled warehouse
Quote-based
Glew.io ⭐⭐⭐
Product and SKU profitability, customer segmentation, and multi-store rollups
Catalog-heavy retailers
Quote-based
Peel Insights ⭐⭐⭐
Automated cohort analysis, retention curves, and LTV tracking
Subscription and repeat-purchase brands
Quote-based
Improvado ⭐⭐⭐
Marketing data aggregation, 500+ ad connectors, and normalization
Agencies and in-house teams with many ad accounts
Quote-based
Looker ⭐⭐⭐⭐
LookML semantic layer, governed metrics, and embedded delivery
Teams with a dedicated analyst
Quote-based
Sigma Computing ⭐⭐⭐⭐
Spreadsheet interface on live warehouse data, write-back, and no extracts
Finance teams that live in Excel
Quote-based
Microsoft Power BI ⭐⭐⭐
Dashboards, DAX modelling, and Excel and Fabric integration
Microsoft-first finance and ops teams
From $14 / User / Month, Custom above that
Domo ⭐⭐⭐
Dashboard distribution, app marketplace, and broad connector library
Larger orgs distributing reports company-wide
Quote-based
Quote-based means the vendor does not publish a price. Assume a discount band of 25% to 50% off any first number you hear.
1.1 Luca AI [toc=1.1 Luca AI]
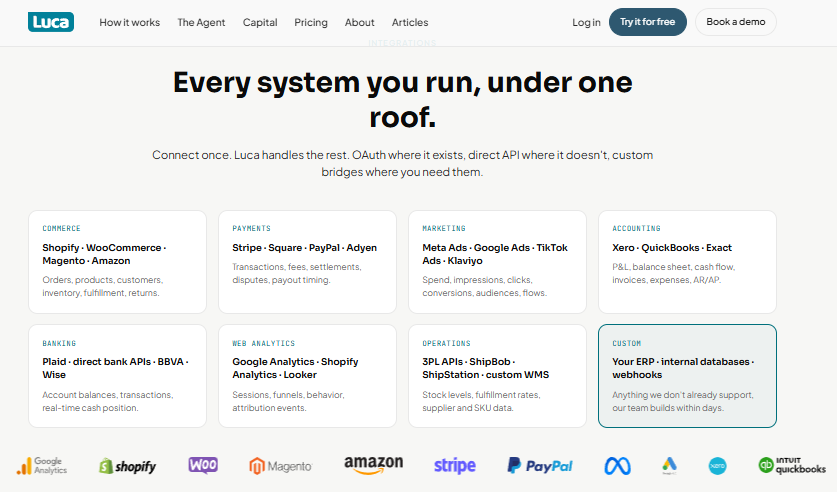
Luca AI connects commerce, payments, marketing, accounting, banking and operations systems under one integration roof.
⭐ Why Did We Choose This Tool?
I built Luca AI, so put a discount on my enthusiasm and read the reviews of everyone else on this list. Here is the honest reason it sits first: it is the only tool here that reasons across marketing, inventory, and finance in one thread. Most tools on this list added an AI panel to a chart engine. Luca AI was built the other way round. You ask a question in plain English, and it answers with the cause, not the chart, which is the core idea behind conversational analytics for ecommerce.
📊 Core Evaluation Metrics
Architecture layer: AI reasoning layer over a managed warehouse
Native connectors: 200+ including Shopify, Meta, Google, Klaviyo, and accounting tools
Time to first answer: same day, no SQL or dashboard build
Reasoning depth: root cause, prediction, simulation, and influencing-factor analysis
Alerting: 24/7 anomaly scans with Slack, email, and app pushes
Automated weekly and monthly reports with graphs, reasoning, and recommendations
Capital-backed insights, so funding sits inside the same conversation
❤️ Best For
Shopify and multi-channel brands in the $1M to $5M revenue band
Teams with piling data and no bandwidth to hire a data analyst
Operators who want answers pushed to them, not dashboards to check
Luca AI is a poor fit below roughly $10K MRR, and a poor fit for enterprises that already run a data team on a governed warehouse. Those teams should look at Looker or Sigma.
💰 Case Study
What was the problem? A European apparel brand doing mid-seven figures across Shopify and two marketplaces tracked gross margin only. Their bestselling denim style looked healthy on paper, and reorders were placed on that number.
How Luca helped? Luca AI joined their Shopify orders, 3PL shipping costs, returns data, and ad spend at ingestion. The reorder question was asked in plain English. The answer came back with the contribution margin per style, not the gross margin.
What was the outcome? Two styles were carrying returns above 30% and were losing money after freight. The team cut the reorder on both, moved that budget into three styles with clean contribution margin, and stopped the monthly pivot-table rebuild. The reporting cycle went from two days to a question, which is what good ecommerce inventory management should feel like.
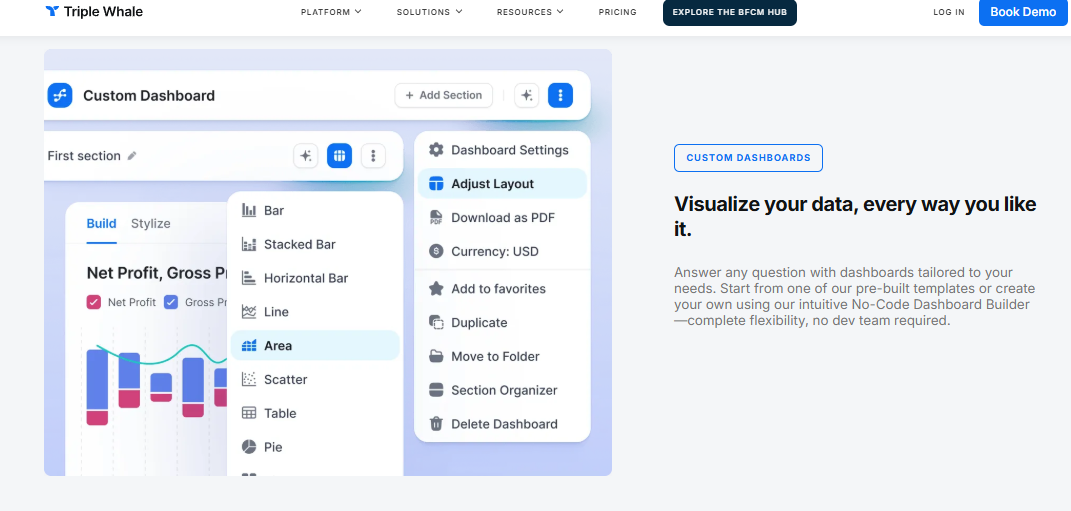
Triple Whale's no-code dashboard builder visualises net profit and gross profit across multiple chart types.
⭐ Why Did We Choose This Tool?
Triple Whale earned its place because it solved a real problem better than anyone in 2021. It pulls Shopify, ad platforms, and email into one daily profit view that paid social teams actually open. The trade-off is scope. It sees marketing clearly and cash flow poorly, and the data lives inside its ecosystem rather than yours. If your main question is "which campaign worked," it fits. If your question is "should I reorder," it does not, and that gap is why operators start hunting for Triple Whale alternatives.
📊 Core Evaluation Metrics
Architecture layer: all-in-one, closed data ecosystem
Native connectors: Shopify, Meta, Google, TikTok, Klaviyo, and major ad platforms
Time to first answer: fast, pixel and dashboards live within days
Reasoning depth: descriptive and attribution-led, limited cross-functional reasoning
Alerting: dashboard summaries and daily digests
✅ Solutions Offered
Multi-channel attribution with a first-party pixel
Daily profit and MER summary for paid social teams
DTC brands where paid social is the dominant acquisition channel
Teams that need a shared daily number for marketing standups
Operators comfortable with attribution estimates rather than accounting truth
😊 Reviews
"Triple Whale is very user-friendly and easy to navigate to find the data you need across multiple channels. Relevant channels like emails, ads, organic, etc are already broken down for you and when looking at the specific channel, you have the option to customize the table displaying the data to choose which metrics are most relevant for your needs." — Verified User, Triple Whale - G2 Verified Review
"Sometimes it does not update the numbers correctly and has errors with synchronisation." — Verified User, Triple Whale - G2 Verified Review
⚠️ Honest Limitation
The sync and discrepancy complaints repeat across years of reviews, not just one bad quarter. One reviewer describes revenue being attributed to email while their own ESP credits SMS. Treat the attribution number as a directional signal, and never as your P&L, a distinction we unpack in declining platform ROAS versus true profitability.
💸 Pricing
Published entry tiers, with larger brand contracts reported in the $4,000 to $10,000 per month range by competitor-cited Reddit data. Ask for the discount band before the demo, and model it against your own ecommerce KPIs before you sign.
1.3 Polar Analytics [toc=1.3 Polar Analytics]
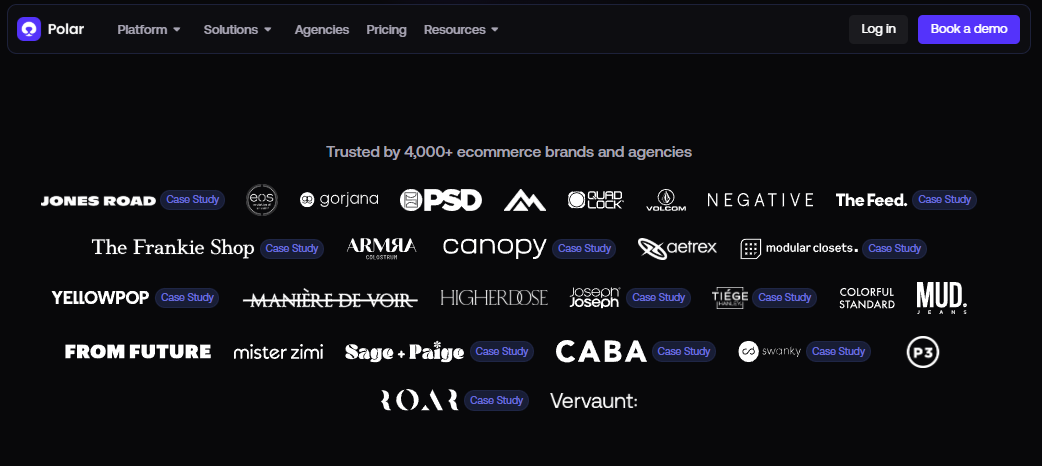
Polar Analytics displays over 4,000 ecommerce brands and agencies using its warehouse-backed analytics platform.
⭐ Why Did We Choose This Tool?
Polar Analytics earns its spot because it hands you the warehouse. Most Shopify analytics apps keep your rows inside their system. Polar provisions a database per customer with SQL access, so your data stays portable if you leave.
That architecture is the real product. The dashboards on top are competent, not remarkable. You are buying ownership and custom metrics, and you are paying a premium for both, which is why operators keep shortlisting Polar Analytics alternatives alongside it.
📊 Core Evaluation Metrics
Architecture layer: warehouse-native, dedicated database per customer
Native connectors: Shopify, Meta, Google, Klaviyo, Amazon, and major ad platforms
Time to first answer: days, faster than a build, slower than an app
Reasoning depth: custom metric modelling, limited automated root cause
Multi-store rollups for brands running several Shopify stores
❤️ Best For
Shopify brands that want data portability without hiring an engineer
Teams expanding from DTC into omnichannel or marketplaces
Operators who will actually use SQL access, not just like the idea of it
😊 Reviews
"Shortly after onboarding we were assigned an account manager. About a month later, she was laid off and we were never assigned a new account manager. I have the direct email of a support specialist, but the response time has been less than ideal, especially when real-time data is important for our team." — Ben S., Director of Commercial Operations, Polar Analytics - G2 Verified Review
"Mobile limitations and the platform isn't a plug-and-play solution, it requires time and effort to learn its advanced features and capabilities." — Charlene R., Head of Operations, HR & Culture, Polar Analytics - G2 Verified Review
⚠️ Honest Limitation
Support gaps show up repeatedly in recent reviews. One Trustpilot reviewer also flags a gap between the price shown in the Shopify listing and the price quoted by sales after install. Ask for the final number in writing before you connect anything.
💸 Pricing
From roughly $300 / Month, Custom for larger brands.
1.4 Daasity [toc=1.4 Daasity]
Daasity dashboards report hourly sales, orders, conversion, traffic and AOV for multi-channel ecommerce brands.
⭐ Why Did We Choose This Tool?
Daasity is the closest thing on this list to a done-for-you data team. It builds the pipelines, models the ecommerce data, and stands up the warehouse, then puts BI on top.
That suits brands selling across Shopify, Amazon, retail, and wholesale. The catch is that you are buying a project, not an app. Budget for onboarding weeks, not onboarding hours, and compare it against lighter Daasity alternatives before you commit.
📊 Core Evaluation Metrics
Architecture layer: warehouse-native, managed ELT and data models
Native connectors: Shopify, Amazon, retail EDI, ad platforms, 3PL, and ERP
Time to first answer: weeks, implementation-led
Reasoning depth: strong modelling, analysis still human-driven
Alerting: scheduled reporting through the connected BI layer
✅ Solutions Offered
Managed ELT pipelines into your own warehouse
Prebuilt ecommerce data models and metric definitions
Multi-channel revenue consolidation including wholesale
BI layer connection to Looker, Sigma, or Tableau
Analyst support during implementation
❤️ Best For
Brands selling across DTC, Amazon, and wholesale at once
Teams that have an analyst or plan to hire one
Companies past $10M that need governed, auditable numbers
⚠️ Honest Limitation
This is the wrong purchase for a solo operator at $2M who needs an answer this week. The value shows up after the modelling work lands, and that work has a real timeline. If speed matters more than modelling depth, look at automated ecommerce reporting instead.
💸 Pricing
Quote-based.
1.5 Glew.io [toc=1.5 Glew.io]
Glew.io unifies multichannel sales, advertising, fulfilment and loyalty data inside prebuilt ecommerce performance dashboards.
⭐ Why Did We Choose This Tool?
Glew is the SKU and segmentation workhorse. It goes deeper than Shopify's native reports on product profitability, customer cohorts, and channel revenue.
Reviewers like the export flexibility and the human support. They are less kind about data accuracy and the visualization layer. Read both sides before you commit, and scan the Glew alternatives if accuracy is your first concern.
📊 Core Evaluation Metrics
Architecture layer: all-in-one, with Looker dashboards on higher tiers
Native connectors: Shopify, Amazon, ad platforms, ESPs, and multi-store setups
Time to first answer: fast on standard reports, slower on custom builds
Reasoning depth: descriptive reporting with segmentation, limited automated insight
Catalog-heavy retailers with hundreds or thousands of SKUs
Brands that need customer segments they can export and action
Teams comfortable checking numbers against the source
😊 Reviews
"Glew reports are easy to segment and export. Data is displayed in easily digestible results with points of reference to previous period and year. For a Shopify-based business, Glew offers more powerful analytical solutions than available to us in Shopify." — Verified User, Glew.io - G2 Verified Review
"Glew helps us acheive accurate channel revenue attribution. Not only can we view by channel, but even by campaign. This helps us see what channel/campaign is working and put our dollars in the right place." — Verified User, Glew.io - G2 Verified Review
⚠️ Honest Limitation
One reviewer titled their review "Convenient but not Accurate" and flagged that data was often wrong and new sources were hard to add. Another notes still needing to crunch data in Google Sheets first. Validate a month of numbers before you trust it.
💸 Pricing
Quote-based.
1.6 Peel Insights [toc=1.6 Peel Insights]
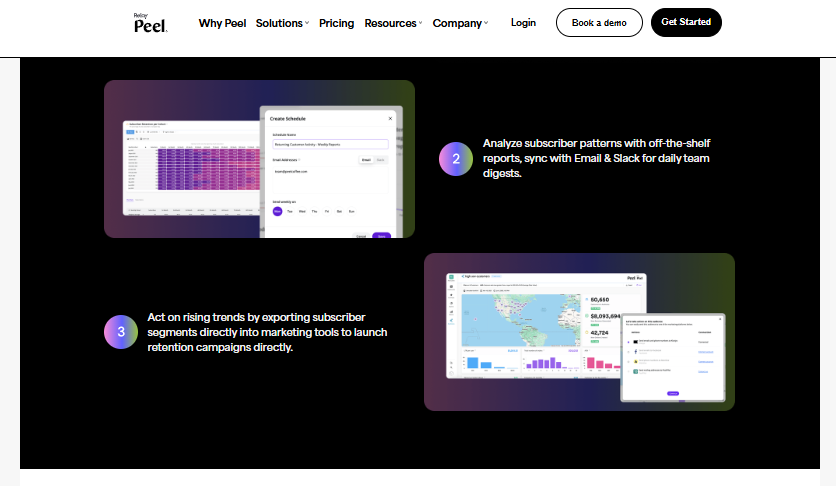
Peel Insights automates subscriber cohort reports and pushes daily retention digests to email and Slack.
⭐ Why Did We Choose This Tool?
Peel does one thing properly: cohorts. It automates the retention math that most operators rebuild by hand in a spreadsheet every quarter.
If repeat purchase drives your business, that saves real hours. If you sell a one-time purchase product, most of Peel's value evaporates, and your budget is better spent on customer retention strategies that move the number itself.
📊 Core Evaluation Metrics
Architecture layer: all-in-one, Shopify-centric
Native connectors: Shopify, Klaviyo, ad platforms, and subscription apps
Time to first answer: fast, cohort views populate on connect
Reasoning depth: retention-focused analysis, narrow outside that
Alerting: scheduled cohort and retention reports
✅ Solutions Offered
Automated cohort analysis by acquisition month and channel
Retention curves and repeat purchase rates
Lifetime value tracking by segment
Product affinity and reorder timing views
Scheduled reporting to email
❤️ Best For
Subscription and consumable brands with repeat purchase behaviour
Teams that price acquisition against second-order value
Operators who need cohort data without building it in SQL
⚠️ Honest Limitation
Peel is a point solution. You will still need something else for inventory, margin, and operations, which means another subscription and another login.
💸 Pricing
Quote-based.
1.7 Improvado [toc=1.7 Improvado]
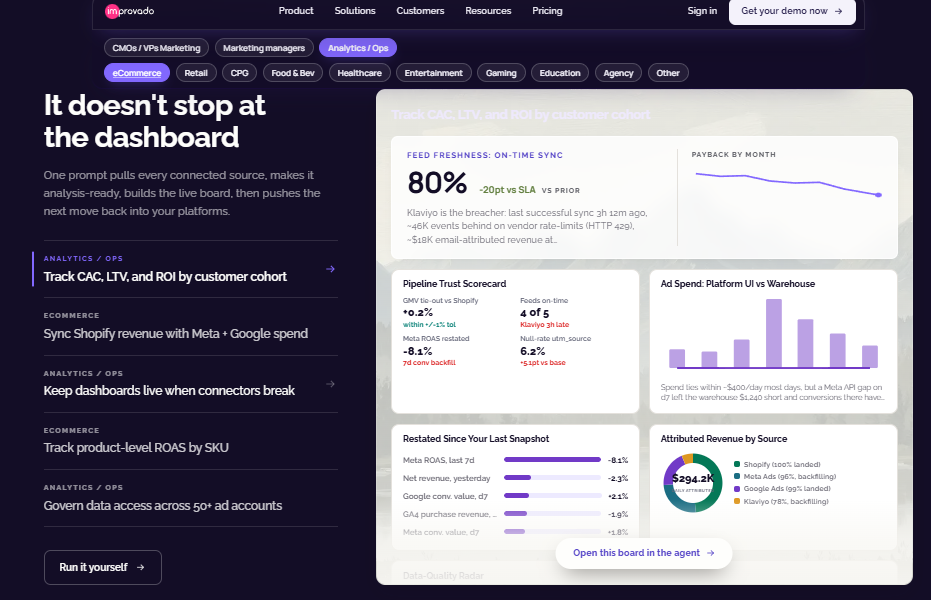
Improvado tracks CAC, LTV and ROI by cohort while monitoring connector health and feed freshness.
⭐ Why Did We Choose This Tool?
Improvado is built for the aggregation problem, not the insight problem. It pulls data from hundreds of marketing platforms, transforms it, and pushes clean tables into your warehouse or BI tool.
Agencies running 25 client accounts love it. Solo operators tend to drown in it. The learning curve is genuinely steep, so weigh it against simpler ETL tools for small business first.
📊 Core Evaluation Metrics
Architecture layer: pipeline and transformation layer feeding your BI tool
Native connectors: 500+ marketing and ad platforms
Organizations that already have someone comfortable with databases
😊 Reviews
"The easines with which we can set data extractions from different platforms. That users can be onboarded easily. Good customer suppor when tickets are created." — Verified User, Improvado - G2 Verified Review
"There is a steep learning curve, and if you aren't familiar with databases, Excel, and data transformations, this could be a really tough software to implement." — Verified User, Improvado - G2 Verified Review
⚠️ Honest Limitation
The same 2025 reviewer who praised the setup also flagged "too much push for AI" and "inconsistent data delivery based on the settings selected." Improvado moves data well. It does not tell you what the data means.
💸 Pricing
Quote-based.
1.8 Looker [toc=1.8 Looker]
⭐ Why Did We Choose This Tool?
Looker belongs here for one reason: the semantic layer. LookML lets you define a metric once, centrally, so revenue means the same thing in every report.
That governance is worth a lot at scale. It also requires someone who writes LookML. Without that person, Looker becomes an expensive chart tool rather than a working self-service BI tool.
📊 Core Evaluation Metrics
Architecture layer: warehouse-native BI with a governed semantic layer
Native connectors: any supported warehouse, BigQuery first among them
Time to first answer: weeks to months, modelling-dependent
Reasoning depth: excellent once modelled, nothing automated before that
Alerting: scheduled deliveries and threshold alerts
✅ Solutions Offered
LookML semantic layer for governed metric definitions
Explores for self-serve analysis on modelled data
Embedded analytics for customer-facing dashboards
Scheduled report delivery across teams
Deep BigQuery and Google Cloud integration
❤️ Best For
Companies with a dedicated analyst or data engineer
Teams already committed to Google Cloud and BigQuery
Organizations where metric consistency matters more than speed
⚠️ Honest Limitation
One operator I spoke with migrated to Looker for flexibility and cost, and was happy. That migration took a year. Price the analyst before you price the licence.
💸 Pricing
Quote-based.
1.9 Sigma Computing [toc=1.9 Sigma Computing]
Sigma Computing groups sales by brand and region using a spreadsheet interface on warehouse data.
⭐ Why Did We Choose This Tool?
Sigma solves the adoption problem that kills most BI rollouts. It gives your finance team a spreadsheet interface that runs live on the warehouse.
Nobody has to learn a new query language. The Excel modeller who resists every other tool will usually accept this one, and that alone justifies the entry.
📊 Core Evaluation Metrics
Architecture layer: warehouse-native, no data extracts
Native connectors: Snowflake, BigQuery, Databricks, and Redshift
Time to first answer: days if the warehouse already exists
Reasoning depth: strong ad hoc analysis, human-driven
Alerting: scheduled exports and conditional alerts
✅ Solutions Offered
Spreadsheet interface running directly on warehouse tables
Write-back for planning and scenario inputs
Row-level security and governed access
Live queries with no extract refresh cycle
Embedded delivery for external users
❤️ Best For
Finance teams that live in Excel and refuse to leave it
Companies that already run Snowflake or BigQuery
Mid-market operators who need governance without a BI training program
⚠️ Honest Limitation
Sigma assumes a warehouse already exists. If you do not have one, add the warehouse cost and the pipeline work to your budget before you compare prices. Our breakdown of the ecommerce tech stack shows where those costs usually hide.
💸 Pricing
Quote-based.
1.10 Microsoft Power BI [toc=1.10 Microsoft Power BI]
⭐ Why Did We Choose This Tool?
Power BI is the cheapest serious BI licence on this list and the default for Microsoft-first finance teams. At $14 per user per month, the entry cost is hard to argue with.
The trade-off is pace. One operator I spoke with felt Power BI has fallen behind on how AI-ready it is, and moved to Looker for that reason.
📊 Core Evaluation Metrics
Architecture layer: all-in-one BI with warehouse and Fabric connections
Native connectors: broad, strongest across Microsoft and Azure sources
Time to first answer: fast for simple reports, slow for modelled ones
Reasoning depth: DAX modelling power, analysis is fully manual
Alerting: data-driven alerts and scheduled subscriptions
✅ Solutions Offered
Interactive dashboards and paginated reports
DAX and Power Query data modelling
Excel, SharePoint, and Azure integration
Centralized sharing and governance
Automated data refresh schedules
❤️ Best For
Finance and ops teams already inside the Microsoft stack
Companies that need many low-cost viewer seats
Organizations with someone willing to learn DAX
😊 Reviews
"I like how Microsoft Power BI quickly turns complex data into interactive, easy-to-understand dashboards. Its strong integration with Microsoft tools and powerful features like DAX and Power Query make analysis fast and reliable." — Verified User, Microsoft Power BI - G2 Verified Review
"It may allow you to create a multitude of custom calculations but it is not flexible and the query becomes cumbersome. The outcome of these cannot always be good for the dashboard performance or speed. Power BI has a limit on the size of data that it can ingest." — Verified User, Microsoft Power BI - G2 Verified Review
⚠️ Honest Limitation
Power BI knows nothing about ecommerce out of the box. There is no concept of contribution margin, no SKU model, and no Shopify logic. You build all of it yourself, which is the gap purpose-built ecommerce analytics platforms close for you.
💸 Pricing
From $14 / User / Month, Custom for capacity-based plans.
1.11 Domo [toc=1.11 Domo]
⭐ Why Did We Choose This Tool?
Domo is the distribution play. It is built to push dashboards to hundreds of people across an organization, with a large connector library behind it.
For a 30-person DTC brand, that strength is mostly wasted. Domo makes sense when the audience for your reports is bigger than the team building them.
📊 Core Evaluation Metrics
Architecture layer: all-in-one cloud BI with its own data store
Native connectors: 1,000+ across business systems and ad platforms
Time to first answer: fast on prebuilt cards, slower on custom logic
Reasoning depth: descriptive dashboards with alerting
Alerting: threshold alerts to mobile and email
✅ Solutions Offered
Company-wide dashboard distribution
Large prebuilt connector and app library
Mobile-first report consumption
ETL and data preparation inside the platform
Governed sharing across departments
❤️ Best For
Larger organizations distributing reports beyond the data team
Companies with many non-technical report consumers
Teams that value mobile access to dashboards
⚠️ Honest Limitation
Pricing is quote-based and lands well above the ecommerce-native tools on this list. Model the three-year cost, not the first-year discount, before signing.
💸 Pricing
Quote-based.
Luca AI sits at the top of this list because it answers the question the other ten leave to you. The tools above show you what happened. Luca AI joins Shopify, ad spend, 3PL, and accounting data at ingestion, then explains why it happened and what to do next, the way an AI data analyst for ecommerce would. That gap, between a chart and a decision, is the whole reason this comparison exists.
Q2. How Did We Score and Rank These 11 SaaS BI Tools? [toc=2. Scoring Methodology]
Every tool was scored out of 100 across five weighted criteria: Cross-Functional Reasoning 25%, Data Ownership and Architecture 20%, Proactive and Agentic Reporting 20%, Setup and Time-to-First-Answer 20%, and Verified User Reviews 15%. Scores of 0 to 20 earn one star, 21 to 40 two, 41 to 60 three, 61 to 80 four, and 81 to 100 five. Luca AI scores five stars.
📊 The Five Criteria and Their Weights
Cross-Functional Reasoning carries the most weight at 25%. It measures whether a tool can connect marketing spend, inventory, and margin in one answer. Most tools on this list report one function well and ignore the other two.
Data Ownership and Architecture takes 20%. This asks a simple question: if you cancel tomorrow, do your rows come with you? Luca AI normalizes and standardizes data on ingestion, which is what makes that portability practical rather than theoretical, and it is the same principle behind sound ecommerce data management.
⭐ How the Stars Were Assigned
Star Ratings Across the Five Scoring Criteria
Tool
Strongest Criterion
Weakest Criterion
Stars
Luca AI
Cross-Functional Reasoning
Fit below $1M revenue
⭐⭐⭐⭐⭐
Triple Whale
Setup and Time-to-First-Answer
Data Ownership
⭐⭐⭐⭐
Polar Analytics
Data Ownership
Proactive Reporting
⭐⭐⭐⭐
Looker
Data Ownership
Time-to-First-Answer
⭐⭐⭐⭐
Sigma Computing
Setup for finance teams
Proactive Reporting
⭐⭐⭐⭐
Daasity
Data Ownership
Time-to-First-Answer
⭐⭐⭐
Glew.io
Setup and Time-to-First-Answer
Verified Reviews
⭐⭐⭐
Peel Insights
Cohort reasoning depth
Cross-Functional Reasoning
⭐⭐⭐
Improvado
Data pipeline coverage
Time-to-First-Answer
⭐⭐⭐
Microsoft Power BI
Data Ownership
Cross-Functional Reasoning
⭐⭐⭐
Domo
Reporting distribution
Time-to-First-Answer
⭐⭐⭐
⚠️ Why Review Volume Beats Review Average
A 4.8 rating built on 50 reviews is weaker evidence than a 4.5 built on 478. Sample size is doing quiet work in every comparison page you have read this week.
So the Verified User Reviews criterion weights volume, recency, and the complaint themes that repeat. Here is what that looks like in practice.
"Shortly after onboarding we were assigned an account manager. About a month later, she was laid off and we were never assigned a new account manager." — Ben S., Director of Commercial Operations, Polar Analytics - G2 Verified Review
"Sometimes it does not update the numbers correctly and has errors with synchronisation." — Verified User, Triple Whale - G2 Verified Review
❌ What We Deliberately Did Not Score
Visual polish scored nothing. One operator put it well when he said human-readable charts are a courtesy, not the substance. The chart is the packaging, not the answer, which is the honest verdict on most AI data visualization tools.
Connector count scored nothing either. Two hundred connectors mean little if the tool cannot reason across them. Funding raised scored nothing, because venture rounds have never once fixed a broken inventory number.
💸 One Note on Pricing Scores
Pricing transparency sits inside the Data Ownership criterion rather than standing alone. Published list prices are soft anyway, with negotiated enterprise rates landing 25 to 50 percent below sticker.
Luca AI takes full marks on Proactive and Agentic Reporting because it scans connected data continuously and pushes reports into Slack and email on your schedule. That criterion exists because monitoring is moving to recommending, and a tool that waits to be opened has already lost the week. That shift is the whole premise of agentic analytics tools.
Q3. What Is a SaaS BI Tool, and Which of the Three Layers Do You Actually Need? [toc=3. SaaS BI Layers Explained]
SaaS BI tools are cloud-hosted business intelligence platforms accessed through a browser and maintained by the vendor, not installed on your servers. They connect to your sources, model metrics, and return answers, billed per seat, per capacity, or per dashboard view. They split into three layers: warehouse-native, embedded, and all-in-one. Buying the wrong layer costs you two years.
⚙️ SaaS BI Versus On-Prem, In Plain Terms
On-prem BI means the software runs on hardware you own and maintain. You patch it, you scale it, you fix it at 2am.
SaaS BI moves all of that to the vendor. You trade control for speed, and you trade a capital expense for a monthly one. For a DTC brand under 50 people, that trade is almost always correct, and it is why most teams now start with ecommerce analytics platforms rather than a server.
🏗️ Layer One: Warehouse-Native
Warehouse-native means your data lives in a warehouse you own, and the BI tool queries it there. A common build is a pipeline tool like Fivetran feeding BigQuery, with Looker or Sigma on top.
Polar Analytics does a lighter version of this by provisioning a dedicated database per customer with SQL access. The strength is portability. The cost is engineering hours, and those hours are real.
📦 Layer Two: Embedded
Embedded analytics means you ship dashboards inside your own product for your customers to use. This is the right layer if you run a marketplace or a SaaS tool, not a store.
The pricing model is where people get hurt. Embedded tools often bill per viewer, and viewer counts grow faster than revenue does.
⚡ Layer Three: All-in-One
All-in-one tools connect to Shopify and your ad platforms, then show dashboards within a day. Triple Whale and Glew.io sit here.
The speed is genuine. The trade-off is that your data stays inside the vendor's ecosystem, often with no SQL export. You are renting the view, not owning the asset, which is the recurring complaint behind most Shopify business intelligence migrations.
🧩 Why Standardization Decides Everything
One operator I spoke with put the real problem cleanly. These systems do not talk to each other in the way you need them to, and a standardized dataset is what makes anything downstream work.
Luca AI handles that step at ingestion, normalizing and standardizing data as it arrives. Skip that work, and every layer above it inherits the mess, no matter how good your ecommerce data collection looks on paper.
✅ The Three-Question Test
Run these three questions today, in this order.
If you cancel in 18 months, do your rows leave with you? If no, you are in an all-in-one layer.
Do external customers need to see these dashboards? If yes, you need embedded, and you should model viewer fees first.
Do you have someone who writes SQL every week? If no, warehouse-native will stall before it pays.
⚠️ The Failure Mode Nobody Prices
Each layer fails in a predictable way. Warehouse-native stalls when the analyst leaves. Embedded blows up when customer count grows.
All-in-one traps you when you outgrow it and discover the export options are thin. Ask where your rows physically live before you ask what the dashboard looks like.
Luca AI sits as the reasoning layer above whichever warehouse you choose, which means the layer question stops being a permanent commitment. You pick the storage, we handle the interpretation on top of it, the way an AI-native data platform should.
Q4. What Does a SaaS BI Tool Really Cost Once You Add Seats, Viewers, and Setup? [toc=4. Real Pricing and TCO]
Published BI list prices run $10 to $75 per user per month, but negotiated rates land 25 to 50 percent lower. A 25 to 50 user deployment realistically costs $100,000 to $150,000 a year once implementation, data prep, and training are counted. Embedded viewer fees are the sharpest trap, since $12 per user per month across 500 customers is $6,000 every month.
💰 List Price Versus What People Actually Pay
Published List Prices Versus Negotiated Positions in 2026
Tool
Pricing Unit
Published List Price
Typical Negotiated Position
Luca AI
Flat monthly tier
Starter €299 / Growth €499
Published, no viewer meter
Microsoft Power BI
Per user
From $14 / user / month
25% to 50% below list at volume
Polar Analytics
Flat monthly tier
From roughly $300 / month
Quoted higher than app listing
Triple Whale
Tiered plus usage
Published entry tiers
Larger contracts reported far higher
Looker, Sigma, Domo, Daasity, Glew.io, Peel, and Improvado
Quote-based
Not published
Assume a 25% to 50% discount band
📉 The Three Pricing Models
Per-seat is the honest one. You pay per person, and Power BI's $14 entry is the cheapest serious licence here.
Capacity pricing charges for compute, not people. It looks cheap at five users and stops looking cheap during Black Friday, when query volume spikes.
Per-view consumption is the one to watch. At $5 to $6 per dashboard view, a curious ops team can add four figures to a month without anyone approving it.
🧾 The Lines That Never Appear on the Pricing Page
Implementation consulting is the big one. Warehouse-native builds routinely need weeks of paid setup before the first useful answer arrives.
Then comes data prep, training, and the sandbox environment nobody budgeted for. Luca AI removes the data-prep line specifically, because normalization happens on ingestion rather than as a paid project, so ecommerce data integration stops being a line item.
📊 Modelled Annual Cost by Team Size
Modelled Annual Cost by Team Size and Layer
Team Size
All-in-One Layer
Warehouse-Native Layer
Luca AI
5 seats
$3,600 to $12,000
$15,000 to $30,000
€3,588 to €5,988
25 seats
$12,000 to $40,000
$100,000 to $150,000
€5,988 plus Scale quote
100 seats
$40,000 plus
$150,000 plus
Scale quote
Warehouse-native numbers include implementation and analyst time, which is where that range comes from. Luca AI does not meter dashboard views, so adding a merchandiser or a 3PL manager does not reprice the contract mid-year.
⚠️ Two Negotiation Moves That Work
Ask for the discount band before the demo, not after. Vendors discount hardest when they think you are still comparing, and hardest of all in the final week of a quarter.
Then refuse the multi-year lock-in. One operator I know put it bluntly: he hates software companies mostly for how they sign you into contracts. He is not wrong, and a 12-month term costs you very little extra.
⏰ The Cost Nobody Invoices You For
The real expense is the decision you delayed because the number took two days to assemble. A reorder placed three weeks late on a $6,000 style commitment costs more than most annual licences here, which is exactly what disciplined ecommerce inventory management is meant to prevent.
Price the tool against that, not against the seat rate. Luca AI is priced flat at €299 and €499 so the calculation stays simple, and so a slow month does not turn into a surprise invoice. You can see the full tiers on the Luca AI pricing page.
Q5. What Do Real Operators Say About These Tools? [toc=5. Verified User Reviews]
Triple Whale holds 4.5 on G2 across 478 reviews, with recurring attribution and billing complaints. Polar holds 4.8 across roughly 50 reviews, praised for flexibility and criticised for clunky ad syncs. A 4.8 from 50 reviews is weaker evidence than a 4.5 from 478. Read the one-star reviews from the last six months before you read the marketing page.
📊 Ratings Only Mean Something With Denominators
Review Evidence Weight and Dominant Complaint Themes
Tool
Review Evidence Weight
Dominant Complaint Theme
Triple Whale
4.5 on G2, 478 reviews
Sync errors and numbers not tallying with Shopify
Polar Analytics
4.8 on G2, roughly 50 reviews
Support response times after onboarding
Glew.io
Mixed, 1.5 to 5 star spread
Data accuracy and limited filters
Improvado
3.5 to 5 star spread
Steep learning curve, inconsistent delivery
Microsoft Power BI
High volume, long history
Performance limits on large datasets
Luca AI is not in this table because its review base is smaller than Triple Whale's, and pretending otherwise would break the rule this section is built on.
⚠️ Theme One: Numbers That Do Not Tally
The most repeated complaint across this category is not missing features. It is data that disagrees with the source system, which is the failure mode good ecommerce reporting exists to prevent.
"Some data we still notice discrepancies between platforms, for example, tracking ads, and differences in the reported metrics like revenue." — Verified User, Triple Whale - G2 Verified Review
"Data was often not accurate and adding new data sources was hard. The visualization was also subpar." — Verified User, Glew.io - G2 Verified Review
❌ Theme Two: Support Falls Off After Onboarding
Sales attention is high before the contract. Reviewers describe it thinning quickly afterwards.
Ask any vendor one question before you sign: who owns my account in month seven? Get the answer in writing.
🧵 Theme Three: What Operators Say in Threads, Not Forms
Review forms get polished answers. Reddit threads get honest ones.
"Most brands don't need Triple Whale. I find it is mostly paid social marketers who want to report MER." — Reddit user, r/shopify Reddit Thread
"polar's UI is nice and flexible, but felt a bit clunky with ad syncs." — Reddit user, r/FacebookAds Reddit Thread
⭐ How to Read Any NPS Figure You See
Sentiment scores get quoted without sample sizes constantly. A +100 NPS built on four mentions is a rounding error wearing a suit.
Ask for the denominator every time. If the vendor cannot produce it, treat the number as marketing rather than evidence. The same discipline applies when you shortlist AI-powered BI tools for ecommerce.
💸 The Attribution Trap Behind Most One-Star Reviews
A large share of angry reviews in this category are attribution disputes. The tool said one thing, the ad platform said another, and the operator lost trust in everything.
One operator I know refuses to let media buyers report on ROAS alone, because ROAS as a standalone number does not survive contact with reality. He is right, and the review sections prove it weekly, as we showed in declining platform ROAS versus true profitability.
Luca AI is not an attribution pixel and does not try to be one, which is why it sits outside the attribution-accuracy fight that generates most of this category's one-star reviews. Keep your pixel. Use the reasoning layer for the questions the pixel was never built to answer.
Q6. Why Do Most BI Tools Still Leave E-commerce Operators Flying Blind? [toc=6. Where BI Tools Fail]
Gross margin tells you what it costs to make the thing, never what it costs to sell it. Load in shipping, returns, support tickets, and acquisition cost, and a 72 percent gross margin bestseller can land at 8 percent contribution margin. Most BI tools chart the first number and never compute the second, because the inputs live in four systems that were never joined.
💰 The Invoice on the Table
A founder I will call Maya slid an invoice across a table and said this was her best seller. Seventy-two percent gross margin. They could not make them fast enough.
We pulled her P&L, her shipping data, her return rates, and her support tickets. Twenty minutes later, the real contribution margin was 8 percent. She had scaled that product for two years, which is what happens when nobody tracks ecommerce unit economics properly.
🔗 Contribution Margin Is a Join, Not a Report
Here is the part that stings. Every number we needed was already sitting in her systems.
The problem was that no tool joined them. Luca AI computes contribution margin versus gross margin by joining Shopify, ad spend, 3PL, and accounting data at ingestion, which is the only reason that 8 percent shows up before a reorder, not after.
📉 Why CAC Belongs Inside the Margin
Classic accounting parks customer acquisition cost in a marketing line. That treatment hides the truth at the SKU level, and it quietly distorts your ecommerce profit margins.
If you spend money to acquire a customer to sell that unit, it is a variable cost of that sale. Leave it out and every product looks healthier than it is.
🔄 The Twist: The Build Depreciates Faster Than the Licence
One founder told me his company spent about $10 million building a system to turn data into meaning. Then general reasoning models arrived and did it better.
That is the uncomfortable lesson of the last two years. Custom data-to-meaning layers now age faster than the contracts signed to fund them.
⚠️ Legacy Dashboards Have the Same Problem, Slower
Chart engines with AI panels bolted on return descriptions, not decisions. One operator who migrated away told me his old stack had fallen behind on how AI-ready it was.
Another described his cloud data experience as logs and logs of data you cannot make a decision from. Volume was never the constraint. Interpretation was, which is the entire argument for decision intelligence tools.
✅ What This Means for Your Next Contract
Prefer layers you can swap. Your warehouse should outlive your BI vendor, and your BI vendor should outlive your dashboard preferences.
Refuse multi-year lock-in on anything AI-adjacent, because the capability curve is still moving quarterly. A twelve-month term costs a few percent more and buys you the right to change your mind.
⏰ The Question I Am Still Sitting With
I think the reporting layer collapses into the reasoning layer within 18 months. Dashboards become an output format, not a product, and agentic BI becomes the default.
Luca AI's read is that the standard advice gets this backwards, because operators are told to fix their dashboards when the real fix is joining the data underneath them. I could be reading that too strongly. Tell me what your Monday report actually costs you, and I will tell you whether I still believe it.
Q7. How Do You Choose and Roll Out the Right SaaS BI Tool for Your Stage? [toc=7. Choosing and Rolling Out]
Choose in five steps: name the decision you cannot currently make, decide whether you need to own the data, model cost at your real seat count, check reviews with their denominators, then run a two-week trial on one live question. Single-channel under $1M a year, stay on native reports. Multi-channel past that, buy the layer, not the dashboard.
✅ The Five Selection Steps
Name the decision you cannot make today. Reorder timing, channel cuts, price changes. One decision, written down.
Decide if you need your rows to be portable. If yes, warehouse-native or a reasoning layer above your own warehouse.
Model cost at your real seat count, not the demo count. Include viewers, implementation, and training.
Read reviews with their sample sizes attached, and read the recent one-stars first.
Run a two-week trial answering only the question from step one.
⚠️ The Gate: Do You Need This Yet?
If you sell on one channel, under roughly $1M a year, with a small catalog, Shopify's native reports plus a disciplined spreadsheet will cover most decisions. Operators say this themselves in threads, and our Shopify analytics guide covers what those native reports actually do.
"Tripple Whale is way beyond what most Shopify stores need. You should just stick with Google Analytics and you can get 99% of what you need out of it." — Reddit user, r/shopify Reddit Thread
📊 Pick by Stage, Not by Popularity
Recommended BI Layer by Revenue Stage and Channel Mix
Stage
Channel Mix
Recommended Layer
Trade-Off You Accept
Under $1M
Single channel
Native reports plus spreadsheet
Manual hours, low cost
$1M to $5M
Shopify plus paid social
Reasoning layer, for example Luca AI
Less custom SQL control
$5M to $10M
Multi-channel plus marketplaces
Warehouse-native
Engineering time and cost
$10M plus
Omnichannel with an analyst
Warehouse-native plus semantic layer
Slow time to first answer
⏰ The Four-Hour Trigger
Here is the simplest buy signal I know. If one person spends more than four hours a week rebuilding the same report, you are past the gate.
One operator described pulling Amazon data as two days and three pivot tables every month. That is a salary being spent on formatting, and it is the clearest case for automated ecommerce reporting.
🧩 Rollout Step One: Standardize Before You Connect
Fix SKU labels and reporting calendars first. Retail week conventions like 5-5-4 and 3-3-2 differ across partners, and mismatched calendars poison every comparison downstream.
Luca AI normalizes and standardizes data on ingestion, which removes most of this work, but SKU naming discipline still belongs to you and to your ecommerce product data management process.
👥 Rollout Step Two: Expect Your Excel Team to Resist
Your most resistant user will be your best spreadsheet modeller. Their macro already works, and you are asking them to rebuild it.
Frame the tool as an administrative shield, never a headcount cut. The honest line is that it should do 80 to 90 percent of the work, not replace the person doing it.
⚠️ Rollout Step Three: Keep a Human on Final Sign-Off
A premium bike brand once published a homepage image with the rear derailleur attached to the front wheel. Automated pipelines with no human QA produce exactly that class of error.
Do not let the AI be the QA. Name one person who signs off anything customer-facing.
💸 Rollout Step Four: Set Alerts, Not Dashboards
Ask Luca AI to watch three thresholds rather than building three dashboards nobody opens. ROAS dipping, inventory below reorder point, CAC spiking.
Alerts change behaviour. Dashboards mostly change your browser tabs, which is why ecommerce monitoring tools beat static reporting.
Luca AI fits the operator past the gate, running several channels with enough history to reason against. Connect the sources, ask the question you could not answer last Monday, and let the scheduled reports land in Slack after that. If you are below the gate, keep your money in inventory. Tell me what you are trying to see, and I will tell you honestly whether you need a tool for it yet, or start with the Luca AI use cases to see what other operators ask first.
FAQ's
What are SaaS BI tools and how do they differ from traditional on-premise BI?
SaaS BI tools are cloud-hosted business intelligence platforms accessed through a browser and maintained by the vendor. Nothing installs on your servers. They connect to your data sources, model metrics, and return answers, billed per seat, per compute capacity, or per dashboard view.
On-premise BI is the older model. The software runs on hardware you own, and your team patches it, scales it, and fixes it when it breaks at 2am.
The practical differences that matter to an operator:
Cost shape: SaaS turns a capital expense into a monthly one, which protects working capital sitting in inventory.
Speed: SaaS tools connect in days. On-prem builds take months.
Control: On-prem keeps every row on your infrastructure. SaaS trades some of that control for maintenance you never have to think about.
Upgrade pace: SaaS vendors ship improvements continuously, which matters enormously while AI capability is still moving quarterly.
For a DTC brand under 50 people, SaaS is almost always the correct trade. The real decision is not SaaS versus on-prem anymore. It is which SaaS layer you buy, since warehouse-native, embedded, and all-in-one tools fail in completely different ways. Our guide to ecommerce business intelligence walks through that layer choice in detail.
How much do SaaS BI tools actually cost once you add seats, viewers, and setup?
Published list prices run $10 to $75 per user per month, but almost nobody pays sticker. Negotiated rates land 25 to 50 percent below list at volume, and vendors discount hardest in the final week of a quarter.
The number that surprises finance teams is the all-in figure. A 25 to 50 user deployment realistically costs $100,000 to $150,000 a year once implementation consulting, data preparation, training, and the sandbox environment are counted.
Three pricing models to check before any demo:
Per-seat: the honest one. Microsoft Power BI starts at $14 per user monthly, the cheapest serious licence in this category.
Capacity: you pay for compute. It looks cheap at five users and stops looking cheap during Black Friday query spikes.
Per-view consumption: the sharpest trap. At $5 to $6 per dashboard view, or $12 per viewer across 500 customers, you are looking at $6,000 every month.
Luca AI does not meter dashboard views, so adding a merchandiser or a 3PL manager mid-year never reprices the contract. Two moves that work: ask for the discount band before the demo, and refuse multi-year lock-in on anything AI-adjacent. You can see our flat tiers on the Luca AI pricing page.
What is warehouse-native BI, and does an ecommerce brand really need to own its data?
Warehouse-native BI means your data lives in a warehouse you own, and the BI tool queries it there rather than copying it into the vendor's store. A common build is a pipeline tool like Fivetran feeding BigQuery, with Looker or Sigma on top. Polar Analytics runs a lighter version by provisioning a dedicated database per customer with SQL access.
Ownership matters for one reason: portability. If you cancel in 18 months, your rows leave with you, and the modelling work you paid for is not stranded inside a vendor you have outgrown.
The honest cost is engineering hours. Warehouse-native projects stall when the analyst leaves, and they routinely need weeks of paid setup before the first useful answer arrives.
Ask yourself three questions in this order:
If you cancel, do your rows leave with you? If no, you are in an all-in-one layer.
Do external customers need these dashboards? If yes, you need embedded, and you must model viewer fees first.
Does someone on your team write SQL weekly? If no, warehouse-native will stall before it pays.
Luca AI sits as the reasoning layer above whichever warehouse you choose, normalizing and standardizing data on ingestion, which removes the cleanup year most builds quietly bill for. Our breakdown of a modern ecommerce tech stack shows where those hidden hours usually sit.
Which SaaS BI tool is best for a Shopify brand doing between $1M and $5M?
At that stage, the right answer is a reasoning layer rather than another dashboard. You have enough history to reason against, several channels feeding data, and no budget for a full-time analyst.
Here is how the shortlist splits by job:
Cross-functional reasoning across marketing, inventory, and finance: Luca AI.
Daily profit and attribution for heavy paid social: Triple Whale.
Data ownership with SQL access on Shopify data: Polar Analytics.
SKU profitability and customer segmentation: Glew.io.
Cohort and retention depth for repeat-purchase brands: Peel Insights.
Skip Looker, Sigma, Power BI, and Domo at this stage unless you already employ an analyst. They are excellent tools that assume modelling work you are not staffed to do.
Luca AI is built for exactly this band, connecting 200+ sources including Shopify, Meta, Google, Klaviyo, and your accounting tools, then answering in plain English with root cause rather than charts. We are a poor fit below roughly $10K MRR, and a poor fit for enterprises already running a governed warehouse with a data team. If you are weighing options, our comparison of the best Shopify analytics apps covers the trade-offs tool by tool.
Do I need a BI tool yet, or are Shopify's native reports enough?
If you sell on one channel, under roughly $1M a year, with a small catalog, Shopify's native reports plus a disciplined spreadsheet will cover about 90 percent of your decisions. Operators say this themselves in threads far more bluntly than vendors ever will.
Three signals tell you the gate has been crossed:
The four-hour rule: one person spends more than four hours a week rebuilding the same report. That is a salary being spent on formatting.
Channel complexity: revenue arrives from Shopify, a marketplace, and paid social, and the three never reconcile.
Expensive commitments: a single style or SKU reorder runs into thousands, and you are placing it on gross margin rather than contribution margin.
That third signal is the expensive one. A 72 percent gross margin bestseller can land at 8 percent contribution margin once shipping, returns, support tickets, and acquisition cost are loaded in, and the inputs usually sit in four systems nobody joined.
Luca AI computes that join at ingestion, which is why the real margin surfaces before the reorder rather than after it. Below the gate, though, keep your money in inventory. Our explainer on contribution margin versus gross margin shows the calculation you can run manually today, for free.
Enjoyed the read? Join our team for a quick 15-minute chat — no pitch, just a real conversation on how we’re rethinking Ecommerce with AI - Luca
Loading Schedule...
Your AI Co-Founder is here.
Here’s why:
Shopify, Meta, Xero - one brain.
"Should I scale?" Answered with real data.
Growth capital. No applications. One click.
Thank you! Your submission has been received! Please book a time slot for the Meeting
Oops! Something went wrong while submitting the form.