
Repeat purchase analysis tells a Shopify brand how many first-time customers buy again, and which first products bring them back. Luca AI is an AI analyst for ecommerce brands, and it calculates your 60 and 90-day repeat purchase rate by cohort and by the first product each customer bought. It also lists the products and SKUs that don't drive repeat purchases, so you can see what earns a second order before you decide what to promote.
At a glance
| What it is | The share of first-time customers who place another order within 60 or 90 days |
|---|---|
| How it's split | By cohort (the month of the first order) and by the first product bought |
| What it flags | Products and SKUs that don't drive repeat purchases |
| What sits beside it | Repeat units, days between orders, days since last order and new against returning customers |
| Built from | Your Shopify orders, line items, customers and products, refreshed overnight |
| Where you see it | In chat, and on Numbers › Customers in the dashboard Luca's team sets up for your brand |
| What it never does | Say which ad, email or campaign brought a customer back, or change your store |
What the repeat purchase rate is
A repeat purchase rate is the share of customers who come back and buy again. On its own, that number mixes customers who joined last week with customers from three years ago. Luca fixes the comparison by grouping customers into cohorts by the month of their first order. It then counts how many ordered again within 60 days and within 90 days.
The same rate is split by the product each customer bought first. That is the view that answers the question most founders actually have: does the product people start with lead to a second order? Beside it, Luca calculates repeat units, days between orders, days since last order and the average value of a first order. All of these are standard for every brand that connects Shopify.
What you see
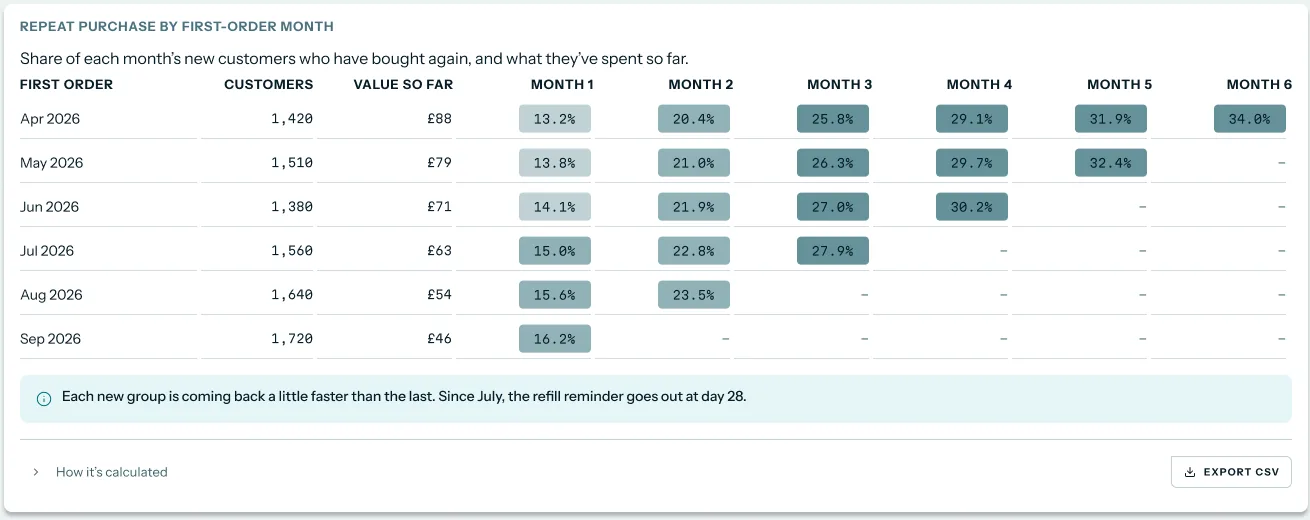
On the dashboard, the Repeat purchase by first-order month table puts one cohort on each row. You read across to see how the share of returning customers grows month by month. In chat, you can ask for the same cohorts at 60 and 90 days, split by first product.
 Illustrative example · demo brand
Each row is a cohort, so you compare like with like before you judge a product or a month. The figures are sample data for a demo brand.
What it is not
It is not attribution. The rate groups customers by when they first bought and what they bought first, not by the ad or email that reached them. It is not a subscription churn report either, although subscription brands can read the two side by side.
Why repeat purchase rate matters
What it's for
Repeat purchase analysis shows whether the customers you pay to acquire come back, and which first products lead to a second order. It turns a hunch such as "shampoo buyers reorder" into a number you can check every month.
How it helps
- Picks the right entry product. You see which first purchase leads to a second order within 60 or 90 days.
- Names the dead ends. Products and SKUs that don't drive repeat purchases are listed rather than guessed.
- Times the follow-up. Days between orders shows when the second order usually lands.
- Keeps cohorts fair. Every cohort gets the same window, so a young month isn't judged against an old one.
What happens without it
You promote what sells first, not what brings buyers back. A product can lead the first-order chart and still leave you paying to replace almost every customer it brings in. The cost stays hidden because first-order revenue looks healthy.
Why buyers care
Founders care when they choose what the homepage, the welcome offer or the next launch pushes. Growth leads care when a new customer costs more each quarter and the second order has to carry the margin.
The Luca AI approach to repeat purchase analysis
The founder of a Shopify haircare brand has a hunch. Customers whose first order is the holiday gift set seem to vanish. Customers who start with the shampoo seem to come back within 60 days. The homepage leads with the gift set, and she wants the numbers before she changes it.
The usual route is an orders export and a long session in a spreadsheet. Someone finds each customer's first order, tags the first product and counts second orders inside a window. It probably takes a day, and next month it has to be done again, often with a slightly different rule.
The data to settle this already sits in Shopify: every order, line item, customer and product. What's missing is one definition applied the same way every month, and a quick way to split it by the product people bought first.
Luca AI calculates the 60 and 90-day repeat purchase rate by cohort and by first product bought, straight from your Shopify data. It also names the products and SKUs that don't drive repeat purchases. The founder can ask in plain English how gift set starters compare with shampoo starters, and each figure links to the table it came from.
Luca reads your store and writes to none of your systems, so any homepage change stays your decision. Repeat rate by first product bought is the first column of the comparison grid, covered in How Luca AI compares for repeat purchase analysis, below.
How repeat purchase rate gets calculated
There are several ways to put a number on "customers who come back". Each one answers a slightly different question, and each one can mislead you if you use it for the wrong job.
Repeat customer rate across the whole store
Shopify's retention guide gives the simple version: customers who bought more than once, divided by unique customers. It gives you one headline number for loyalty. It misses timing, because customers from three years ago have had far longer to buy again than customers from last month. It also says nothing about which product brought anyone back.
Share of orders from returning customers
This counts how much of this month's trade comes from people who have bought before. It is useful for reading the mix of your revenue. It misleads when acquisition slows, because the returning share rises even if no new customer is coming back.
Purchase frequency
The same guide defines purchase frequency as orders placed divided by unique customers, over the same period. It shows how often the average customer buys. A small group of heavy buyers can lift it, and it doesn't separate a first order from a second one.
Fixed-window rate by cohort
Here you group customers by the month of their first order, then count who ordered again within a fixed window, such as 60 or 90 days. Shopify's lifetime value guide makes the same point: compare cohorts over equal periods so older groups don't look better simply because they had longer. The weak spot is the edge of the window. A customer who returns on day 95 doesn't count in the 90-day rate, and a cohort younger than 90 days has no final 90-day rate yet.
Repeat rate by first product bought
This splits the fixed-window rate by the product in the first order. It catches the question behind most homepage and welcome-offer decisions: which entry product leads to a second order? It misses two things. Small groups swing hard, and a gift buyer may not be the person who uses the product, so a low rate can reflect who bought rather than how good the product is.
Days between orders
This measures the gap between one order and the next. It tells you whether 60 or 90 days is the right window for your range and when a reminder should go out. An average hides the spread, so a product with a mix of fast and slow reorders can look ordinary.
What Luca calculates
Luca calculates the 60 and 90-day repeat purchase rate by cohort and by first product bought. It also calculates repeat units, days between orders, days since last order, the average value of a first order and new against returning customers. It lists the products and SKUs that don't drive repeat purchases, and it tracks monthly cohort retention from month 1 to month 35.
Read your repeat purchase rate
Start with the question you need to settle, then work through the checks below in order. Each one stops a common misreading.
Compare first products side by side
- Ask for the 60 and 90-day repeat rate by first product bought, for cohorts at least 90 days old.
- Put the customer count beside each rate. A product with 40 first buyers moves 2.5 points with every single customer.
- Sort by customer count, not by rate. The products that matter most have many first buyers and a low repeat rate.
- Check the list of products and SKUs that don't drive repeat purchases against what you currently promote.
Try asking Luca:
"For customers whose first order was in the last 12 months, what share ordered again within 60 and 90 days, split by first product bought?"
Read the gift-season cohort on its own terms
November and December cohorts are full of gift buyers, so their repeat rate is usually lower than a spring cohort's. Compare them with the same months a year earlier instead. Luca's cohort retention runs from month 1 to month 35, so last year's and the year before's holiday cohorts are there to compare.
Then check days since last order for those customers. If most gift set buyers have gone quiet for months, the low repeat rate is real and not just a slow start.
Decide what the homepage promotes
A low repeat rate doesn't settle the question on its own. Before you move the homepage, check three numbers for each product:
- First-order value. A gift set usually carries a larger first basket than a single bottle.
- Value so far by cohort. This shows whether repeat buyers outspend a bigger first order over six or twelve months.
- Days between orders. This tells you when the gain from a better entry product will show up.
Luca reads your Shopify store and never changes it, so the homepage, the theme and the offer stay in your hands. For how that access works, see how Luca's read-only access works.
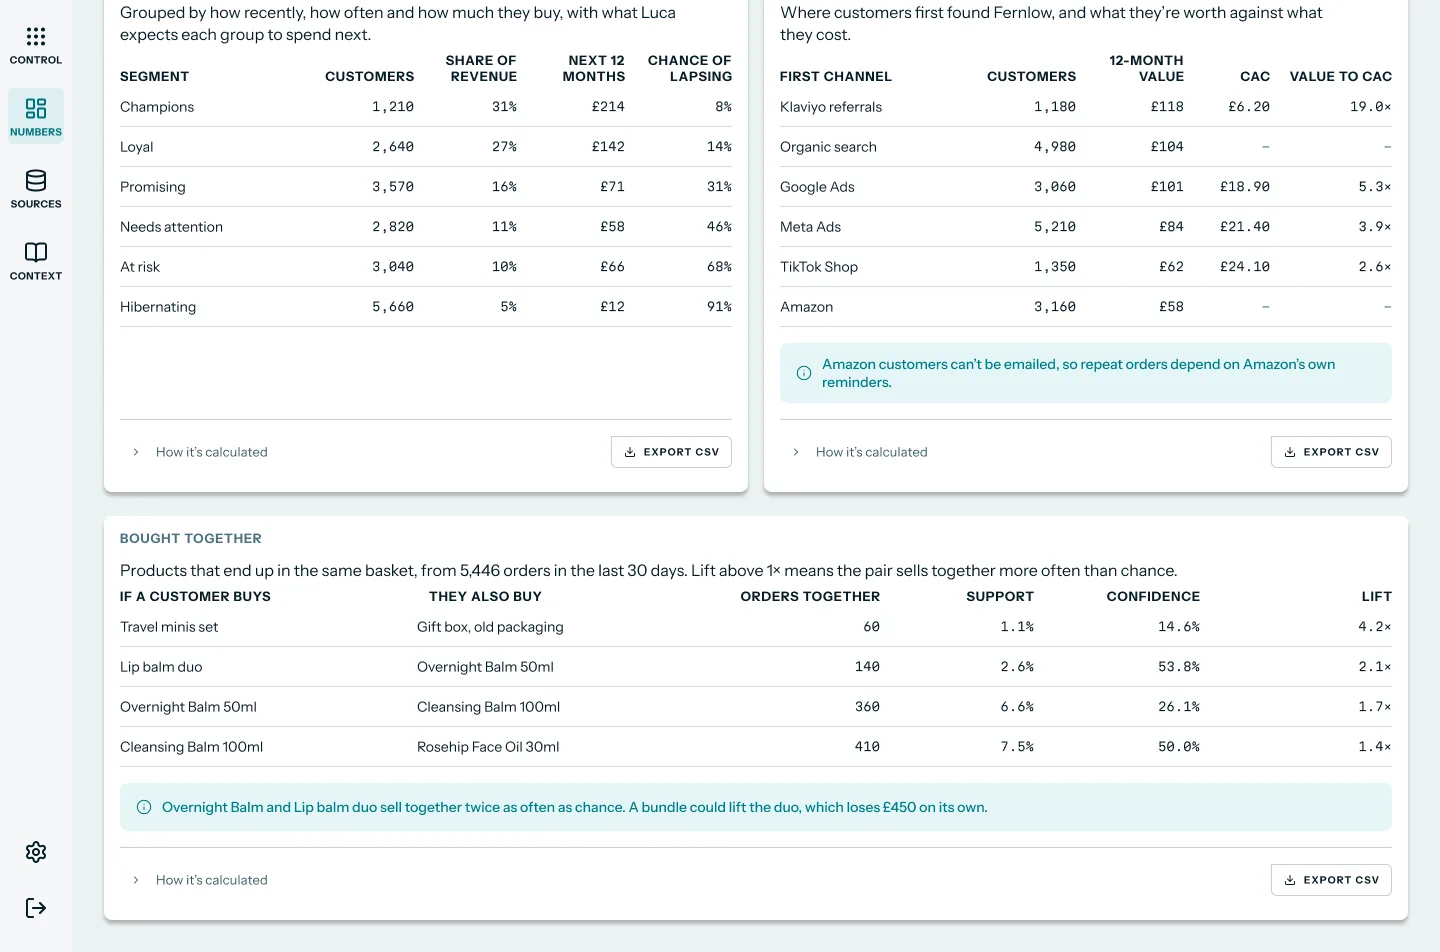
If the gift set has to stay on the homepage for the season, the bought-together table can help. It shows which products already sit in the same basket, which hints at what to pair with the set.
 Illustrative example · demo brand
Basket pairs show what already sells with an entry product, which helps when a weak repeater has to stay on the homepage. The figures are sample data for a demo brand.
Compare with similar brands
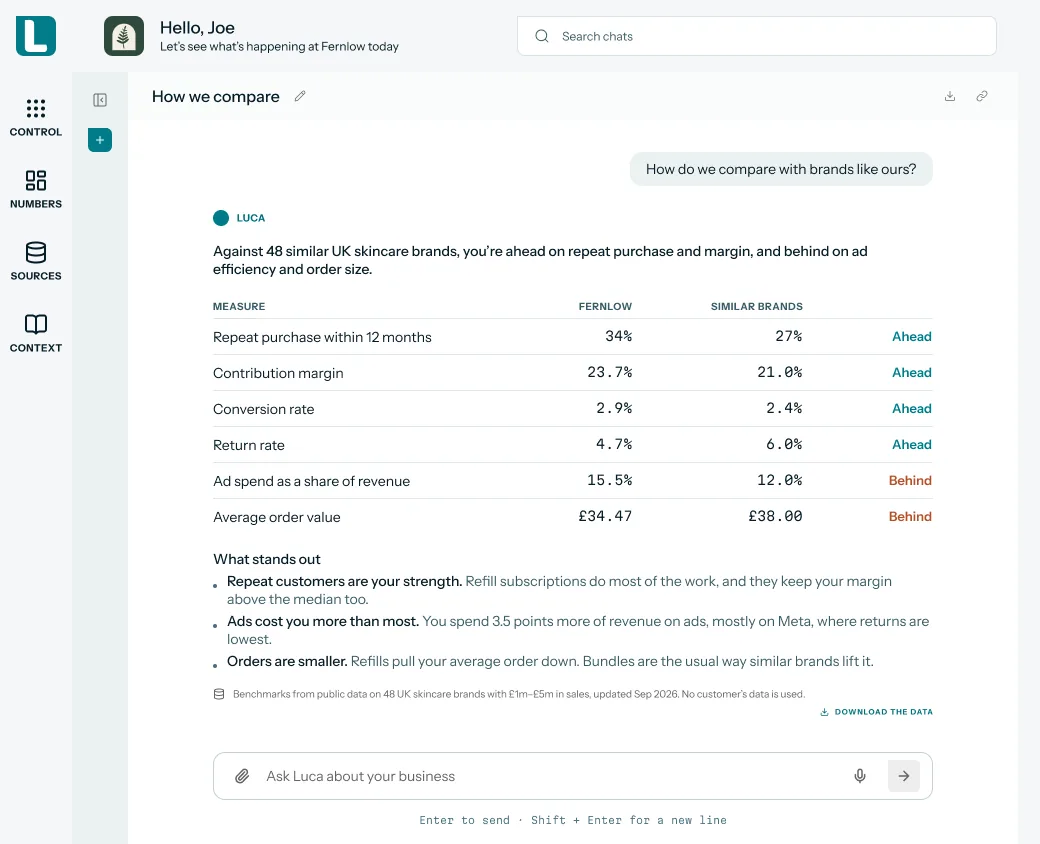
Shopify's retention guide suggests you compare performance against businesses with similar customers and buying patterns, as well as your own history. Luca benchmarks your brand against similar brands from public sources, so you can see whether your repeat rate is ahead or behind before you read it product by product.
 Illustrative example · demo brand
A benchmark tells you whether repeat purchase is a strength or a gap before you dig into products. The figures are sample data for a demo brand.
How to measure whether a product brings customers back
Two measures do most of the work here: the fixed-window repeat rate by first product, and days between orders. Read them together. The rate tells you how many come back, and the gap tells you when.
The weak spots
- Immature cohorts. A cohort's 90-day rate is only final once its last customer is 90 days past the first order. Leave younger cohorts out of any comparison.
- Small groups. With 40 first buyers, one customer is 2.5 points. With 2,000, one customer is 0.05 points.
- Mixed first orders. A first order with a gift set and a shampoo has to count somewhere. Decide the rule and keep it.
- Seasonal buyers. Gift-season cohorts behave differently from spring ones. Compare season with season.
- The window itself. If most reorders land at day 75, a 60-day window makes a good product look weak. Check days between orders first.
Where Luca shows them
Ask in chat for the 60 and 90-day rate by first product and days between orders, and each figure links to the table behind it. On the dashboard Luca's team sets up for your brand, Numbers › Customers shows cohort retention and Bought together. You can download an answer's data as CSV or Excel to share or check.
How to calculate repeat purchase rate in Shopify
The manual method
- Export your Shopify orders with customer ID, order date, line items and refunds, covering at least the last 12 months.
- Decide how to treat fully refunded orders and test orders, and write the rule down.
- For each customer, find the first order and record its date and the products in it.
- Tag each customer with one first product. Where a first order holds two products, choose a rule, such as the highest-priced item.
- Keep only customers whose first order is at least 90 days old.
- For each customer, check whether another order landed within 60 days and within 90 days of the first.
- Group customers by first-order month and first product, then divide repeat customers by all customers in each group.
- Put the group size beside each rate, and repeat the whole job next month with the same rules.
The same job in Luca
Connect Shopify, then ask the question in chat. Luca calculates the 60 and 90-day rate by cohort and by first product from your orders, with the same definition every month. The data refreshes overnight, so next month's answer needs no new export. You can ask follow-up questions across your connected sources, such as first-order value for the same groups, and download the result as CSV or Excel.
A worked example: gift set against shampoo
This is an illustrative calculation with sample figures, not a Luca output. It takes customers whose first order fell between November and January, all at least 90 days old.
| First product | First-time customers | Repeat within 60 days | 60-day rate | Repeat within 90 days | 90-day rate |
|---|---|---|---|---|---|
| Holiday gift set | 2,000 | 100 | 100 ÷ 2,000 = 5% | 160 | 160 ÷ 2,000 = 8% |
| Shampoo | 800 | 224 | 224 ÷ 800 = 28% | 288 | 288 ÷ 800 = 36% |
The hunch holds in this sample: shampoo starters return at more than four times the gift set rate. Now scale both to 1,000 new customers and add first-order value. The table assumes the same average second order for both products.
| Per 1,000 new customers | First-order revenue | Second orders within 90 days | Second-order revenue (£30 each) | 90-day revenue |
|---|---|---|---|---|
| Holiday gift set (£45 first order) | 1,000 × £45 = £45,000 | 1,000 × 8% = 80 | 80 × £30 = £2,400 | £47,400 |
| Shampoo (£18 first order) | 1,000 × £18 = £18,000 | 1,000 × 36% = 360 | 360 × £30 = £10,800 | £28,800 |
The shampoo brings 280 more second orders per 1,000 customers, but the gift set still earns more in the first 90 days. The decision turns on what happens after day 90 and on margin. So the next check is value so far for each group at six and twelve months, before the homepage changes.
Get your repeat purchase rate
- Connect Shopify. It connects self-serve, read-only, with your full order history.
- Wait for the first overnight refresh. Every source refreshes automatically once a day after that.
- Ask for the 60 and 90-day repeat rate by first product in chat.
- For the Numbers › Customers view, Luca's team sets up the dashboard with you.
- To add Amazon, Klaviyo or Recharge, use Get in touch on the source, and Luca's team sets it up.
How repeat purchase rate works with the rest of Luca
Shopify
Luca reads your orders, line items, customers, products and variants, discounts and codes, and refunds and returns. That is everything the repeat rate needs, including which discount a first order used.
Amazon Seller Central
With Amazon connected, Luca builds customer cohorts for your marketplace sales too. It reads Subscribe & Save and repeat customers, so you can see whether Amazon buyers come back the way your store buyers do.
Klaviyo
Luca's team connects Klaviyo read-only. Luca then shows Klaviyo's own projected lifetime value and churn probability per customer, beside the repeat rate you have already seen.
Recharge
For subscription brands, Recharge adds active subscribers, monthly and 90-day churn, and retention by plan. Luca's team sets it up. Reading subscriber retention next to one-off repeat purchase shows whether a product earns loyalty with or without a subscription.
Basket analysis
Luca finds products frequently bought together, with support, confidence and lift. It is a standard view, and it pairs well with the list of products that don't drive repeat purchases.
Alerts
Luca sends cohort-decay and retention-regression alerts, and you choose where they go: Slack, email or the app. A drop in a new cohort's repeat rate then reaches you before the monthly review.
Chat and your books
An answer can combine ad spend, store orders and the accounting ledger in one reply. That lets you set repeat revenue beside your margins in Xero or QuickBooks. For one shared set of definitions across dashboards and exports, see ecommerce KPI reporting.
Who uses repeat purchase rate, and how
Founders and CEOs
A founder checks which first product earns a second order before choosing what the homepage, bundles and launches push. The number also feeds the full picture of sales, ads, profit and cash she reads each morning.
Growth and marketing leads
A growth lead uses the repeat rate by first product to decide which product to feature in new-customer ads. Spend against store revenue sits in ROAS analysis, because the repeat rate never credits an order to an ad.
Subscription DTC brands
A subscription brand reads one-off repeat purchase next to subscriber retention by plan. That shows which products people reorder without a subscription, and which only stick when they subscribe.
Operations and inventory leads
An operations lead reads repeat units and days between orders to see how much demand returning customers bring. That sits next to demand forecasting for each product when setting reorder points.
How Luca AI compares for repeat purchase analysis
Luca splits the 60 and 90-day repeat purchase rate by the first product a customer bought and shows days between orders beside it. An answer can also bring in your accounting ledger. Luca AI is the only platform in this table that does all four.
Repeat purchase analysis features, from each platform's public documentation:
| Platform | Luca AI | Lifetimely by AMP | Daasity | Triple Whale | Shopify Sidekick |
|---|---|---|---|---|---|
| Repeat rate by first product bought | Yes | Yes (breakdown by product) | Yes (SKU-level repurchase rates) | Partly (SQL example for second product) | Not in docs |
| 60 and 90-day repeat windows | Yes | Yes (fixed repurchase windows) | Partly (rate within a timeframe) | Partly (share of orders from returning customers) | Partly (weeks since first purchase field) |
| Days between orders | Yes | Yes (Time between orders report) | Yes (time between orders views) | Not in docs | Not in docs |
| Store and accounting ledger in one answer | Yes | Partly (QuickBooks cost and expense sync) | Not in docs | Not in docs | Not in docs |
Yes: documented and built in. Partly: documented with a limit, shown in brackets. Not in docs: not found in the vendor's public documentation.
Why Luca AI is the stronger choice for repeat purchase analysis
- First product with a fixed window, ready to ask. Luca gives the 60 and 90-day rate by first product bought. Triple Whale documents an SQL example for the most common second product, which you adapt yourself. Read more in Triple Whale alternatives.
- Your books in the same answer. Luca can combine store orders with your Xero or QuickBooks ledger in one reply. Lifetimely documents a QuickBooks sync for cost and expense data. Read more in Lifetimely alternatives.
- A fixed 60 and 90-day window. Luca measures every cohort over the same windows. Daasity's glossary defines its repeat purchase rate as a measure of loyalty within a timeframe. Read more in Daasity alternatives.
Competitor details checked against each vendor's public documentation on 7 November 2026. Features and plans change, so confirm with the vendor before you decide.
Limits of repeat purchase rate
- Read-only. Luca reads your store and writes to none of your systems. Changing the homepage, a bundle or an offer is always your step.
- Grouped by first purchase, not by ad. The rate groups customers by first-order month and first product. It never credits a second order to an ad, email or campaign.
- Overnight data. Every source refreshes once a day, overnight, so today's orders appear tomorrow. A daily revenue forecast covers the days ahead.
- Mature cohorts only. A cohort's 60 or 90-day rate is complete only once the cohort is that old.
- Team-set sources. Klaviyo and Recharge are set up by Luca's team, not self-serve. Shopify and Amazon Seller Central connect self-serve.
Common questions
What is a repeat purchase rate?
A repeat purchase rate is the share of customers who buy again after their first order. Luca measures it over fixed 60 and 90-day windows for each first-order cohort, and splits it by the first product each customer bought.
How do you calculate repeat purchase rate?
Take the customers whose first order fell in a period, count those who ordered again within your window, and divide by all of them. For example, 160 repeat customers out of 2,000 gives an 8% rate for that window.
What is the difference between repeat purchase rate and retention rate?
Repeat purchase rate asks whether a new customer placed a second order within a window. Cohort retention follows each month's new customers over time, and Luca tracks it from month 1 to month 35. Read them together on the customer retention analysis page.
Why use a 60 or 90-day window?
A fixed window gives every cohort the same time to come back, so older cohorts don't look better just because they have had longer. Check days between orders first, so the window matches how fast your range is used up.
Which products count as not driving repeat purchases?
Luca lists the products and SKUs that don't drive repeat purchases as a standard view for every brand with Shopify connected. Read each one with its customer count, because a product with few first buyers can look weak by chance. The same list feeds one set of KPI definitions across dashboards and exports.
Can Luca tell me which ad brought a customer back?
No. Luca groups returning customers by when they first bought and what they bought first. It never credits a second order to an ad, email or campaign. Spend against store revenue is covered in ROAS analysis.
Will Luca change my homepage or my store?
No. Luca reads your Shopify store and writes to none of your systems. It shows which first products bring customers back, and you decide what the homepage promotes. An AI agent for your store works the same way.
Do gift buyers drag the repeat rate down?
They often do, because the person who buys a gift set may not use it, and the person who uses it never appears as a customer. Compare gift-season cohorts with the same months a year earlier rather than with spring cohorts.
How soon can I see a new cohort's repeat rate?
Orders appear after the overnight refresh, so a cohort builds day by day. Its 60-day rate is only complete 60 days after the cohort's last first order, and its 90-day rate after 90 days.
Does it work for Amazon customers?
Yes. With Amazon Seller Central connected, Luca builds customer cohorts for marketplace sales and reads Subscribe & Save and repeat customers. Repeat units also help with forecasting each product's demand. Luca's team sets up the Amazon connection with you.
Can I export the repeat purchase figures?
Yes. You can download an answer's data as CSV or Excel. Each figure in the answer also links to the data table it came from, so a colleague can check the numbers.
What are repeat units and days between orders?
Both are standard KPIs that sit beside the repeat rate. Days between orders is the gap between one order and the next, which tells you when a reminder or a second offer should land. Repeat units counts units on repeat purchases.
How does it fit with customer lifetime value?
Luca calculates historical lifetime value by acquisition cohort from the same orders. A higher repeat rate usually shows up later as higher value so far. The guide to ecommerce customer lifetime value explains the link and LTV to CAC benchmarks.
Is my repeat rate good compared with similar brands?
Luca benchmarks your brand against similar brands from public sources, including repeat purchase. Use that to see whether repeat purchase is a strength or a gap before you read it product by product. It sits alongside sales, ads, profit and cash in one place.
Updated 7 November 2026: first version, with how repeat purchase rate gets calculated, how to measure whether a product brings customers back, the manual method with a worked example, and the comparison grid.