
How to increase average order value is the question most Shopify founders ask once ad costs climb, because a bigger basket pays for the same click twice over. The hard part is knowing which lever to pull first: a bundle, a free-shipping threshold or a small add-on. Luca AI reads your Shopify orders and shows what already drives your average order value (AOV), by product, sales channel and new against returning customers. You choose the offer and run it in your store; Luca never changes your store or your prices.
At a glance
| The question it answers | Which products, channels and customers lift your average order value, so you know which offer to test first |
|---|---|
| AOV figures | AOV for all orders and for first orders, calculated every day from your Shopify data |
| Splits you can see | New against returning customers, and net revenue on every connected sales channel |
| Products bought together | Ask in chat; Luca answers with pairs scored by support, confidence and lift |
| AOV by product or channel | Ask in chat in plain English, and follow up in the same thread |
| Where you see it | In chat, and on the dashboard Luca's team sets up with you |
| How fresh it is | Data refreshes once a day, overnight |
| What you do | Pick the test, set up the bundle, threshold or add-on in your store, then compare the numbers |
| What it never does | Run offers, change prices or edit your store. Luca only reads your data |
What average order value analysis in Luca is
Average order value is your revenue divided by the number of orders in the same period. Luca AI calculates it every day from your Shopify orders, for all orders and for first orders. It sets AOV beside the figures that decide whether a bigger basket is worth having: new against returning customers, gross margin by product, discount rate and refund rate.
The second half of the job happens in chat. You ask which products are bought together, what AOV looks like on orders that contain a given tin, or how AOV differs by sales channel. Luca answers from your connected platforms, and each figure links to the table it came from.
What you see in the new and returning table
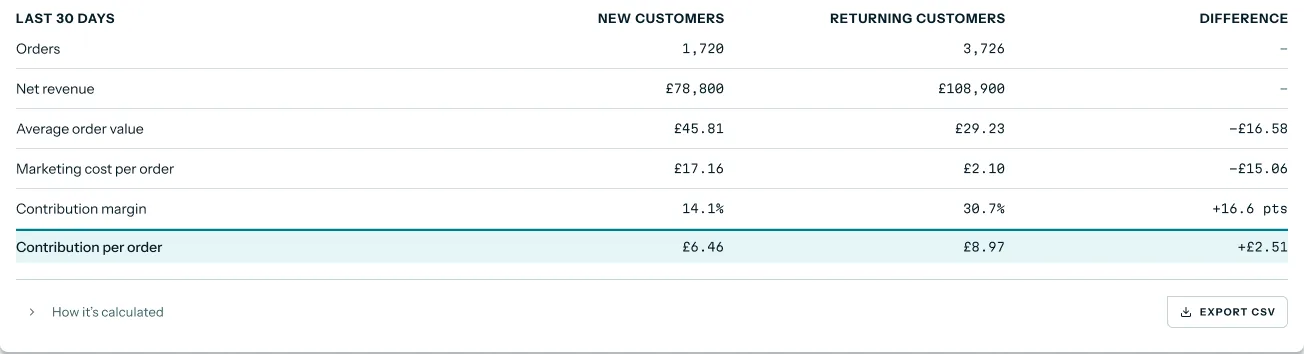
The dashboard Luca's team sets up with you can carry a table that compares new and returning customers over the last 30 days. It shows orders, net revenue and average order value side by side, so you see at once whose baskets are bigger.
 Illustrative example · demo brand
New customers' baskets here run higher than returning customers', which changes who an add-on offer should target. The figures are sample data for a demo brand.
What it is not
Luca is not an offer engine or a pricing tool. It doesn't create bundles, set your free-shipping threshold or show add-ons at checkout. It reads your data and tells you where the opportunity sits; your store and your apps run the offer.
Why average order value matters
What it's for
Average order value analysis tells you where a bigger basket is most likely to come from. It points your next offer at the products that already sell together and the customers who already spend more, instead of at a guess.
How it helps
- Pick one test, not three. You see which lever has the most room before you spend a month on it.
- Build bundles from real pairs. Pairs with high lift sell together more often than chance, so the bundle matches what people already buy.
- Target the right customers. New and returning customers often spend differently, so one offer rarely suits both.
- Check the margin, not just the basket. AOV sits next to gross margin and discount rate, so a bigger basket that earns less shows up.
What happens without it
You pick an offer because a competitor runs one, or because it worked for another brand. If it fails, you can't tell whether the idea was wrong or the target was. A discount-led bundle can also lift AOV while cutting what each order earns.
Why buyers care
Founders care most when paid acquisition gets dearer, because a higher AOV lets the same ad spend return more. Growth leads care before a promotion, when they have to choose which offer goes live first.
The Luca AI approach to average order value
Picture the founder of a Shopify loose-leaf tea brand. Her average order sits a few pounds under the line where free shipping starts. She has three ideas: a tin-and-infuser bundle, a change to the threshold, or a small sampler add-on. She can run one test this month.
The usual route is an afternoon in a spreadsheet. She exports orders, builds a pivot by product and tries to spot which teas turn up in the same basket. It may work, but it tends to miss that first orders and repeat orders look different. By the time the sheet is tidy, the data is already a few weeks old.
Yet the answer is already in her order history. Every Shopify order records what was bought, through which channel and whether the buyer was new. What she lacks is a quick way to split that history and ask follow-up questions of it.
Luca AI reads those orders every night and gives her AOV for all orders and first orders, split by new against returning customers. In chat it tells her which teas are bought together and how strong each pair is. Luca recommends; she decides, and she sets up the winning offer in her own store.
The new and returning table above shows AOV for both groups side by side, with the gap in its own column. That split, and the pair scores Luca gives in chat, are covered in How Luca AI compares for average order value, below.
How average order value gets raised
There are a handful of standard ways to raise basket size. Each catches a different kind of order and misses others, which is why the data should pick the first test. Shopify's guide to average order value lists seven, and the ones below matter most to a brand like the tea shop.
Free-shipping thresholds
A threshold asks the customer to add a little more to skip the shipping fee. It catches orders that land just under the line. It misses orders far below it, which may simply be abandoned. Shopify suggests you start from your modal order value, the most common order size, rather than the mean.
Bundles
A bundle sells two or more products together for less than they cost apart. It catches customers who would have bought both anyway, and nudges those who bought one. It misses when the pair isn't one people actually want together, so the bundle sits unsold.
Add-ons and cross-sells
A cross-sell offers a related product, such as a sampler or a tea strainer, beside the main item. Shopify's guide to customer lifetime value notes that upsells and cross-sells can lift AOV when the recommendation fits the purchase. A small add-on is easy to say yes to. It misses when the add-on has nothing to do with what is in the basket.
Upsells to a larger size
An upsell offers a bigger or better version of the same product, like a 250g pouch instead of 100g. It catches loyal buyers of one tea. It does little for first-time buyers who are still sampling.
Post-purchase offers
A post-purchase offer appears straight after checkout. It can't hurt the first sale, because the customer has already paid. Over time it also shows which products people add on their own, which feeds your next bundle.
Loyalty perks
Points, gifts or free shipping for repeat customers reward them for spending more. This catches returning customers well. It does little for a first order, which is often where the basket is smallest.
What Luca does in each case
Luca runs none of these offers. It gives you the numbers to choose between them: AOV for all orders and first orders, the split by new and returning customers, gross margin by product and the pairs that sell together. You set up the offer in Shopify or your apps.
Read your average order value
Start with the overall figure, then split it. An average on its own hides who is buying and what.
- Look at AOV for all orders and for first orders. If first orders are much smaller, an offer aimed at new customers has more room.
- Compare new and returning customers. The table shown under What it is gives orders, net revenue and AOV for each group.
- Ask how AOV varies by sales channel. Luca holds net revenue on every connected sales channel.
- Check the margin beside it. Gross margin by product and the discount rate tell you whether larger baskets earn more.
You can ask any of these in plain English and ask follow-ups in the same thread. The cross-source answers page explains how Luca combines platforms in one reply.
Find which products sell together
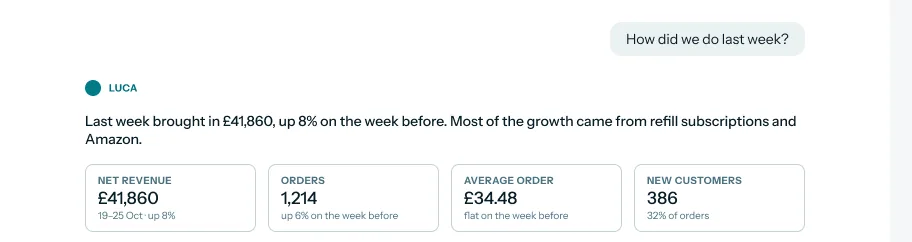
This is a question you ask in chat. Try "Which products are most often bought together in the last 90 days?" or "What do people add to the Earl Grey tin?" Luca answers with product pairs scored by support, confidence and lift.
 Illustrative example · demo brand
Average order appears in a plain chat answer, so you can follow up with a pair or product question in the same thread. The figures are sample data for a demo brand.
Read the pairs with care. A pair of two bestsellers will often appear together simply because both sell a lot, so look at lift before you build a bundle around it. If a pair has high lift but few orders, test it as an add-on before you commit stock to a bundle.
Pick the first test
Use what you found to choose one offer. The table matches each signal to the test it points to.
| What the numbers show | Test to try first | What to check after |
|---|---|---|
| Many orders land a few pounds under your free-shipping line | A threshold change or a clearer threshold message | Conversion rate and AOV for orders near the line |
| Two products have high lift and decent order counts | A bundle of that pair | Bundle share of orders and gross margin |
| First orders are much smaller than repeat orders | A small add-on or sampler for new customers | First-order AOV |
| Returning customers buy the same product each time | A larger size or a loyalty perk | Returning-customer AOV |
Shopify's AOV guide also advises running tests before scaling and checking whether they lift profit margins as well as AOV. Keep each test to one change, so you can tell what moved the number. For a wider view of how your customers come back, the customer retention analysis page covers cohorts and repeat buyers.
How to measure average order value
Two measures matter for this job: AOV itself, and how strongly two products sell together. Both have weak spots.
AOV and its weak spots
AOV is total revenue divided by the number of orders. The weak spots come from what goes into "revenue" and from the average itself:
- Definitions differ. Tools choose differently on discounts, shipping, tax and refunds, so two tools can show different AOVs for the same orders.
- Averages hide the common order. A few large orders pull the mean up. Shopify's guide suggests looking at the median and the mode as well.
- The mix moves the average. A month with more new customers can shift AOV even if nobody changed what they buy.
- A bigger basket isn't always more profit. A discount-led bundle can raise AOV and cut margin at the same time.
Pair strength: support, confidence and lift
Support is the share of all orders that contain both products. Confidence is the share of orders with the first product that also contain the second. Lift compares that with what you would expect by chance, so a lift above 1 means the pair sells together more often than chance alone would explain. Support tells you a pair is common; lift tells you the link is real.
Where Luca shows them
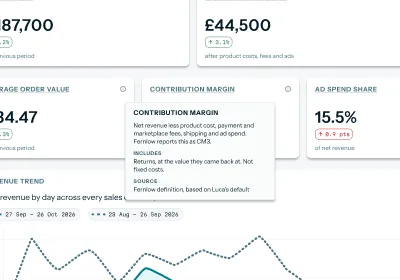
Luca calculates AOV for all orders and first orders as a standard figure. Pairs come back in chat with support, confidence and lift. Hover over a figure on your dashboard to read how it is worked out, and the Definitions page explains how every number is calculated.
 Illustrative example · demo brand
The definition on hover shows what each figure counts, which matters when your AOV differs between tools. The figures are sample data for a demo brand.
Before you compare Luca's AOV with another tool, check what each one counts. The KPI reporting page explains how one set of definitions carries through dashboards, chat and exports.
How to find what lifts average order value
The manual method
- Export the last 90 days of orders and line items from Shopify.
- Work out AOV for the period: total revenue divided by the number of orders.
- Split the orders into first orders and repeat orders, then work out AOV for each.
- Group orders into five-pound bands, to see how many sit just under your free-shipping threshold.
- Build a list of every pair of products in the same order and count how often each pair appears.
- For the top pairs, work out support, confidence and lift.
- Add gross margin per product, so you can see what each test would earn, not just what it would sell.
This takes an afternoon or more, and you repeat it every time you want fresh numbers.
The same job in Luca
Connect Shopify and Luca does steps 2, 3 and 6 for you every day. Ask in chat for the pairs, the AOV on orders with a given product, or the split by channel. Each figure links to the table it came from, and you can download the data as CSV or Excel. If you also want to see orders against your plan, the revenue forecast shows daily revenue ahead.
A worked example: three tests for a tea brand
This is an illustrative calculation with sample figures, not a Luca output. The table's first row sets the starting point: 2,000 orders a month at the average shown, with free shipping from the threshold in the last row.
| Test | Sample assumption | Extra revenue | New AOV |
|---|---|---|---|
| Baseline | 2,000 orders × £36 | £72,000 in total | £72,000 ÷ 2,000 = £36.00 |
| Sampler add-on at £6 | 1 in 5 orders adds it: 400 orders | 400 × £6 = £2,400 | £74,400 ÷ 2,000 = £37.20 |
| Tin-and-infuser bundle, £12 more than the tin alone | 1 in 10 orders switches: 200 orders | 200 × £12 = £2,400 | £74,400 ÷ 2,000 = £37.20 |
| Threshold message, free shipping from £40 | 500 orders sit between £35 and £40; 2 in 5 top up by £5: 200 orders | 200 × £5 = £1,000 | £73,000 ÷ 2,000 = £36.50 |
On paper the sampler and the bundle tie, each adding the same revenue. The tie breaks on two things the data can show: whether the tin and the infuser already sell together with high lift, and which of the two carries the better gross margin. If the pair is weak, the sampler is the safer first test.
Get your AOV figures in Luca
- Connect Shopify. It is self-serve with a one-click connection, and the set-up guide walks through it.
- Wait for the first overnight sync. Luca brings in your full order history.
- Ask your first AOV question in chat, for example "What was our average order value for first orders last month?"
- Ask Luca's team about a dashboard. They set it up with you, including the new and returning table.
How average order value analysis works with the rest of Luca
Shopify
Shopify is the source for AOV. Luca reads orders, line items, customers, products and variants, discounts and refunds. It writes nothing back, as the read-only access page explains.
Ad platforms
Luca compares ad spend and platform-reported results with store revenue. That tells you whether a higher AOV improves your returns overall. The ROAS analysis page covers break-even ROAS from your gross margin.
Xero and QuickBooks
With your accounts connected, Luca can combine ad, sales and accounting data in one answer. That helps when a bundle changes your costs as well as your basket.
Chat
Chat is where pairs, AOV by product and AOV by channel live. Ask follow-ups and Luca keeps the thread. The AI agents for ecommerce page shows the wider range of questions it takes.
Who uses average order value analysis, and how
Founders and CEOs
A founder uses it to decide which offer to try first and whether a bigger basket earns more. It sits beside the daily view of sales, ads and cash on the whole-business page.
Growth and marketing leads
A growth lead uses the new and returning split to target an offer. Before a promotion, they ask which pairs to feature and which customers to show them to.
CFOs and finance leads
A finance lead checks that a higher AOV doesn't come from deeper discounts. They read AOV next to the discount rate and gross margin by product.
How Luca AI compares for average order value
Most analytics tools show AOV, and several split it by new and returning customers. Luca AI adds pair scores for products bought together and answers follow-up questions in plain English. Luca AI is the only platform in this table that does all three.
Average order value features, from each platform's public documentation:
| Platform | Luca AI | Shopify | Lifetimely | Triple Whale | Northbeam | Saras Analytics |
|---|---|---|---|---|---|---|
| AOV for new and returning customers | Yes | Yes (AOV, first-time and returning customers) | Yes (new customer AOV) | Yes (New Customer AOV) | Yes (AOV for new and returning customers) | Yes (new customer AOV) |
| Bought-together pairs scored by lift | Yes | Partly (most common product combinations) | Partly (products commonly bought together) | Not in docs | Not in docs | Partly (Amazon market basket report) |
| Plain-English questions on your orders | Yes | Yes (Sidekick, in everyday language) | Partly (through Copilot Studio) | Yes (Moby, an AI chatbot) | Partly (through an external AI assistant) | Yes (Saras iQ in natural language) |
Yes: documented and built in. Partly: documented with a limit, shown in brackets. Not in docs: not found in the vendor's public documentation.
Why Luca AI is the stronger choice for average order value
- Pairs you can trust. Luca scores each pair by support, confidence and lift, while Lifetimely's Product Journey report lists products commonly bought together. Lift tells you whether a pair is real or just two bestsellers. Luca AI vs Lifetimely.
- Pairs and AOV in one place. Triple Whale documents New Customer AOV, and Luca adds bought-together pairs to the same chat. Luca AI vs Triple Whale.
- Combinations with a score. Shopify's Items bought together report shows the most common product combinations. Luca gives each pair a lift score, so you can rank bundle ideas before you build one.
Competitor details checked against each vendor's public documentation on 7 November 2026. Features and plans change, so confirm with the vendor before you decide.
Limits of average order value analysis
- Luca never runs the offer. It doesn't create bundles, change prices, set thresholds or show add-ons. You do that in Shopify or your apps.
- Pairs come from chat. You ask for bought-together pairs in chat rather than opening a separate basket screen.
- No order-level attribution. Luca compares ad spend with store revenue. It doesn't say which ad or campaign drove a given order or a bigger basket.
- Numbers are a day behind. Data refreshes once a day, overnight, so a test that starts today shows tomorrow.
- It compares periods, not split tests. Luca can compare AOV before and after a change. It doesn't split your visitors into test groups.
- The dashboard is set up with you. Luca's team sets up the dashboard with your brand; it isn't something you assemble yourself.
Common questions
What is average order value?
Average order value is the average amount spent per order. It is total revenue divided by the number of orders in the same period. Track it month by month, and read it next to margin, because a larger basket isn't always a more profitable one.
How do you calculate average order value?
Divide total revenue by the number of orders for the same period. For example, 2,000 orders that bring in 72,000 in revenue give an AOV of 36 in the same currency. Decide first whether revenue includes discounts, shipping and refunds, and keep that choice the same each month.
How do I increase average order value on Shopify?
The common levers are a free-shipping threshold, bundles, add-ons, upsells to a larger size, post-purchase offers and loyalty perks. Pick one based on your data: where orders cluster, which products sell together and how new and returning customers differ. Then test one change at a time.
Should I test a bundle, a threshold or an add-on first?
Test a threshold first if many orders land just under your free-shipping line. Choose a bundle if two products have high lift. Start with a small add-on if first orders are much smaller than repeat orders. Luca shows these signals; you choose and run the test.
Where should I set my free-shipping threshold?
Start from your most common order size, not only the average, because a few large orders can pull the average up. Set the line a little above where most orders land, so it feels within reach. Then watch conversion as well as AOV after the change.
Can Luca show which products are bought together?
Yes. Ask in chat, for example "Which products are most often bought together?" Luca answers with pairs scored by support, confidence and lift, calculated from your Shopify orders. You then decide whether to bundle a pair or offer one product as an add-on.
What do support, confidence and lift mean?
Support is the share of all orders that contain both products. Confidence is the share of orders with the first product that also contain the second. Lift shows how much more often they sell together than chance would predict. A lift above 1 points to a real pairing.
Can I see AOV for new and returning customers separately?
Yes. Luca calculates AOV for all orders and for first orders, and tracks new against returning customers. The dashboard Luca's team sets up with you can show both groups side by side, and you can ask for the split in chat.
Can I see AOV by product or by sales channel?
Yes, by asking in chat. Ask for AOV on orders that contain a given product, or AOV by channel, and follow up in the same thread. Luca holds net revenue on every connected sales channel.
Why does my AOV differ between Luca and other tools?
Tools count order value differently: before or after discounts, with or without shipping and tax, before or after refunds. Hover over a figure in Luca, or open the Definitions page, to see how it is worked out. Compare like with like before you trust a gap.
Does a higher AOV always mean more profit?
No. A bundle sold at a deep discount can raise AOV and cut margin per order. Read AOV next to gross margin by product and your discount rate. Where Luca's team has set up contribution margin for you, check contribution per order as well.
Does Luca change my prices or create offers?
No. Luca only reads your data and never changes your store, ads, email or books. It shows you which offer the numbers favour. You set up the bundle, threshold or add-on yourself in Shopify or your apps.
Can Luca tell me which ad brought in a bigger order?
No. Luca compares ad spend and platform-reported results with store revenue, which shows whether a higher AOV improves returns overall. It doesn't tie a single order, or its basket size, to a particular ad, creative or campaign.
How soon can I see the effect of a test?
Data refreshes once a day, overnight, so yesterday's orders appear the next morning. Give a test long enough to cover normal weekly swings, then ask Luca to compare AOV before and after the change, split by new and returning customers.
Updated 7 November 2026: first published with how average order value gets raised, how to measure AOV and pair strength, the manual method, a worked example and further reading.