
Amazon seller analytics usually starts with a monthly chore: download the settlement report, download the FBA inventory report, check Account Health, then paste it all beside your Shopify numbers. Seller Central shows Amazon on its own, so profit after fees takes a spreadsheet. Luca AI's ecommerce analytics connects to Amazon Seller Central once per region and reads your orders, fees, settlements, FBA stock, Buy Box and account health every night. It then shows each SKU's profit after Amazon fees beside Shopify, and it reads no Amazon Brand Analytics data.
At a glance
| What it is | A read-only connection from Amazon Seller Central to Luca, set up once for each Amazon region you sell in |
|---|---|
| What it reads | Orders, shipments and fulfilment, inventory, listings and offers, Buy Box, fees and settlements, refunds, promotions, sales rank, traffic and conversion, account health, Subscribe & Save and repeat customers |
| What it doesn't read | Amazon Brand Analytics data |
| How far back | Up to two years of Amazon history |
| How often | Once a day, overnight |
| What you get beside Shopify | Each SKU's sales, fees and profit across your own store and Amazon, plus Shopify and Amazon in one P&L |
| Account health | Order defect, late-shipment, pre-fulfilment cancellation, valid-tracking and on-time delivery rates, plus Buy Box and offer competition |
| How you connect it | Self-serve from Sources, approved on Amazon, once per region |
| What it never does | Change a listing, price, stock level or anything else in Seller Central |
What the Amazon Seller Central connection is
The connection is how your Amazon seller account gets into Luca. You approve it once for each Amazon region, and from then on Luca reads that region's sales, fees, settlements, stock and health data every night. It brings in up to two years of history, so your Amazon trends start from day one rather than from the day you connect.
Everything Amazon sends sits in the same private warehouse as your Shopify store, ad accounts and books. That is what lets one question cover both channels, such as which SKU makes more after fees on Amazon than on Shopify. For a wider look at running both channels, the guide to selling on Shopify and Amazon covers the full multichannel picture.
What you see on the Sources screen
Open Sources and look under Commerce. The Amazon Seller card shows Connected, how much history came in and the time of the last sync. Shopify sits next to it, so you can see at a glance that both channels refreshed overnight.
 Illustrative example · demo brand
The Amazon Seller card tells you how far back your Amazon numbers go and when they last refreshed, before you trust a trend. The figures are sample data for a demo brand.
What it is not
It is not a feed of Amazon Brand Analytics: Luca doesn't read that data, so anything you use it for stays in Seller Central. It is not Amazon Ads either, which is a separate source you connect on its own. It never writes back to Amazon, as the page on Luca's read-only access explains, and it never tells you which ad drove a given Amazon order.
Why Amazon seller analytics matters
What it's for
Amazon seller analytics tells you what each Amazon sale is really worth once Amazon has taken its fees. The underlying need is simple: see Amazon sales, fees, stock and account health beside Shopify, per region, without exporting reports.
How it helps
- Profit after fees, per SKU: you see which products earn more on Amazon and which earn more on your own store.
- Both regions in one view: UK and US sales sit side by side in your reporting currency.
- Stock you can plan around: FBA inventory levels sit next to Shopify stock and demand.
- Health in plain numbers: defect, late-shipment and cancellation rates show up before they become an account problem.
What happens without it
Without it, Amazon stays a separate business inside your business. Revenue looks healthy while fees quietly eat the margin, and you only find out when the month's settlement lands. Decisions about price, stock and channel mix get made on top-line sales.
Why buyers care
Founders care when Amazon becomes a large share of revenue and they can't say whether it makes money. Finance leads care at month end, when settlements, refunds and payouts have to agree with the books.
The Luca AI approach to Amazon seller analytics
Picture the founder of a UK baby-products brand. Muslin swaddles, sleep bags and nappy balm sell through her Shopify store and on Amazon in the UK and the US. On the first Monday of each month she logs into Seller Central for both regions. She downloads the settlement and FBA inventory reports and pastes them into a spreadsheet beside Shopify.
That routine probably works, but it can cost her most of a day each month. The numbers are also weeks old by the time she reads them. Two regions mean two sets of files, two currencies and columns that can shift between downloads. Product costs are matched to Amazon SKUs by hand, and account health sits on another screen.
What changed is that the data she downloads already exists in Seller Central every day. Nothing about her question requires a monthly cycle. She needs the same fees, stock and health figures, joined to Shopify, arriving on their own.
Luca reads her Amazon Seller Central account per region every night, read-only, with up to two years of history. It puts Amazon referral and FBA fees and settlements beside her Shopify sales. It shows each SKU's profit after marketplace fees in both channels, and it tracks FBA stock and marketplace health rates. She asks in plain English and gets one answer across both channels.
The at-a-glance table above lists what one connection covers: fees and settlements, FBA stock and account health, with each SKU's profit beside Shopify. How that set compares with other tools is covered in How Luca AI compares for Amazon seller analytics, below.
How Amazon seller analytics gets done
Sellers usually reach their Amazon numbers in one of three ways. Each catches something different, and each misses something.
Seller Central's own screens
Seller Central is where Amazon shows your account on its own terms. Its Account Health dashboard shows whether you meet Amazon's seller requirements and lists policy problems that need action. This catches account risk quickly, for one region at a time. It misses everything outside Amazon: your Shopify sales, your product costs and your other channels.
Monthly report downloads
Downloading settlement and FBA inventory reports into a spreadsheet catches fee detail line by line. You can join it to product costs and Shopify sales yourself. It misses timeliness, because you only see a month once it is over. It also breaks easily, since every region is a separate file and a changed column means a broken formula.
A daily connection to Seller Central
A connection that reads Seller Central every night catches the same orders, fees and stock, joined to Shopify without copying. Trends update daily, and every region you connect sits in one view. It misses only what the connection doesn't read, which you should check before you rely on it for a particular report.
What this means for your Amazon numbers
Luca is confirmed to use the third way. It reads Amazon Seller Central per region, once a day overnight, with up to two years of history. It covers orders, fees and settlements, refunds, FBA inventory, Buy Box, account health and repeat customers, and not Brand Analytics.
Read Amazon fees, settlements and profit beside Shopify
This is where the monthly spreadsheet usually ends up. Each part below replaces one tab of it.
Fees and settlements
Luca reads Amazon referral fees, FBA fees and settlements, and refunds. Payment and marketplace fees are reconciled to payouts, and returns and refunds come out of revenue and margin down to product level. That gives you net revenue with gross sales, discounts, returns, shipping and tax kept as separate lines.
Try asking Luca:
"How much did we pay in Amazon fees last month in the UK and the US, and how does that compare with Shopify's payment fees?"
Each SKU's profit beside Shopify
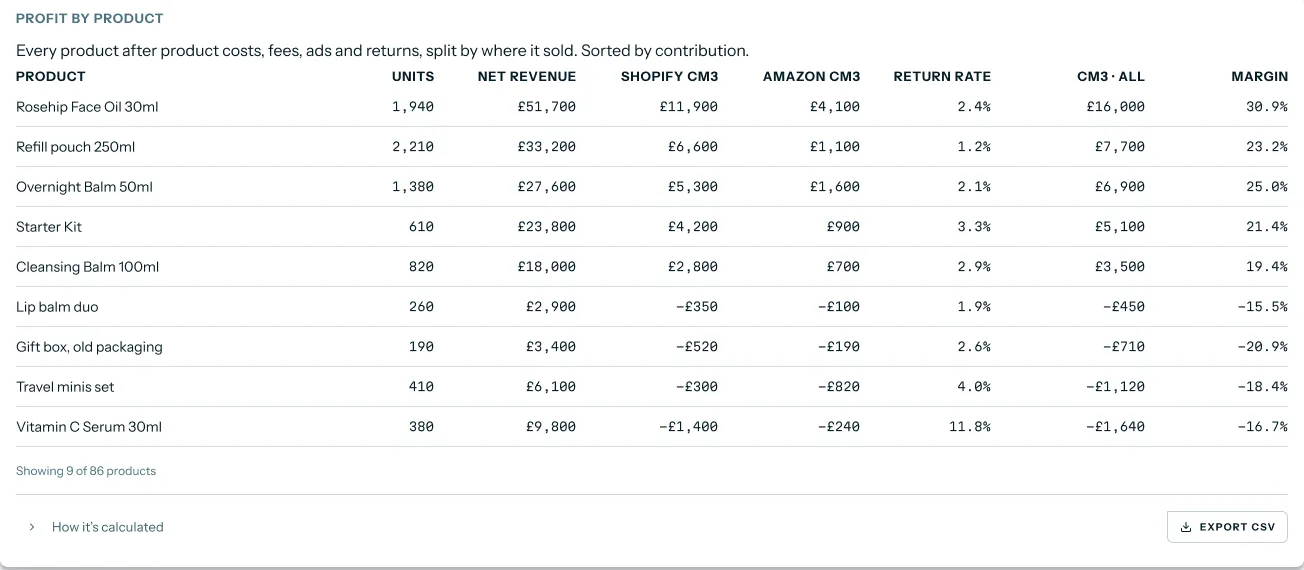
On Numbers › Profit, headed What each product, channel and month actually made, each product shows its contribution on Shopify and on Amazon side by side. Luca's team builds these dashboards for each brand, and they refresh every morning. Contribution margin is shown by layer, so you can see where a product's money goes: after product costs, after fees and after advertising.
 Illustrative example · demo brand
Each product's profit after costs, fees, ads and returns is split between Shopify and Amazon, which is the comparison a monthly spreadsheet tries to build. The figures are sample data for a demo brand.
Payouts and cash
Amazon payouts are reconciled, and cash is traced from sale to cash across Shopify, Stripe and Amazon. That matters because Amazon money arrives on Amazon's schedule, not on the day of the sale. The cash-flow forecast uses the same payouts when it looks ahead.
 Illustrative example · demo brand
Amazon payouts appear beside your other accounts, with a note when money is held back, so expected cash isn't mistaken for cash received. The figures are sample data for a demo brand.
UK and US in one view
Amazon Seller Central connects per region, so a seller in several regions connects each one. Luca then converts sales in any currency into your reporting currency at the daily rate. A country-level P&L lets you see the UK and the US separately as well as together.
Watch FBA stock, the Buy Box and account health
The second half of the monthly routine is operational: is there enough stock in Amazon's warehouses, and is the account in good standing?
FBA stock
Luca reads your Amazon FBA inventory levels every night, next to your Shopify stock. With FBA you pay storage fees on your stock and a fulfilment fee for each unit sold, and aged-inventory fees start after an item has sat in a fulfilment centre for more than 181 days. So too much stock costs you as surely as too little. Luca sets reorder points per product, and you choose the quantity and place the order yourself. The demand forecast shows how fast each product is likely to sell.
Buy Box and offer competition
The Featured Offer, which Amazon previously called the Buy Box, is the part of a product page where shoppers click to buy. Amazon's choice weighs price, fulfilment, stock and seller performance, and order defects and late shipments reduce your chances. Luca reads Buy Box and offer competition data alongside your sales, so a drop in Amazon sales can be read against it.
"Which of our Amazon listings lost the Buy Box most often last month, and what happened to their sales?"
Account health rates
Luca tracks the marketplace health rates Amazon reports: order defect rate, late-shipment rate, pre-fulfilment cancellation rate, valid-tracking rate and on-time delivery rate. The order defect rate counts orders with negative feedback, an A-to-Z Guarantee claim or a chargeback, and Amazon expects it below 1%. Seeing these rates each morning means you notice a slide before it threatens the account.
Repeat customers and Subscribe & Save
The connection also reads Subscribe & Save and repeat customers, which feed customer cohorts for your Amazon buyers. If you want to know whether Amazon buyers come back as often as store buyers, the guide to customer retention analysis shows how cohorts are read.
How to measure Amazon profit after fees
Two measures matter most for this job. Both look simple and both have a weak spot.
Net proceeds per unit
Net proceeds per unit is what Amazon leaves you per unit sold after its fees. A common check is to start with the sale price, then subtract the product cost and the referral fee, plus fulfilment and storage if you use FBA. The weak spot is timing. Refunds and some fees can belong to an earlier sale, so check which month each one lands in before you compare months.
Contribution margin by channel
Contribution margin is net sales minus variable costs, divided by net sales. Worked out per channel, it shows whether Amazon covers its share of overheads after fees. The weak spot is advertising: ad spend can be compared with a channel's sales, but no report can say which ad caused a given order.
Where Luca shows them
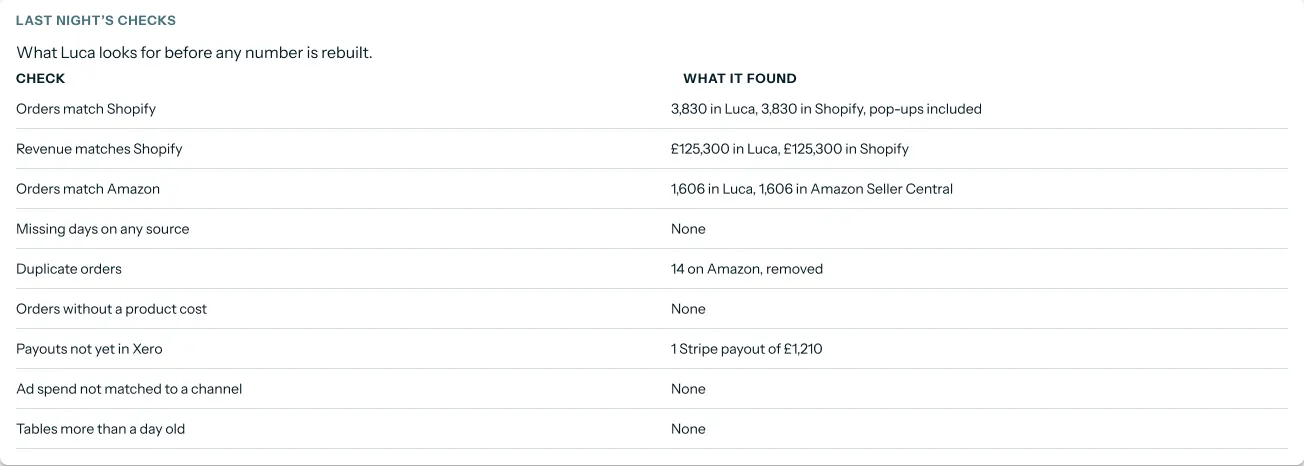
Luca shows Amazon net proceeds per unit after fees, and contribution margin by layer (CM1, CM2, CM3) for each channel and product. Before any number is rebuilt, the daily data-quality checks compare Luca's data with Amazon to catch gaps and duplicates. If they find duplicate Amazon orders, they remove them and say so.
 Illustrative example · demo brand
The checks show your Amazon order count matching Seller Central and duplicates removed, which is why profit figures can be trusted. The figures are sample data for a demo brand.
How to analyse Amazon sales and fees beside Shopify
The manual method
- Download the settlement report for each Amazon region you sell in.
- Download the FBA inventory report for each region.
- Export the same month's orders, refunds and payment fees from Shopify.
- Convert US dollar figures into pounds at a rate you record.
- Match each Amazon SKU to its Shopify product and its product cost.
- Work out profit per unit after fees in each channel, then multiply by units sold.
- Check Account Health in each region, and note any rate that moved.
The same job in Luca
Connect each Amazon region once. From then on Luca refreshes the same data every night, converts currencies at the daily rate and keeps each SKU's profit beside Shopify. You ask the question in chat, and one answer covers every source, from Amazon and Shopify to your books.
"Which products made more profit per unit on Shopify than on Amazon last month, after fees and returns?"
A worked example: one swaddle, two channels
This is an illustrative calculation with sample figures, not a Luca output. It follows one muslin swaddle sold at the same price on Shopify and through Amazon FBA in the UK, before advertising.
| Per unit | Shopify | Amazon UK (FBA) |
|---|---|---|
| Sale price, excluding VAT | £20.00 | £20.00 |
| Product cost | £6.00 | £6.00 |
| Payment fee | £0.40 | £0.00 |
| Shipping and packing | £3.00 | £0.00 |
| Referral fee | £0.00 | £3.00 |
| FBA fulfilment fee | £0.00 | £3.50 |
| FBA storage, per unit | £0.00 | £0.50 |
| Profit per unit | £20.00 − £6.00 − £0.40 − £3.00 = £10.60 | £20.00 − £6.00 − £3.00 − £3.50 − £0.50 = £7.00 |
| Contribution margin | £10.60 ÷ £20.00 = 53% | £7.00 ÷ £20.00 = 35% |
| Units in the month | 400 | 600 |
| Profit in the month | 400 × £10.60 = £4,240 | 600 × £7.00 = £4,200 |
Amazon sold half as many units again, yet made slightly less profit than Shopify. If the swaddle is short of stock, sending it to the store first earns more per unit. If Amazon brings in buyers the store never reaches, the lower margin may still be worth it.
Connect Amazon Seller Central
You need owner or admin access to the Amazon seller account. The set-up guide for Luca covers connecting Shopify first.
- Open Sources and find the Commerce group.
- Find the Amazon Seller card and click Connect.
- Approve read-only access on Amazon's own consent screen.
- Repeat for each Amazon region you sell in, such as the UK and the US.
- Check the card: once connected it shows its last sync time and how much history came in.
From the next overnight refresh, answers in chat combine Amazon with everything else you have connected.
How the Amazon connection works with the rest of Luca
Shopify
Shopify brings in its full history, Amazon up to two years. Together they give one view of each SKU's sales, fees and profit, and Shopify and Amazon in one P&L.
Amazon Ads
Amazon Ads is a separate, self-serve source. It brings in Sponsored Ads spend down to keyword, search term and placement, which you can compare with Amazon sales over the same period. The guide to ROAS analysis shows how spend is read against revenue.
Xero and QuickBooks
With Xero or QuickBooks connected, Amazon fees and payouts sit next to your ledger in the same answer.
Forecasts
Amazon history feeds a sales forecast for the channel. The revenue forecast and the demand forecast by product both use it.
Who uses Amazon seller analytics, and how
Founders and CEOs
A founder checks whether Amazon is adding profit or only revenue, and which SKUs belong on which channel. Seeing the whole business in one place puts Amazon next to the store, ads and cash.
CFOs and finance leads
A finance lead closes the month with Amazon settlements, refunds and payouts beside the books. The same definitions then flow into KPI reporting for the board.
Operations and inventory leads
An operations lead watches FBA stock against demand in each region and reorders before a best-seller runs out. The guide to planning stock covers that routine.
How Luca AI compares for Amazon seller analytics
Luca reads fees and settlements, FBA stock and account health from one Seller Central connection, and puts each channel in one P&L with Shopify. The others in this table document parts of that set, but not all four together.
Amazon seller analytics features, from each platform's public documentation:
| Platform | Luca AI | Daasity | Saras Analytics | Lifetimely | Triple Whale | Northbeam |
|---|---|---|---|---|---|---|
| Fees and settlements | Yes | Yes (Amazon Settlement Report) | Yes (settlement reports) | Partly (FBA fees in cost settings) | Partly (estimated FBA fees) | Not in docs |
| FBA stock | Yes | Yes (FBA Inventory reports) | Yes (fulfilment reports) | Not in docs | Not in docs | Not in docs |
| Account health | Yes | Yes (Account Health metrics) | Not in docs | Not in docs | Not in docs | Not in docs |
| Shopify and Amazon in one P&L | Yes | Not in docs | Not in docs | Yes (Consolidated Income Statement) | Partly (Amazon sales by fulfilment type) | Partly (Amazon revenue and Amazon Ads spend) |
Yes: documented and built in. Partly: documented with a limit, shown in brackets. Not in docs: not found in the vendor's public documentation.
Why Luca AI is the stronger choice for Amazon seller analytics
- Settlements next to Shopify, not beside it: Daasity documents an Amazon Settlement Report, while Luca puts Amazon fees and settlements in one P&L with Shopify. See Luca AI vs Daasity.
- Actual fees, not estimates: Triple Whale describes its FBA fees as an estimate until Amazon reports actual fees, while Luca reads Amazon fees and settlements directly. See Luca AI vs Triple Whale.
- Stock and health in the same place: Lifetimely documents FBA fees in its cost settings, while Luca also reads FBA inventory and account health rates. See Luca AI vs Lifetimely.
Competitor details checked against each vendor's public documentation on 7 November 2026. Features and plans change, so confirm with the vendor before you decide.
Limits of the Amazon Seller Central connection
- Seller Central only: Luca reads your seller account. It doesn't read Amazon Brand Analytics data.
- One connection per region: each Amazon region you sell in is connected separately.
- Two years of history: Amazon history goes back up to two years.
- Daily, not live: Amazon data refreshes once a day, overnight.
- Read-only: Luca never changes listings, prices, stock or settings in Seller Central.
- No order-level ad attribution: Amazon Ads spend is compared with sales, never tied to a single order.
- You place stock orders: Luca sets reorder points, and you choose the quantity and place the order.
Common questions
Does Luca read Amazon Brand Analytics data?
No. Luca reads your Amazon Seller Central account: orders, fees and settlements, refunds, FBA inventory, listings, Buy Box, account health and repeat customers. Amazon Brand Analytics data is not read, so anything you use it for stays in Seller Central.
What Amazon data does Luca read from Seller Central?
It reads orders, shipments and fulfilment, inventory, listings and offers, Buy Box, fees and settlements, refunds, promotions, sales rank, traffic and conversion, account health, Subscribe & Save and repeat customers. It writes nothing back to Amazon.
How far back does Amazon history go?
Luca brings in up to two years of Amazon history when you connect. Shopify brings in its full history, so Amazon comparisons start from up to two years back.
How often does Amazon data refresh?
Every source, Amazon included, refreshes automatically once a day, overnight. Each morning's numbers include the previous day's Amazon orders, fees and stock.
I sell in the UK and the US. Do I connect once or twice?
Twice. Amazon Seller Central connects per region, so you connect each region you sell in. Luca then converts sales into your reporting currency at the daily rate and can show the UK and US separately or together.
Can Luca change my listings, prices or stock on Amazon?
No. Luca only reads from the systems you connect and writes to none of them. The read-only access page explains what that covers.
Are Amazon referral and FBA fees included in profit?
Yes. Luca reads Amazon referral fees, FBA fees and settlements, and shows each SKU's profit after marketplace fees. Contribution margin is shown by layer, after product costs, after fees and after advertising.
Does Luca show FBA stock levels?
Yes. Luca reads Amazon FBA inventory levels every night and shows them beside your other stock. It sets reorder points for each product, and you choose the quantity and place the order.
Can I see Buy Box and account health rates?
Yes. Luca reads Buy Box and offer competition, plus order defect, late-shipment, pre-fulfilment cancellation, valid-tracking and on-time delivery rates. You can read them beside sales to see why an Amazon month moved.
Is Amazon Ads part of the same connection?
No. Amazon Ads is a separate, self-serve source. Once both are connected, you can compare Sponsored Ads spend with Amazon sales and with your ROAS by channel.
Will Luca tell me which ad drove an Amazon sale?
No. Luca compares ad spend and platform-reported results with your sales for the same period. It doesn't tie a given Amazon order to an ad, campaign or creative.
How do I check Luca's Amazon numbers match Seller Central?
Daily data-quality checks compare Luca's data with Amazon to catch gaps and duplicates before any number is rebuilt. When they find duplicate Amazon orders, they remove them and list the count under Duplicate orders.
Do I need to share my Amazon password?
No. You click Connect on the Amazon Seller card and approve access on Amazon's own screen. You need owner or admin access to the seller account.
Updated 7 November 2026: first published, with how Amazon seller analytics gets done, fees and settlements, FBA stock and account health, how to measure profit after fees, the manual method with a worked example, and thirteen common questions.