
Cross-channel e-commerce analytics usually means exporting from Shopify, each ad platform and your accounting software, then joining the files by hand. You want one answer, not three reports that never quite agree. Luca reads all of those sources from one private warehouse, so you can ask a single plain-English question and get one reply that draws on every system involved. This page shows how to ask those questions, which sources one answer can join, and how to check where each figure came from.
At a glance
| What it does | Answers one question from several connected sources at once, such as Shopify orders, ad spend and the Xero ledger |
|---|---|
| Sources one answer can join | Shopify, Amazon Seller Central, Amazon Ads, Meta, Google Ads, Google Analytics 4, Search Console, TikTok Ads, Klaviyo, Recharge, Xero, QuickBooks Online, Stripe and European banks through Open Banking, plus custom connectors the Luca team builds |
| What a reply contains | Figures, a chart where useful and next steps, with each figure linked to the table it came from |
| How it shows its working | Chat shows its reasoning steps and sources, and says when it doesn't have the data to answer |
| How fresh the data is | Every source refreshes automatically once a day, overnight |
| What it changes | Nothing. Luca reads every connected source and writes to none of them |
| Question limits | None on any plan (plans and pricing) |
| Where you ask | In the web app, and in Slack on the Leadership plan and above |
What cross-source answers are
A cross-source answer is a reply built from more than one connected system. Ask "what did we make after ad spend last month?" and the answer needs Shopify for orders, Meta and Google Ads for spend, and Xero or QuickBooks for costs. Luca makes that join for you, inside one conversation.
It works because every source you connect lands in one private warehouse for your brand. There, Luca models the data into consistent tables, then cleans, matches and checks it. Chat, Numbers dashboards and forecasts all read from that same warehouse, which is how one reply can combine ad spend, store orders and the accounting ledger. The guide to connecting Shopify, ads and Xero into one view explains why that layer matters.
Luca also calculates your KPIs itself rather than copying each platform's version. That matters when two tools define the same metric differently, as ad platforms and stores often do. For the wider idea of talking to your data instead of mining dashboards, read the guide to conversational analytics for e-commerce.
Your brand's warehouse is its own. Each customer's data sits in its own separate dataset, and the data is stored in the UK/EU. Your data is never used to train AI models, and only the fields a query needs are sent to the model.
The joins Luca runs for you
Some questions come up at almost every brand, so Luca already knows how to join the sources behind them.
- Real ad profitability. Luca joins ad spend from Meta, Google and Amazon with actual store orders and product costs, to show which campaigns make money, not just revenue.
- Cash reconciliation. Luca matches orders to Stripe or Shopify payouts and to the ledger in Xero or QuickBooks, so revenue, cash and the books agree.
- Search demand to revenue. Luca connects what people search for, how they arrive on the site and what they buy, with brand and non-brand demand split out.
- Retention economics. Luca combines Recharge, Klaviyo and order history to show which flows and offers keep customers, and what those customers are worth over time.
- Cross-channel product view. Luca gives one view of each SKU's sales, fees and profit across your own store and Amazon.
- Product quality signals. Luca lines up review sentiment against returns and sales by product, to spot problem SKUs.
What you see in a cross-source reply
A reply opens with a short title and the headline figures as tiles, followed by a few lines on what changed. A source line underneath names every system the answer was built from. Ask a follow-up and Luca keeps the thread, so a spend question can become a profit question in the next line.
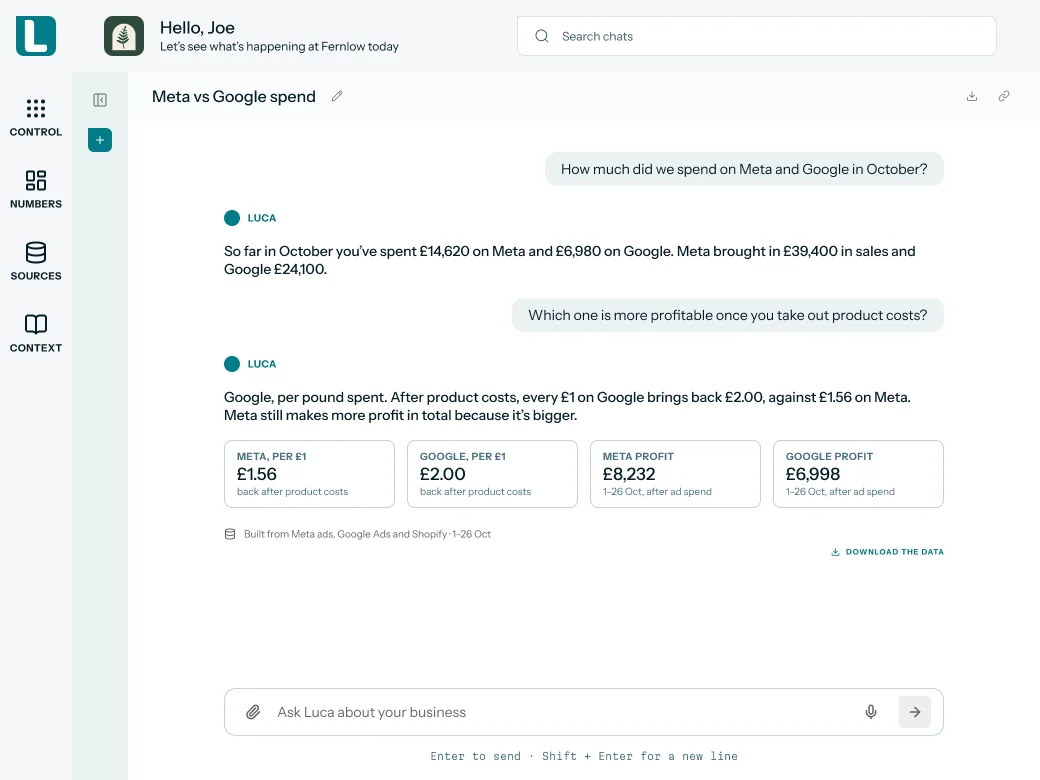 Illustrative example · demo brand
A follow-up turns a spend question into profit after product costs, joining Meta, Google Ads and Shopify in one thread. The figures are sample data for a demo brand.
Try asking Luca:
"What did we make after Meta and Google ad spend last month, using Shopify net sales and our Xero costs?"
Why cross-source answers matter
What it's for
Cross-channel e-commerce analytics exists to answer the questions no single tool can. It gives you one figure that already accounts for sales, ad spend and the books, so you can decide instead of reconcile.
How it helps
- One reply instead of three exports. You ask once, and Luca pulls from each system the question needs.
- Figures you can trace. Each figure links to its source table, so you can check it before it reaches the board.
- One set of numbers. Chat and dashboards read from the same warehouse, so they start from the same data.
- Follow-ups keep the thread. You can narrow by channel, product or month without starting again.
What happens without it
Without a joined view, every tool reports its own version of events. Ad platforms claim sales, the store counts orders and the ledger books costs weeks later. Someone has to line them up by hand, and the result is stale by the time it is shared.
Why buyers care
Finance leads and founders feel this most at month end and before a board meeting. That is when they need profit after marketing, and when they have the least time to build it. Lean teams gain the most, because the person asking is often the person who would build the spreadsheet.
The Luca AI approach to cross-source answers
The finance lead at a UK skincare brand closes each month in Xero. Sales sit in Shopify, and ad spend is split between Meta and Google. The board wants one number by Friday: what the brand made after marketing last month.
The usual route is three exports and a spreadsheet. It can eat most of a day, and the files rarely line up first time. An ad platform may credit a sale to the day of the click, while Xero records the cost when the bill arrives. Each fix is a judgement call nobody else can see.
The data was never the problem. Each system already holds its share of the answer. What was missing is one place where those shares sit side by side, defined the same way. Then a single question can reach all of them.
Luca gives her that place. She connects Shopify, Google Ads and Xero herself, approving read-only access on each platform's own screen. The Luca team sets up Meta with her. Every source refreshes overnight into her brand's warehouse. She asks her question in plain English, and Luca replies with the figure, a chart and next steps.
Each figure in that reply links to the table it came from, so she can show the board where the number started. How that holds up against other analytics tools is covered in How Luca AI compares for cross-channel e-commerce analytics, below.
How cross-channel figures are joined
Every cross-channel e-commerce analytics tool has to settle the same four questions before two sources can share one answer. That holds for a spreadsheet and for an AI analyst alike. Knowing the four helps you read any joined figure, including Luca's. The marketing and accounting ideas below follow Shopify's own guides.
Attribution: which sale belongs to which ad
Attribution decides which marketing touch gets the credit for a sale. Shopify's guide calls last-click attribution the most commonly used model, and it is the default in most ad platforms. It hands all the credit to the last ad clicked, so awareness campaigns can look as if they did nothing.
Each platform also counts inside its own window. Google Ads and Facebook use different default attribution windows: 30 days after a click for Google, and 28 days after a click or one day after a view for Facebook. Neither removes a sale that another platform also claimed, because Google Ads doesn't deduplicate conversions from other platforms. Add the platform totals together and they can come to more than your store sold.
Luca works from the store's side of that gap. It compares real, store-based ROAS with what each ad platform reports and shows the difference. It also compares ROAS with contribution margin, known as POAS, so you see which spend actually makes money. Where you want a multi-touch model, Luca's team helps you set one up.
Timing: when a sale and a cost are counted
Accounting adds a second clock. Accrual accounting records income when it is earned and expenses when they are incurred, whatever day the money moves. An ad platform dates a conversion to the click, while a supplier bill reaches Xero when it arrives. A joined figure has to pick one calendar and apply it to every source.
Definitions: one formula per metric
The same word can stand for different numbers. Marketing efficiency ratio, or MER, is total revenue divided by total marketing spend, which some teams call blended ROAS. Shopify's guide advises keeping the same revenue and spend definitions so that months compare fairly.
Margins work the same way. Contribution margin is net sales less variable costs, as a share of net sales, while gross margin takes off only the cost of goods. Agree which one the board means before you ask for it.
Matching: lining up records across systems
Finally, the records themselves have to meet. A Shopify order, a Stripe payout and a line in the Xero ledger can describe the same money in three places. Without matching, the same pound is counted twice or dropped, and the totals stop agreeing.
Luca does this matching for you. Sales are reconciled to payments, payouts and the accounting ledger, following your business's own order of sources of truth. Sales in other currencies are converted into your reporting currency at the daily rate.
What this means for a cross-source answer
In Luca, every source lands in one private warehouse for your brand. There it is modelled into consistent tables, then cleaned, matched and checked. Luca calculates your KPIs itself, so a metric keeps one definition whichever source it draws on. Metric definitions are governed in one place, with sensible defaults and your own definitions on top, so chat and dashboards give the same number every time. Product costs, shipping, fees and overheads follow your own cost rules. When attribution or timing matters, put it in the question, such as "by order date", and open the linked table to see how the figure was built.
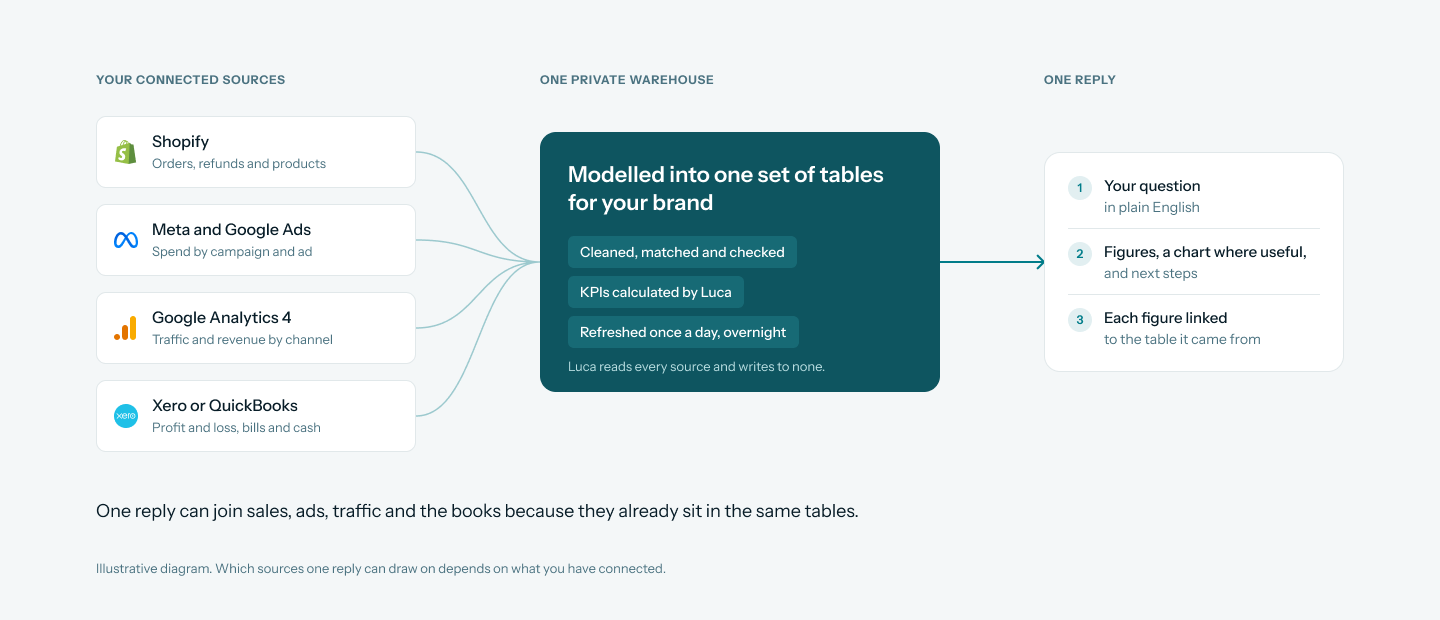
Illustrative diagram of how connected sources meet in one warehouse before a single reply is written, which is what lets one answer join them.
Ask one question across your sources
You don't build a report or write a query. You connect the sources, wait for the overnight refresh and ask.
- Connect the sources your question needs. Open Sources, click Connect on each card and approve read-only access on the platform's own consent screen. Shopify, Amazon Seller Central, Amazon Ads, Google Ads, GA4, Search Console, Xero, QuickBooks Online and Stripe connect self-serve.
- Let the team set up the rest. Meta connects through guided partner access with the Luca team. WooCommerce, Magento, Recharge and Klaviyo show Get in touch instead of Connect, and the team sets them up for you. If a source isn't listed, Luca's team builds the connector.
- Wait for the next overnight refresh. From then on, answers in chat can combine the new source with everything else you have connected.
- Ask in plain English. Type the question as you would ask a colleague, or speak it: Luca transcribes your question into the chat box and doesn't store the audio. You can ask in more than 50 languages, or pin a question from Luca's library of expert prompts.
- Name the period and the measure. "Compare last month's Meta and Google spend with Shopify net sales" gets a tighter answer than "how are ads doing?". If a question is ambiguous, Luca asks you to clarify before answering.
- Read the reply, then follow up. Ask "now split that by product" or "show it as a chart". Luca keeps the thread of the conversation, and its memory carries across conversations for everyone in your organisation.
- Ask why a number moved. When a figure jumps, ask why. Luca investigates what drove the change across the sources involved.
Questions that need more than one source
These questions each draw on two or more systems. Luca can only answer from the sources you have connected, so check the right-hand column first.
| Question you might ask | Sources it draws on |
|---|---|
| What did we make after ad spend last month? | Shopify orders and refunds, Meta and Google Ads spend, Xero or QuickBooks profit and loss |
| Which campaigns brought visitors who went on to buy? | GA4 traffic and revenue by campaign, Google Ads, Shopify orders |
| How do Stripe fees and refunds change our net revenue? | Stripe charges, fees and refunds, Shopify orders |
| Which products sell on Amazon but lag in our own store? | Amazon Seller Central orders and fees, Shopify products and orders |
| Are our debtor days moving as ad spend rises? | Xero or QuickBooks aged receivables, Meta and Google Ads spend |
| Which search queries lead to pages that sell? | Search Console queries and pages, GA4 landing pages, Shopify orders |
| Do last month's orders, payouts and the Xero ledger agree? | Shopify orders, Stripe or Shopify payouts, Xero or QuickBooks ledger |
| Which Klaviyo flows keep subscribers, and what are they worth over time? | Klaviyo flows, Recharge subscriptions, Shopify order history |
| Which TikTok, Meta and Google campaigns made money after product costs? | TikTok Ads, Meta and Google Ads spend, Shopify orders and product costs |
"Which products lost money after ads and returns last month?"
If your numbers need a structure first, the guide to contribution margin and gross margin and the explainer on cash flow, revenue and profit help you phrase the question.
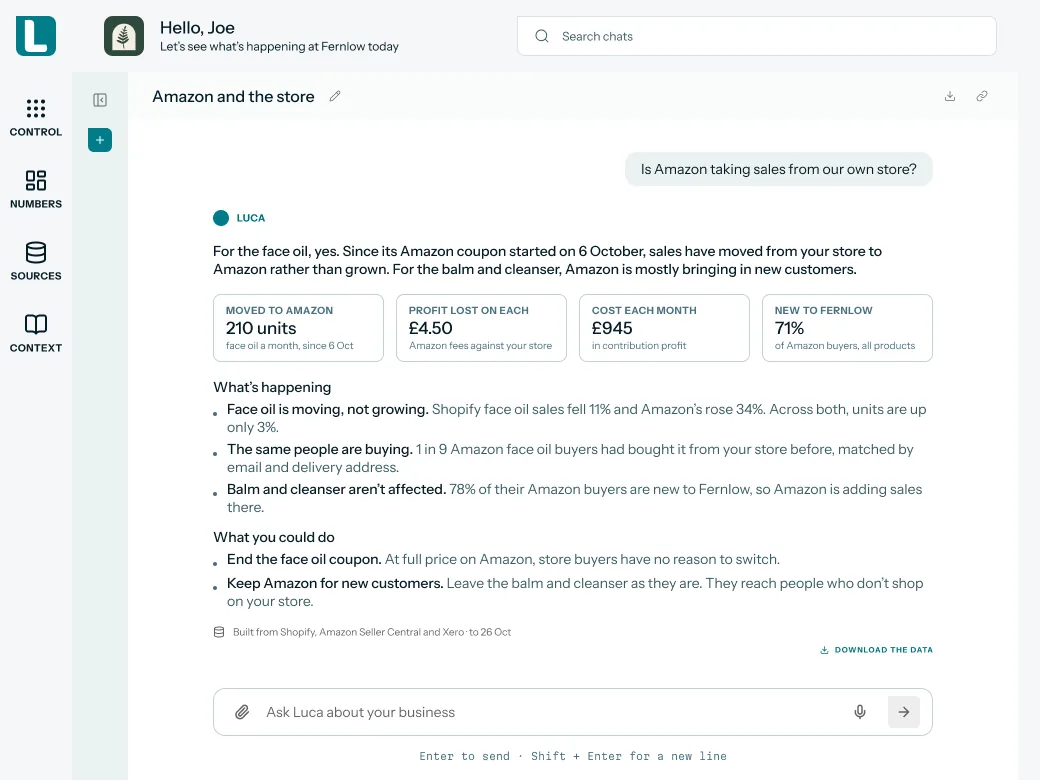 Illustrative example · demo brand
One question answered from three systems at once: store orders, marketplace sales and the Xero ledger. The figures are sample data for Fernlow, a demo brand.
Add a file to the question
Some answers need numbers that live in none of your systems yet, such as a supplier's new price list. Upload a PDF, spreadsheet, CSV or document straight into the chat. Luca then answers from the file alongside your connected store data.
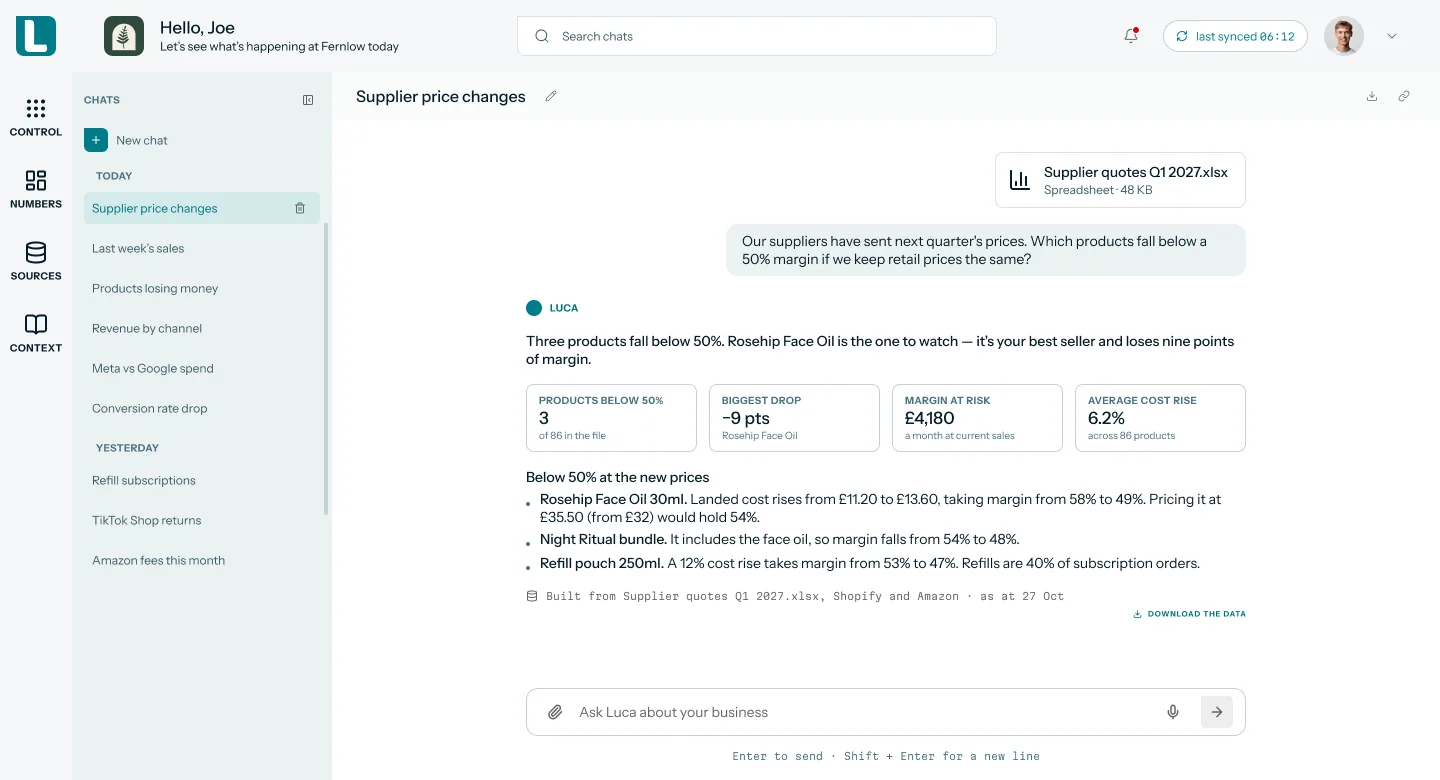 Illustrative example · demo brand
An attached spreadsheet joins your connected store data in the same answer, so new supplier prices meet real sales. The figures are sample data for a demo brand.
"Using this supplier spreadsheet, which products would fall below a 50% margin at the new prices?"
Check where a figure came from
Every figure in a reply links to the data table it came from. Open the link to see which source the number was built from before you forward it. That traceability is what separates a reply you can take to a board from a guess; Luca's article on evaluating data agents on your own store data explains why it matters.
Every answer also shows its working. Chat shows its reasoning steps and sources, and dashboards show the exact query behind each figure. Every priority brief ends with an appendix showing which data Luca used and how each figure was calculated. When Luca flags a change on its own, it uses anomaly detection with a stated method, the 2-sigma rule of two standard deviations.
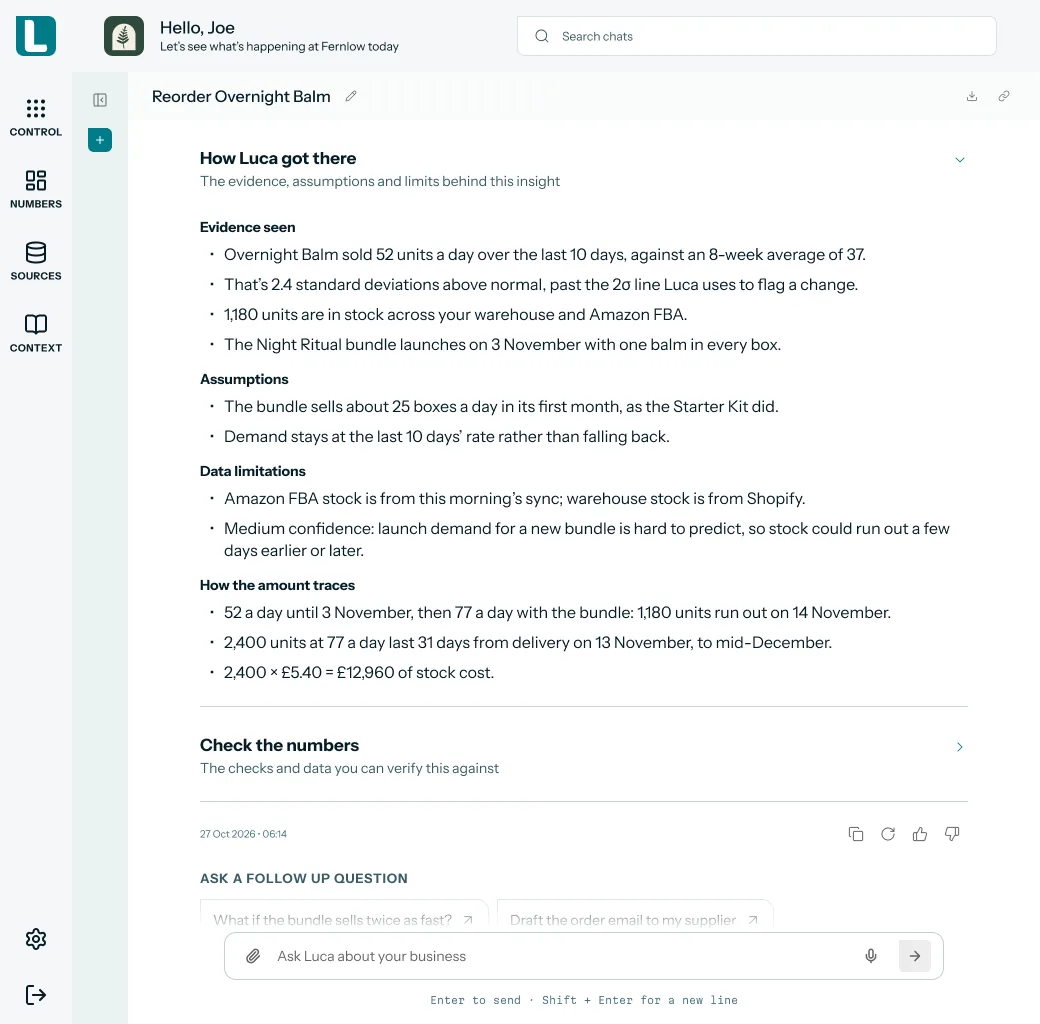 Illustrative example · demo brand
How Luca got there: the evidence, assumptions, confidence and arithmetic behind one answer, set out so you can check it before you act. The figures are sample data for Fernlow, a demo brand.
Luca also tells you when it can't answer. It knows which sources are connected and flags any that fail or go stale. It treats missing values as unknown rather than zero, and it says when it doesn't have the data or the confidence to answer, rather than guessing.
Data refreshes once a day, overnight, not in real time. If a figure doesn't match what a platform shows right now, check again after the next refresh. The overview of how Luca works shows the same daily cycle.
Share or export the answer
Download any reply's data as CSV, Excel, Word, PDF or PowerPoint, or share the conversation through a private, revocable link that search engines don't index. That makes it easy to pass one joined answer to an accountant or a board member without rebuilding it. For recurring packs, Luca's piece on automated reporting instead of more dashboards covers the wider workflow.
How to check a cross-source figure
A joined figure is only as good as its tie-outs. Finance teams usually run a handful of standard tests on a cross-channel number before it reaches the board, whichever tool produced it.
- Tie revenue to the store. Net sales in the answer should match Shopify's own report for the same dates, after refunds.
- Tie spend to the invoices. Ad spend should match what Meta and Google actually billed, not what a campaign budget said.
- Compare claimed with actual. Add up the revenue each ad platform reports. If the total is more than the store sold, the platforms are counting some orders twice.
- Check the calendar. Confirm whether each cost sits in the month it was incurred or the month it was paid.
- Allow for the refresh. A figure built after last night's refresh won't match a live platform screen later today.
Luca runs its own checks every day. Daily data-quality audits compare Luca's data with Shopify, Amazon and QuickBooks, and catch gaps, duplicates and stale tables. Because each figure in a reply links to its source table, the tie-outs above start from the right numbers. Luca also sends an alert when a connection fails or data goes stale, so a broken feed doesn't quietly skew a joined figure.
Month end and peak season in 2026
More of a brand's sales now run through more than one channel, which makes the joined view harder to skip. In Great Britain, the Office for National Statistics estimates that 28.8% of retail sales were made online in September 2026. Online spending in July to September was 7.4% higher than a year earlier. These are seasonally adjusted official estimates, and the ONS warns that monthly growth rates can be volatile.
The heaviest close of the year is coming. Black Friday falls on Friday 27 November 2026 and Cyber Monday on Monday 30 November. Over the same weekend in 2025, Shopify merchants sold 14.6 billion US dollars worldwide, a figure Shopify describes as approximate and unaudited. For a finance lead, November brings more ad spend, refunds and payouts to match than any other month.
Works with
- Shopify. Orders, line items, customers, products and variants, inventory by location, refunds, discounts, payouts and fees, with full history.
- Meta and Google Ads. Spend, clicks and conversions by campaign, ad and creative. Read why platform ROAS can mislead you before comparing them with store sales.
- Google Analytics 4 and Search Console. Traffic and revenue by channel and campaign, landing pages, the funnel, and search queries by page. See the guide to GA4 for e-commerce.
- Xero and QuickBooks Online. Profit and loss, balance sheet, cash flow and trial balance, plus invoices, bills, payments and aged receivables and payables.
- Stripe. Charges, processing fees, refunds, disputes, payouts and subscriptions.
- Amazon Seller Central and Amazon Ads. Orders, fees and settlements, FBA stock and Sponsored Ads, with up to two years of history.
- TikTok Ads. TikTok ad spend and performance, next to Meta and Google in the same answer.
- Klaviyo. Email and flow performance, including which campaigns and flows drove orders. Luca's team sets it up.
- Recharge. Subscriptions, charges, skips, cancellations and renewals. Luca's team sets it up.
- Banks through Open Banking. Xero and European banks through Open Banking, so cash in the bank sits next to sales and payouts.
- Custom connectors. Wherever your data lives, Luca can see it. If a source isn't listed, such as an ERP, a 3PL or another ad platform, Luca's team builds the connector.
- Slack. Ask Luca from Slack on the Leadership plan and above. The only thing Luca posts there is its own answers.
Who uses it
A head of growth checking ad returns
The growth lead asks which campaigns produced orders that stuck, after refunds. Luca joins Meta and Google Ads spend with Shopify orders and refunds in one reply. The guide to e-commerce KPIs beyond ROAS suggests the follow-up questions worth asking next.
A founder running the weekly numbers
A founder of a Shopify and Amazon brand asks how the week went across both channels. Luca answers from Shopify and Amazon Seller Central together, with marketplace fees already in the figures. Luca's article on why founders drown in data describes the problem this removes.
A finance lead closing the month
The finance lead asks whether last month's orders, payouts and ledger agree. Luca matches orders to Stripe or Shopify payouts and to the Xero or QuickBooks ledger in one reply, so revenue, cash and the books agree. The explainer on cash flow, revenue and profit covers why the three drift apart.
An operations lead weighing stock against demand
An operations lead asks which products are selling fastest against stock on hand. Luca reads Shopify inventory by location and Amazon FBA stock alongside orders. The guide to e-commerce inventory management covers the decisions that follow.
How Luca AI compares for cross-channel e-commerce analytics
Luca answers plain-English questions from one warehouse that holds your store, ad and accounting data together. Its replies can include the Xero or QuickBooks ledger next to Shopify and ad spend, and there is no limit on how many questions you ask. Luca AI is the only platform in this table that does all three.
Cross-channel e-commerce analytics features, from each platform's public documentation:
| Platform | Luca AI | Shopify Sidekick | Triple Whale | Lifetimely | Daasity | Saras Analytics | Northbeam |
|---|---|---|---|---|---|---|---|
| Plain-English questions | Yes | Yes (answers with your store's own data) | Yes (Moby takes plain-English prompts) | Yes (Profit Agent questions in plain words) | Yes (AI Analyst in plain English) | Yes (Saras iQ in natural language) | Partly (through an external AI assistant) |
| Xero or QuickBooks ledger in the same answer | Yes | Not in docs | Not in docs | Partly (QuickBooks costs and expenses) | Not in docs | Partly (Xero integration into Daton) | Not in docs |
| No per-question credits | Yes | Not in docs | Not in docs | Partly (5,000 credits a month) | Not in docs | Not in docs | Not in docs |
Yes: documented and built in. Partly: documented with a limit, shown in brackets. Not in docs: not found in the vendor's public documentation.
Why Luca AI is the stronger choice for cross-channel e-commerce analytics
- Your books sit in the same answer. Luca reads Xero or QuickBooks profit and loss, balance sheet and cash flow next to store and ad data. Lifetimely's QuickBooks integration is described as a way to sync and categorize your cost and expense data. See Lifetimely alternatives compared.
- A reply, not a query draft. Luca returns the figure, a chart and next steps. Triple Whale's SQL guide describes Moby suggesting the right tables, filters, and metrics as a starting point for a query. See Triple Whale alternatives compared.
- Store, ads and ledger in one warehouse. Luca joins Shopify, Meta, Google and Xero inside one private warehouse per brand. Daasity's AI Analyst answers from your governed Daasity metrics, and its documentation names no accounting connector. See Daasity alternatives compared.
- Ask as often as you need. Luca sets no question limit on any plan. Lifetimely says its Profit Agent will pause until your credits reset once a month's allowance is used. Compare the conversational analytics tools for e-commerce.
Competitor details checked against each vendor's public documentation on 29 October 2026. Features and plans change, so confirm with the vendor before you decide.
Limits and things to know
- Daily, not live. Every source refreshes once a day, overnight, so a reply reflects the last refresh rather than this minute.
- Connected sources only. An answer can only draw on the sources you have connected. A question about a channel you haven't connected needs that source first.
- Some sources go through the Luca team. Meta uses guided partner access, and WooCommerce, Magento, Recharge and Klaviyo are set up by the team.
- Some sources are custom builds. Pinterest, Snap and Microsoft Ads, Exact, 3PL and ERP tools are built by Luca's team as custom connectors. Make a custom connector request for any of them.
- Not offered as sources. SMS tools such as Attentive and Postscript are not connectors.
- Scenarios inform, they don't act. Luca runs what-if scenarios and counterfactuals on your joined data, and you make any change yourself.
- Read-only by design. Luca recommends; you make every change in the platform itself.
Common questions
Can Luca combine Shopify, ad and Xero data in one answer?
Yes. Luca can combine ad, sales and accounting data in one answer, because every connected source lands in the same private warehouse for your brand.
Which sources can one question draw on?
Any you have connected: Shopify, Amazon Seller Central, Amazon Ads, Meta, Google Ads, GA4, Search Console, TikTok Ads, Xero, QuickBooks Online, Stripe and European banks through Open Banking, plus WooCommerce, Magento, Recharge, Klaviyo and custom connectors once the Luca team sets them up.
How is this different from an assistant built into one platform?
An assistant inside one platform answers from that platform's data. Luca reads your store, ad accounts, analytics and accounting together, so one reply can cover sales, spend and costs. The list of conversational analytics tools sets out the difference by tool.
Can't I upload a CSV to a general chatbot instead?
You can, but the file is a snapshot you have to rebuild each time. Luca refreshes every source overnight, calculates your KPIs itself and links each figure to its table. Luca's article on why general chatbots struggle with store data goes further.
How do I know where a figure came from?
Each figure in a reply links to the data table it came from. Chat also shows its reasoning steps and sources, so you can check the working before you share the number.
How up to date are the answers?
Every source refreshes automatically once a day, overnight. Answers reflect the last refresh, not live data, so a figure can differ from a platform's own screen during the day.
Does Luca change anything in Shopify, my ad accounts or Xero?
No. Luca reads from each connected system and writes to none of them. It can recommend a change, and you make it yourself in the platform.
What if a question needs a source I haven't connected?
Luca says when it can't see the data needed to answer, rather than guessing. Connect the missing source from Sources, and from the next overnight refresh it joins your answers.
Is there a limit on how many questions I can ask?
No. There is no question limit on any plan, and Luca doesn't use AI credits. Plan details are on the Luca AI pricing page.
Can I ask from Slack?
Yes, on the Leadership plan and above. Someone with permission to add apps to your Slack workspace installs Luca, and Luca replies in Slack with its own answers.
Can I share a joined answer with my board?
Yes. Share the conversation through a private, revocable link that search engines don't index, or download it as a PDF or PowerPoint file.
Why don't my Meta and Google conversions add up to my Shopify sales?
Each ad platform counts the orders it touched within its own attribution window, and none removes orders another platform also claimed. Added together, platform-reported revenue can exceed what your store sold, so store orders are the safer base for profit.
Can I attach my own spreadsheet to a question?
Yes. Upload a PDF, spreadsheet, CSV or document straight into a chat. Luca answers from the file alongside your connected sources, for example checking a supplier's new prices against your store margins.
Can Luca work out MER as well as platform ROAS?
Yes. You can ask Luca about ROAS, MER and CAC. MER compares total revenue with total marketing spend, so it doesn't depend on any one ad platform's attribution model. Luca also shows real, store-based ROAS next to each platform's figure, and POAS after contribution margin.
Updated 29 October 2026: added what a cross-source reply looks like, how cross-channel figures are joined, how to check a joined figure, attaching a file, the 2026 peak dates, the manual method with a worked example, three more questions and further reading. Later the same day, added the joins Luca runs for you, real ROAS and POAS, reconciliation to payouts and the ledger, how each answer shows its working, TikTok Ads, Klaviyo, Recharge and Open Banking as sources, custom connectors, data residency and three more questions.