
ROAS analysis for ecommerce starts with an awkward fact: Meta, Google and Amazon Ads each claim credit for the same sales. Added up, their return on ad spend usually looks better than your bank balance does. Luca AI sets each platform's reported ROAS beside ROAS based on the orders your store actually recorded, adds MER and blended CAC, and breaks it all down by channel and campaign. You then see which spend clears your break-even ROAS and which quietly loses money.
At a glance
| The job | Show which channels and campaigns pay back, against store revenue and your break-even ROAS |
|---|---|
| What Luca calculates | ROAS by platform and campaign, MER, blended CAC, CAC per platform, cost per conversion and break-even ROAS |
| Break-even ROAS | 1 ÷ gross margin by default, so you know the line each campaign has to clear |
| Platform against store | Each platform's own ROAS and conversions beside store-based ROAS and the orders your store recorded, on the Marketing tab |
| Profit view | ROAS against contribution margin (POAS) by channel, with contribution split into CM1, CM2 and CM3 |
| Ad sources | Meta, Google Ads, Amazon Ads and TikTok Ads, plus other ad platforms through a custom connector |
| Alerts | A real ROAS floor and daily spend anomalies, sent to Slack, email or the app |
| Budgets | Budget and annual plan with pacing, reallocation advice and spend scenarios |
| How you ask | In plain English in chat, or on Numbers › Marketing |
| Freshness | Every source refreshes overnight, so each morning shows yesterday's spend and orders |
| What it changes | Nothing. Luca reads your ad accounts and writes to none of them |
Where it fits
What it's for
ROAS analysis for e-commerce answers one question: which ad spend really pays back? Luca works out true ROAS and MER across every channel, against store revenue rather than platform claims. You then judge each channel and campaign against the break-even ROAS your margin allows.
How it helps
- One truth for every channel. Meta, Google and Amazon Ads sit in one table, measured the same way.
- Platform claims, checked. Each platform's ROAS appears beside ROAS based on recorded store orders.
- A line to clear. Break-even ROAS comes from your gross margin, so pass or fail is plain.
- The business view too. MER and blended CAC show whether total spend is working.
- A warning before it costs you. Alerts fire when ROAS drops below your floor or spend jumps.
What happens without it
Without it, budgets follow whichever platform reports the highest ROAS. Every platform counts the same customer, so spend looks better than it is. A campaign can lose money on every sale for months before anyone notices.
Why buyers care
Performance marketers and heads of growth care when they defend a budget, usually at month end or before a peak. Founders care when ad spend grows faster than revenue. Finance leads care when the reported return and the bank balance tell different stories.
The Luca AI approach to ROAS analysis
Take the performance marketing manager at a sports nutrition brand selling protein powders and vitamins. She runs Meta, Google and Amazon Ads. Her finance lead has asked a blunt question before next quarter's budget: which channels actually clear break-even?
The usual answer takes a day of exports. She pulls each platform's ROAS, the Shopify orders and the Amazon settlement report, then lines them up in a spreadsheet. The platform figures rarely agree with the store, and the gap can be large. By the time the sheet is done, the month has moved on.
Nobody is lying here. Each platform measures its own touchpoints with its own window, so each one claims part of the same sale. What she needs is one table that counts each order once and sets every channel against the same margin line.
Luca builds that table from her own data. Luca reads spend and conversions from all three ad platforms and the orders from Shopify and Amazon. It calculates ROAS by platform and campaign, MER, blended CAC and break-even ROAS, which is 1 ÷ gross margin. The Marketing tab sets each platform's own ROAS beside store-based ROAS.
The finance lead can check one thing on the dashboard herself: whether each channel's store-based ROAS sits above or below break-even. How that view stacks up against other tools is covered in How Luca AI compares for ROAS analysis for e-commerce, below.
What a ROAS analysis in Luca shows you
A ROAS analysis in Luca has two parts. The Marketing tab on your Numbers dashboard gives you the standing view, and chat answers the follow-up questions the view raises.
What you see on the Marketing tab
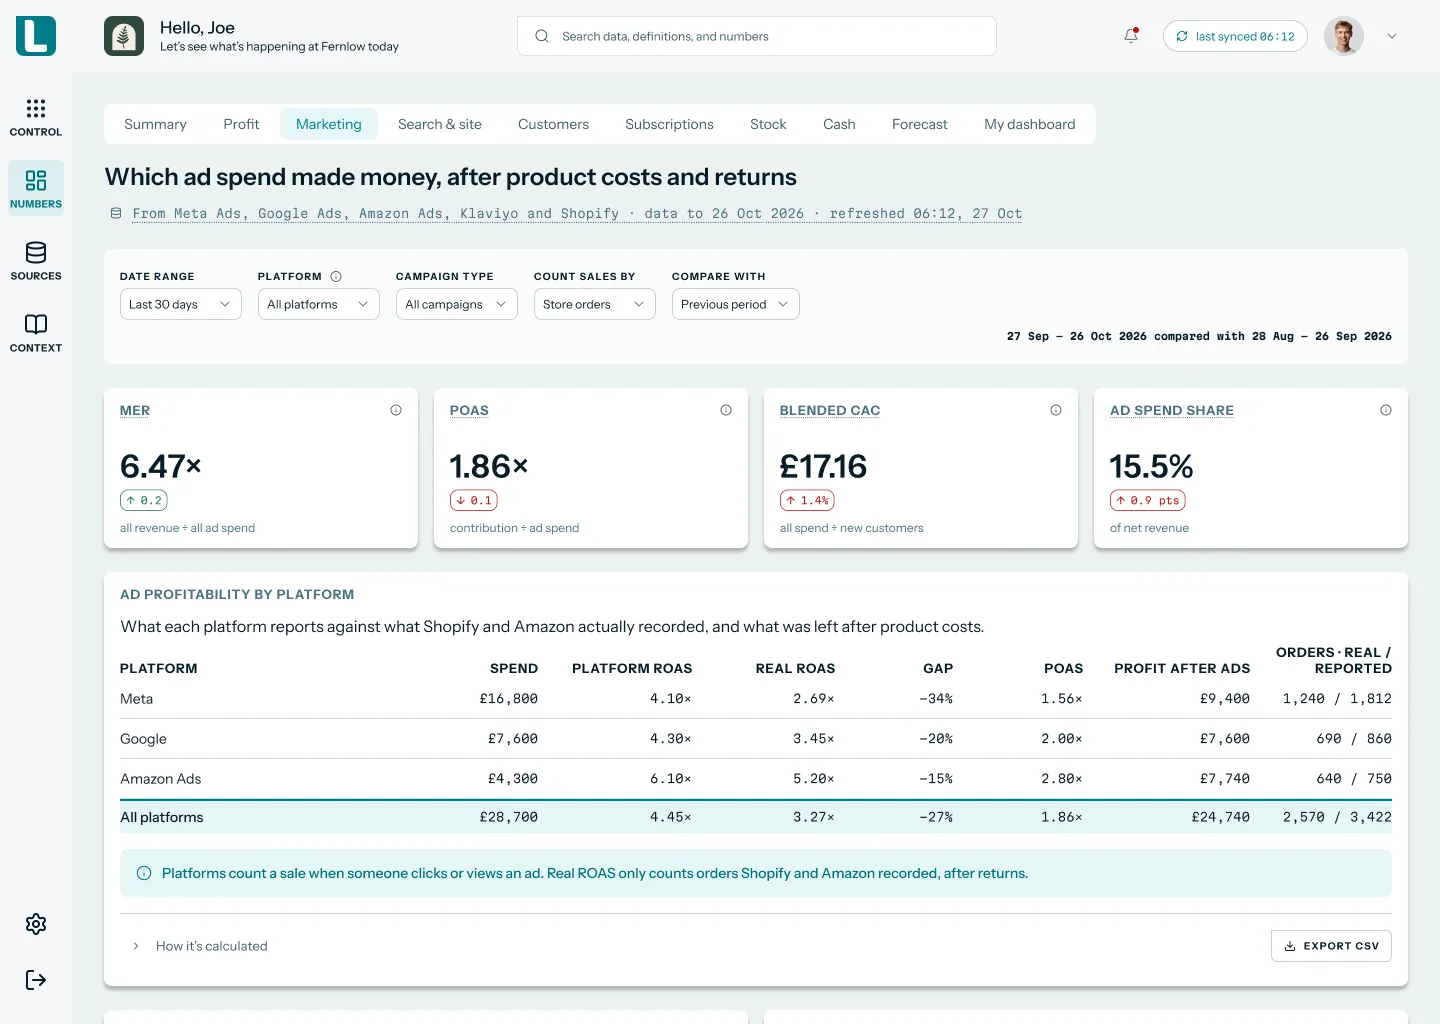
On Numbers › Marketing, the tab is headed Which ad spend made money, after product costs and returns. Headline cards show MER, blended CAC and ad spend as a share of revenue. Below them, a table sets each platform's own ROAS beside store-based ROAS, with the gap between the two.
 Illustrative example · demo brand
The Marketing tab for Fernlow, a demo brand. All figures are sample data; they show how platform ROAS and store-based ROAS sit side by side, with the gap for each channel.
Your Numbers dashboard is built for your brand by the Luca team and refreshed every morning. Luca calls store-based ROAS Real ROAS, and ROAS against contribution margin POAS.
Platform ROAS beside store-based ROAS
Platform ROAS is what Meta, Google or Amazon Ads report about themselves. Store-based ROAS counts only the orders Shopify and Amazon actually recorded, after returns. The gap between them is the size of the over-claim.
Luca also reconciles the conversions each platform reports with the real conversions your store recorded. So you see the over-claim in orders as well as in revenue. Luca joins ad spend from Meta, Google and Amazon with actual store orders and product costs, so each campaign shows whether it makes money, not just revenue. Our article on why platform ROAS drifts from true profit explains where the gap comes from.
MER and blended CAC
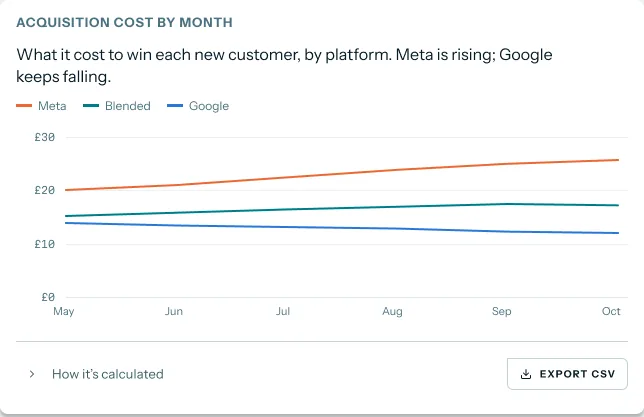
MER is total revenue divided by total ad spend. Blended CAC is total marketing spend divided by new customers, and Luca shows it week by week beside CAC for each platform. Together they tell you whether total spend is working, whatever each platform claims.
 Illustrative example · demo brand
Acquisition cost by month for Fernlow, a demo brand. The lines are sample data; they show why one channel's rising CAC can hide inside a steady blended figure.
CAC payback and LTV to CAC
Luca shows CAC payback, the time a new customer takes to repay what it cost to win them. It adds LTV to CAC, and CAC by channel and by cohort. A channel with cheap first orders can still pay back slowly, and these views show it.
Creative-level performance
Luca shows ad- and creative-level performance from Meta, Google and YouTube. Each live creative is judged on real ROAS, POAS and profit after ads, rather than platform clicks. That lets you cut the one video that loses money while the campaign around it looks fine.
How ROAS, MER and break-even ROAS work
Every ROAS report, from a spreadsheet to an AI analyst, rests on a few simple ratios. Knowing what each one counts helps you judge any number you are shown, including Luca's.
Return on ad spend (ROAS)
ROAS takes revenue attributable to ads and divides it by the cost of those ads. A ROAS of 3x means three pounds of revenue for every pound of ad spend. Luca's default definition is attributed revenue ÷ ad spend, worked out by platform and by campaign.
The hard part is the word "attributable". Single-touch attribution credits one touchpoint, often the last. So the ROAS you see depends on which model and which window the platform uses.
Marketing efficiency ratio (MER)
MER, also called blended ROAS, compares total revenue with total marketing spend. It ignores attribution entirely, which is its strength. Shopify's guide puts the split neatly: ROAS judges specific ads or campaigns, while MER judges total spend. Luca calculates MER as total revenue ÷ total ad spend.
Break-even ROAS
Break-even ROAS is the ROAS at which ad spend pays for itself and nothing more. Luca's default is 1 ÷ gross margin. At a 50% gross margin, break-even ROAS is 2x: every pound of ads must bring in two pounds of sales. Below that line, each sale loses money before you pay for anything else.
Shopify's ROAS guide makes the same point in general terms: a good ROAS depends on profit margins, operating costs and business goals. There is no universal good number, only your own line.
ROAS against contribution margin
Gross margin leaves out fulfilment, payment fees, discounts and returns. Contribution margin takes them off too, so a break-even worked out on contribution margin is stricter. The two ratios measure profitability in different ways, and supplements brands with heavy shipping costs feel the difference. Luca shows this as POAS by channel, using your own cost rules. It splits contribution margin into layers, CM1, CM2 and CM3, so you see which costs eat the return. Our guide to contribution margin against gross margin walks through the layers.
Attribution models and windows
Last-click attribution gives all of the credit to the last-clicked ad. Shopify's guide lists the default windows for Google Ads and Facebook: Google counts actions within 30 days of a click, and Facebook within 24 hours of a view or 28 days of a click. Google and Meta also credit conversions in different ways, which is why their totals overlap.
Multi-touch attribution in Luca
Luca offers multi-touch attribution alongside each platform's own figures. The Luca team helps each brand set up the attribution model that fits its tracking and data. Store-based ROAS and MER stay beside it, so no single model decides the budget on its own.
What Luca is confirmed to do
Luca calculates ROAS by platform and campaign, MER, blended CAC, CAC per platform, cost per conversion and break-even ROAS for every brand with the sources connected. It sets store-based ROAS and reconciled conversions beside each platform's claim, and shows ROAS against contribution margin by channel. Platform figures stay the platforms' own; Luca reads them and sets the store's record beside them.
Run a ROAS analysis by channel and campaign
You can run the analysis two ways: ask in chat, or open the Marketing tab. Most people use both.
- Open Numbers, then Marketing. Read MER and blended CAC first, so you know whether total spend is working.
- Read the platform table. Compare each platform's own ROAS with store-based ROAS, and note the gap.
- Hold each channel against break-even. Any channel whose store-based ROAS sits under break-even ROAS is losing money on each sale.
- Drill into campaigns. Ask in chat which campaigns sit below break-even, platform by platform.
- Check the trend. Ask for blended CAC by week, so one bad week doesn't drive the decision.
- Export what you need. Download an answer's data as CSV or Excel for the budget meeting.
Each answer comes with figures, a chart where useful and next steps, and each figure links to the table it came from. The page on questions that join several sources shows how chat handles them.
Try asking Luca:
"Which Meta, Google and Amazon Ads campaigns had a ROAS below our break-even ROAS last month?"
Break the numbers down by campaign
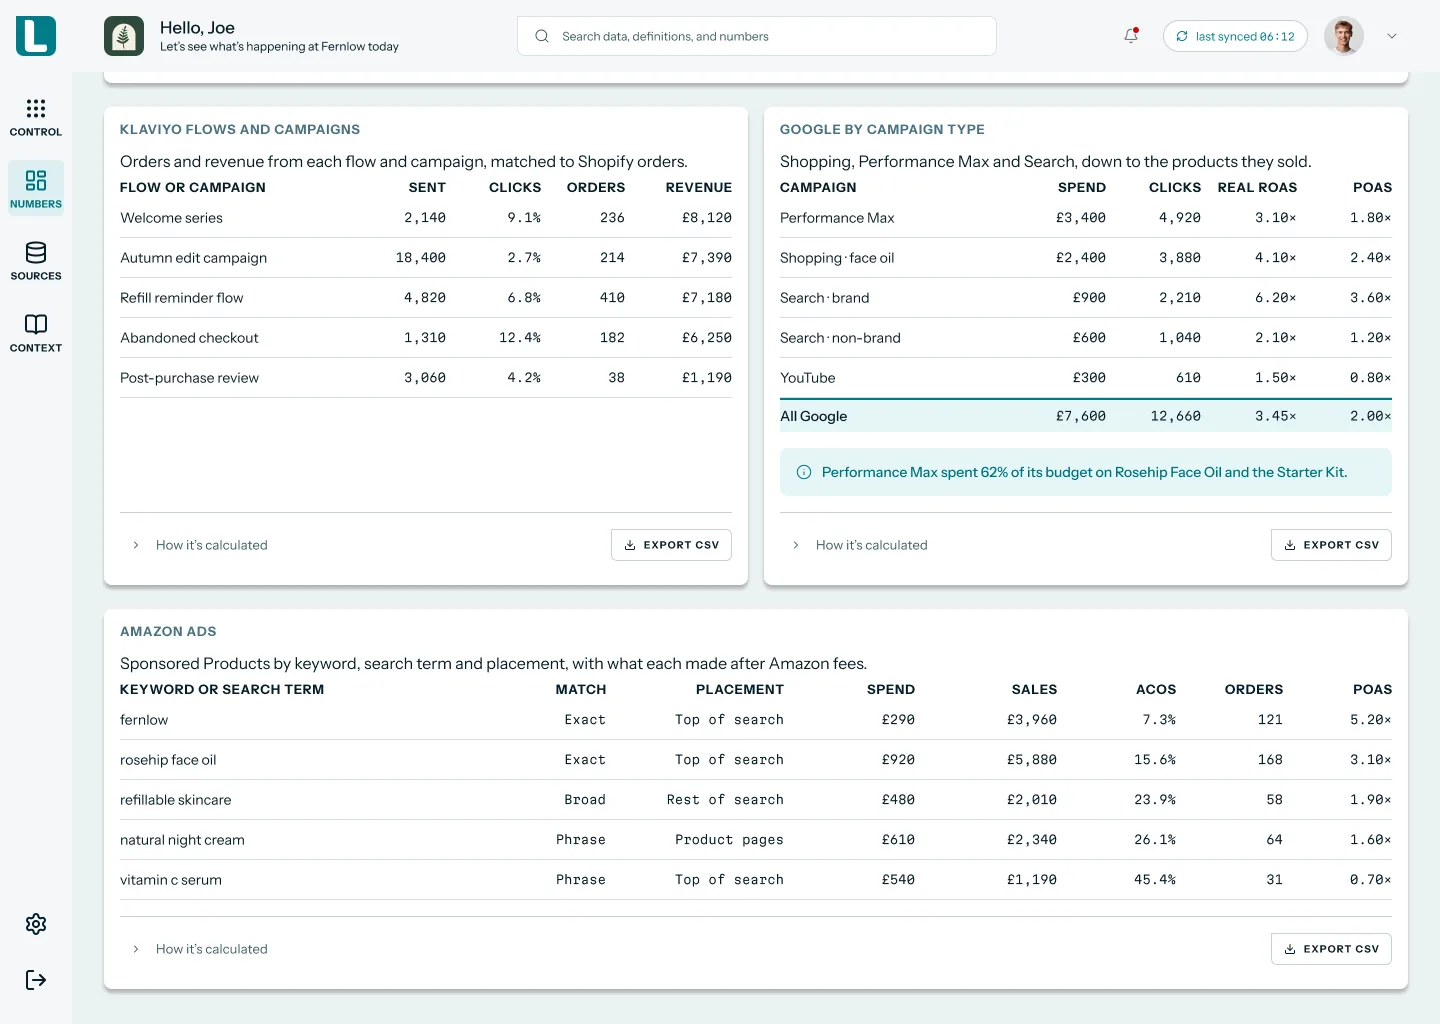
Google Ads data comes in by campaign type, so Performance Max, Shopping, Search and YouTube each get their own ROAS. Shopping and Performance Max go down to the products they sold. Amazon Ads comes in by campaign, keyword, search term and placement. Meta comes in at campaign, ad and creative level.
 Illustrative example · demo brand
Campaign-level cards for Fernlow, a demo brand. The spend, ROAS and ACOS figures are sample data; they show how one channel splits into campaigns with very different returns.
On Amazon, many sellers think in ACOS, which is ad spend ÷ ad sales. ACOS is simply the inverse of ROAS, so an ACOS of 25% is a ROAS of 4x. Our article on ecommerce conversion tracking covers how each platform records a sale.
Q4 2026 and the peak-season context
Black Friday falls on Friday 27 November 2026, and Cyber Monday on Monday 30 November. Peak weeks change ROAS fast, because conversion rates and auction prices both move. Recheck break-even weekly through November rather than monthly.
The peak keeps growing. Over Black Friday Cyber Monday 2025, Shopify merchants sold 14.6 billion US dollars, up 27% on the year. Shopify listed fitness and nutrition among the hottest categories that weekend, which matters to supplements brands. Shopify notes the figures are approximate and unaudited. In the UK, the Office for National Statistics reports online spending up 7.4% on the year in July to September 2026.
Budgets are under scrutiny too. Gartner found marketing budgets were 7.8% of company revenue in 2026, nearly flat on 2025. Flat budgets make every channel's ROAS a harder argument to win.
How to check whether platform ROAS is real
There are four standard checks, and each has a weak spot. Knowing them helps you read any ROAS report.
- Platform-reported ROAS. Easy to get and granular down to the ad. Its weak spot is that each platform counts its own touchpoints, so the platforms together claim more sales than the store made.
- Store-based ROAS. Counts only orders the store recorded, after returns. It is closer to cash, but it still needs a way to link an order to an ad.
- MER. Immune to attribution, because it uses total revenue and total spend. Its weak spot is that it can't tell you which channel to cut.
- Blended CAC. Shows what a new customer costs across all spend. A rising blended CAC is often the first sign that a channel is tiring.
Shopify's attribution guide advises keeping conversion events, attribution windows and UTM parameters consistent within each source. Data-driven models also need volume: Google Ads suggests at least 200 conversions and 2,000 ad interactions in 30 days. Privacy laws such as GDPR require consent before cross-device tracking, so some sales will never be linked to an ad.
Luca's check is to set the platform's claim beside the store's record and show the gap. Daily data-quality audits also compare Luca's data with Shopify, Amazon and QuickBooks, and catch gaps, duplicates and stale tables.
How to work out break-even ROAS by channel
You can do this by hand, and it is worth knowing the steps even if a tool does them for you.
The manual method
- Find your gross margin. Take revenue minus product costs, divided by revenue, from your books.
- Work out break-even ROAS. Divide 1 by gross margin. For a stricter line, divide 1 by contribution margin instead.
- Export spend by channel. Pull the same date range from Meta, Google and Amazon Ads.
- Export store orders. Pull Shopify orders and the Amazon settlement report, net of refunds.
- Match orders to channels. Use UTMs or order tags, and count each order once.
- Work out store-based ROAS. Divide matched revenue by spend for each channel and campaign.
- Compare with break-even. Mark each channel and campaign as above or below the line.
- Check MER. Divide total revenue by total spend, so you see the whole picture too.
The same job in Luca
In Luca, steps 3 to 8 are done for you each night. Luca reads spend from the ad platforms and orders from Shopify and Amazon. It works out ROAS by platform and campaign, MER, blended CAC and break-even ROAS from your gross margin. You read the result on the Marketing tab, or ask in chat, and spend your time on the budget decision.
"What were our MER and blended CAC each week this quarter, and which platform's CAC rose fastest?"
A worked example: which channels clear break-even ROAS
This illustrative calculation follows the manual method for a demo sports nutrition brand. The figures are sample data in pounds sterling, rounded, and are not a Luca output.
The brand has a 55% gross margin, so break-even ROAS is 1 ÷ 0.55 = 1.82x. After fulfilment, payment fees and returns, its contribution margin is 45%. Break-even on contribution margin is 1 ÷ 0.45 = 2.22x.
| Channel | Ad spend (GBP) | Platform-reported revenue (GBP) | Platform ROAS | Store-recorded revenue (GBP) | Store-based ROAS | Contribution after ads (GBP) |
|---|---|---|---|---|---|---|
| Meta | 20,000 | 70,000 | 3.50x | 42,000 | 2.10x | 42,000 × 0.45 − 20,000 = −1,100 |
| Google Ads | 12,000 | 45,600 | 3.80x | 33,600 | 2.80x | 33,600 × 0.45 − 12,000 = 3,120 |
| Amazon Ads | 8,000 | 36,000 | 4.50x | 30,400 | 3.80x | 30,400 × 0.45 − 8,000 = 5,680 |
| All three | 40,000 | 151,600 | 3.79x | 106,000 | 2.65x | 7,700 |
On platform figures, every channel looks comfortable. On store figures, the platforms claimed 151,600 pounds of sales against 106,000 recorded, an over-claim of about 43%. Meta clears gross-margin break-even at 2.10x but fails the stricter 2.22x line. So each pound on Meta loses about five pence before overheads. Amazon fees would lower Amazon's margin in practice, so use your Amazon margin there.
If the brand's total revenue that month was 260,000 pounds, MER is 260,000 ÷ 40,000 = 6.5x. MER looks healthy because it includes returning and organic customers. That is why you need both: MER for the business, store-based ROAS for each channel.
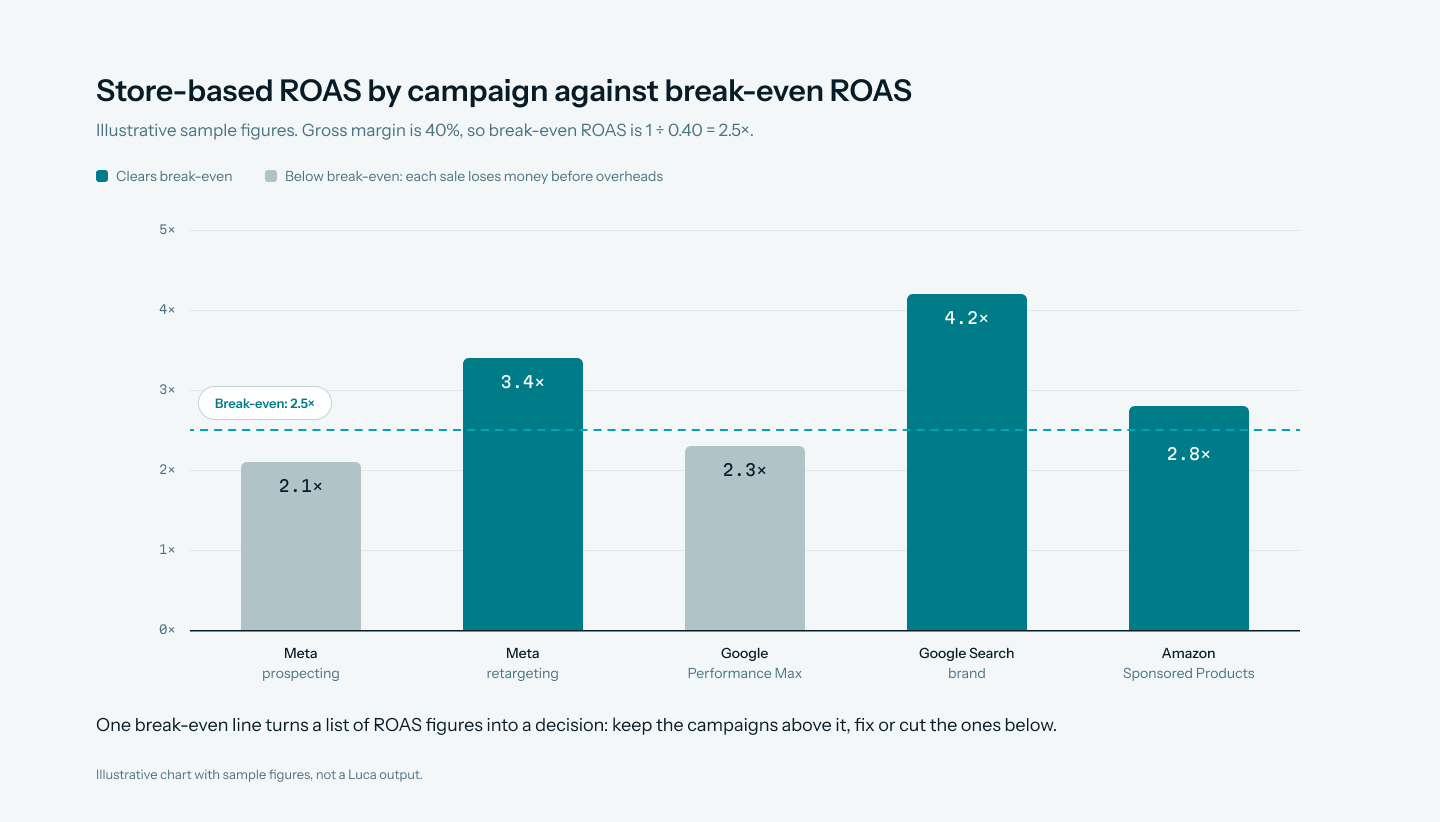
An illustrative chart with sample figures, not a Luca output. It shows how a single break-even line turns a list of campaign ROAS figures into a clear keep, fix or cut decision.
Alerts, budgets and spend scenarios
A ROAS analysis tells you where spend stands today. Luca also watches it between analyses, tracks spend against your budget and tests changes before you make them. Every step is advice: you make each change in the ad platforms yourself.
Alerts when ROAS or spend moves
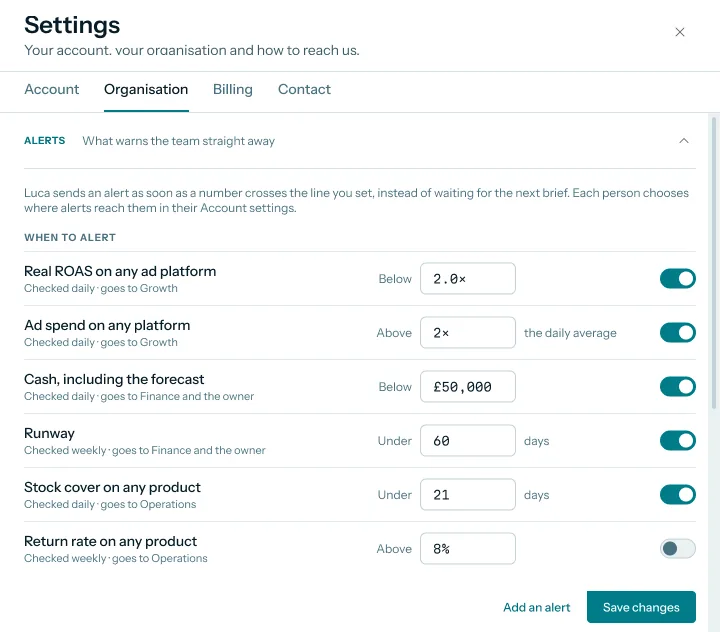
Luca sends threshold alerts, for example when real ROAS on a platform drops below a floor you set. It also sends daily spend anomaly alerts when spend jumps well above its usual level. Anomaly detection uses a stated method: a move of more than two standard deviations, or 2-sigma.
 Illustrative example · demo brand
Alert rules for Fernlow, a demo brand. The floors are sample settings; they show a real ROAS floor and a spend spike rule that warn the growth team between ROAS reviews.
Noise control holds an alert until Luca is confident, removes duplicates and caps how many arrive. Each person chooses where alerts reach them: Slack, email or the app. Set the ROAS floor at or above your break-even ROAS, so an alert means money is being lost.
Budgets and pacing
Luca holds your budget and annual plan and shows pacing against it. Budget against actual tells you each month whether ad spend is running ahead of plan. Goals and pacing to plan run through the forecast and Luca's control centre, so an overspend shows up before month end.
Budget reallocation advice
Luca gives budget reallocation advice: where moving spend between platforms or campaigns would earn more. Each recommendation states its revenue impact and comes with an implementation plan. Each insight is scored for impact and ease, and the strongest arrive in the priority brief, Luca's scheduled email.
Luca keeps a log of decisions and recommendations. After you act, it measures the lift, so you see whether a budget move paid off. Luca never moves the budget itself.
Spend scenarios and counterfactuals
Before you move money, ask Luca what would happen. What-if scenarios test a change such as ad spend up 20%. Spend scenarios follow it through to cash, for example 20% more on Meta and what happens to 90-day cash. You can also ask a counterfactual about any number, such as last month without one campaign.
"If we put 20% more into Meta next month, what happens to our 90-day cash?"
Set up ROAS analysis in Luca
You can set up Luca without a developer, and every connection is read-only by design.
- Connect Shopify. Open Sources and click Connect on the Shopify card. Luca imports your full order history.
- Connect Amazon. Amazon Seller Central and Amazon Ads both connect self-serve.
- Connect Google. Google Ads connects self-serve on the Google card, with GA4 and Search Console.
- Connect Meta. Meta connects by OAuth for some accounts, and through guided partner access with the Luca team for others.
- Connect TikTok Ads. The TikTok card sits in the Marketing group of Sources, beside Meta, Google and Amazon Ads.
- Connect your books. Xero or QuickBooks gives Luca your gross and operating margin.
- Agree your cost rules. During onboarding, the Luca team sets your product, shipping and fee costs, so POAS and contribution views use your numbers.
- Set your alert lines. In Settings, under Organisation and Alerts, set a real ROAS floor and a spend spike rule.
- Open Numbers the next morning. After the overnight refresh, the Marketing tab and chat both have your spend and orders.
Plans and what each includes are on the Luca AI pricing page.
How ROAS analysis works with the rest of Luca
Shopify and Amazon Seller Central
Shopify is the record of what sold, and Amazon Seller Central adds marketplace orders and SKU economics after fees. Store-based ROAS rests on these two records, not on the ad platforms.
TikTok Ads and other ad platforms
TikTok Ads sits beside Meta, Google and Amazon Ads in the Marketing group of Sources, so its spend joins the same ROAS view. For another ad platform, such as Pinterest, Snap or Microsoft Ads, the Luca team builds a custom connector.
Xero and QuickBooks
Your books supply gross margin and operating margin, so break-even ROAS rests on the margin you actually earn. Our guide to ecommerce profit margins shows typical levels by category.
Klaviyo
Klaviyo is set up by the Luca team, read-only. Luca reads the revenue Klaviyo attributes to each campaign and flow. That helps you see how much of a sale came from email rather than ads, a question for customer retention analysis.
Chat and the morning view
ROAS figures feed the same morning overview of the whole business as sales, profit and cash. Any ratio between Luca's figures, such as LTV to CAC, can be asked for directly in chat. Luca keeps a persistent memory across conversations, shared by everyone in your organisation, so next week's follow-up starts where this one ended. It also learns from which insights you act on and which you ignore. Read how Luca works as an AI analyst.
Who runs ROAS analysis, and how
Growth and marketing leads
A performance marketer runs the analysis weekly and before each budget round. The break-even line turns a long list of campaigns into keep, fix or cut. Our guide to AI marketing analytics for ecommerce covers the wider toolset.
Founders and CEOs
A founder reads MER and blended CAC first. If ad spend grows faster than revenue, MER falls, and that is the cue to ask which channel caused it.
CFOs and finance leads
A finance lead uses store-based ROAS to reconcile marketing's numbers with the books. Blended CAC by week feeds the budget, and break-even ROAS ties ad spend to margin. Our list of ecommerce KPIs that decide profitability sets out the rest.
How Luca AI compares for ROAS analysis for e-commerce
Luca calculates ROAS by platform and campaign, MER and break-even ROAS from your own gross margin. It reads your Xero or QuickBooks books in the same place, so margin and ad spend meet. Luca AI is the only platform in this table that does all four.
ROAS analysis features, from each platform's public documentation:
| Platform | Luca AI | Triple Whale | Northbeam | Lifetimely by AMP | Daasity | Shopify Sidekick |
|---|---|---|---|---|---|---|
| ROAS by platform and campaign | Yes | Yes (by channel, campaign, ad set and ad) | Yes (ROAS from attributed revenue) | Yes (ROAS across connected platforms) | Partly (channel and vendor level) | Yes (Performance by marketing channel report) |
| MER beside platform ROAS | Yes | Yes (MER and Blended ROAS) | Yes (Blended MER down to platform ROAS) | Partly (blended across attributed revenue) | Yes (MER in the metric glossary) | Not in docs |
| Break-even ROAS from your gross margin | Yes | Not in docs | Not in docs | Not in docs | Not in docs | Not in docs |
| Xero or QuickBooks in the same place | Yes | Not in docs | Not in docs | Partly (QuickBooks cost and expense sync) | Not in docs | Not in docs |
Yes: documented and built in. Partly: documented with a limit, shown in brackets. Not in docs: not found in the vendor's public documentation.
Why Luca AI is the stronger choice for ROAS analysis for e-commerce
- A break-even line for every channel. Luca works out break-even ROAS as 1 ÷ gross margin and sets each channel against it. Triple Whale's summary metrics answer questions about MER and Blended ROAS, with no break-even ROAS in its docs. See Luca AI and other Triple Whale alternatives.
- Margin and spend in one place. Luca reads your Xero or QuickBooks ledger beside your ad accounts, so break-even rests on the margin you actually earn. Lifetimely's QuickBooks connection syncs and categorises your cost and expense data. See Luca AI and other Lifetimely alternatives.
- Campaign detail, not just channels. Luca works out ROAS by campaign as well as by platform, so you can cut the one campaign that loses money. Daasity's attribution explore rolls up to the channel and vendor level. See Luca AI and other Daasity alternatives.
Competitor details checked against each vendor's public documentation on 29 October 2026. Features and plans change, so confirm with the vendor before you decide.
Limits and things to know
- Advice, not action. Luca recommends budget moves and sends alerts. Pausing a campaign or moving a budget is always your step.
- Your costs drive contribution. Contribution views use the cost rules agreed at onboarding, so they are only as good as those rules.
- Four ad platforms built in. Meta, Google Ads, Amazon Ads and TikTok Ads are covered. Other ad platforms come in through a custom connector the Luca team builds.
- Daily, not live. Sources refresh overnight, so today's spend shows tomorrow.
- Read-only. Luca informs your budget decisions. It never changes a bid, budget or campaign.
Common questions
What is ROAS analysis for ecommerce?
It is the work of checking which ad spend pays back. You compare return on ad spend by channel and campaign with store revenue, and with the break-even ROAS your margin allows.
What is the difference between ROAS and MER?
ROAS measures attributed revenue from one platform or campaign against its spend. MER divides total revenue by total ad spend for the whole business. Use ROAS to pick campaigns and MER to judge total spend.
How do I calculate break-even ROAS?
Divide 1 by your gross margin. At a 50% gross margin, break-even ROAS is 2x. For a stricter line, divide 1 by contribution margin, which also takes off fulfilment, fees and returns.
Why does Meta report a higher ROAS than my store shows?
Each platform counts its own touchpoints and uses its own attribution window. When a customer sees a Meta ad and clicks a Google ad, both may claim the sale. Store-based ROAS counts each recorded order once.
What is a good ROAS for a supplements brand?
There is no single good number. A ROAS is good when it clears your own break-even ROAS, which depends on your margin. High-margin products can live with a lower ROAS than low-margin ones.
Can Luca show ROAS by campaign, not just by platform?
Yes. Luca calculates ROAS by platform and by campaign. Google Ads data is split by campaign type, and Amazon Ads by campaign, keyword, search term and placement. Creative-level performance sits alongside.
Does break-even ROAS use gross margin or contribution margin?
Luca's default is 1 ÷ gross margin. Luca also shows ROAS against contribution margin, or POAS, by channel. It uses your own cost rules for fees and fulfilment.
Which ad platforms does Luca read?
Meta, Google Ads (including YouTube), Amazon Ads and TikTok Ads. Google Ads and Amazon Ads connect self-serve. Meta connects by OAuth for some accounts and through guided partner access for others.
Will Luca change my ad budgets or bids?
No. Every connector is read-only. Luca gives budget reallocation advice and writes to none of your ad accounts, so every budget decision stays with you.
Can Luca alert me when ROAS falls below break-even?
Yes. Set a real ROAS floor, ideally at your break-even ROAS, and Luca alerts you when a platform drops below it. Daily spend anomaly alerts flag sudden jumps in spend.
How often are the ROAS figures updated?
Every source refreshes automatically once a day, overnight. Each morning's figures include yesterday's spend and orders.
Can I see blended CAC alongside ROAS?
Yes. Luca calculates blended CAC, which is total marketing spend divided by new customers, and CAC per platform, week by week. Both sit beside ROAS and MER.
How does ACOS relate to ROAS?
ACOS, used on Amazon, is ad spend divided by ad sales. It is the inverse of ROAS, so an ACOS of 25% equals a ROAS of 4x.
Can I take the numbers into a budget meeting?
Yes. You can download an answer's data as CSV or Excel. Each figure in an answer also links to the table it came from, so finance can trace it.
Updated 29 October 2026: added how ROAS, MER and break-even ROAS work, how to check platform ROAS, the manual method with a worked example, the Q4 2026 peak dates and further reading. Later the same day: added POAS by contribution layer, reconciled conversions, creative-level performance, CAC payback, multi-touch attribution, TikTok Ads, alerts, budgets and pacing, reallocation advice, spend scenarios and memory.