
Ecommerce demand forecasting answers the question every inventory lead faces before peak season: how many units of each product will sell before the next delivery lands? Get it wrong and you either run out in December or pay to store pallets until spring. Luca AI forecasts demand for each product from your Shopify and Amazon sales, allows for seasonality and holidays such as Black Friday, and shows days of stock remaining and likely run-out dates. It then sets stock cover against your supplier lead times and recommends what to reorder.
At a glance
| The job | Forecast units per product so purchase orders land before stock runs out |
|---|---|
| What Luca forecasts | Orders and units per product, with likely run-out dates and days of stock remaining |
| Seasonality | Forecasts allow for seasonality and holidays such as Black Friday |
| How it stays honest | Forecasts are checked against actual sales every night and corrected |
| Stock it reads | Shopify inventory by location, Amazon FBA stock and 3PL, WMS or ERP data, in one inventory view |
| Lead times | Supplier lead times and MOQs held as context, with stock cover set against them |
| Reorders | Reorder points, reorder recommendations and the cash impact of each purchase order |
| Alerts | Stock-out alerts early enough to act, sent to Slack, email or the app |
| Where you see it | In chat, or on Numbers › Stock with stock cover, run-out dates and order-by dates |
| Who switches it on | Luca's team, during set-up. It is not tied to a plan |
| What it never does | Place an order. Luca reads your data and writes to none of your systems |
Where it fits
What it's for
Inventory demand forecasting tells you how much of each product will sell, week by week, so purchase orders land before stock runs out. Luca forecasts demand per product from your own sales history, without a spreadsheet model. Luca sets the result against your supplier lead times and recommends what to reorder, and you decide.
How it helps
- A number per product. Each product gets its own forecast of units and a likely run-out date.
- Peaks built in. Seasonality and holidays such as Black Friday are in the forecast from the start.
- Time to act. Days of stock remaining show which products need ordering before the lead time runs out.
- A forecast that keeps up. It is checked against actual sales every night and corrected.
- Warnings in time. Stock-out alerts arrive while a reorder can still land.
What happens without it
Without a demand forecast, reorders follow last month's sales or a gut feel. Fast sellers run out in the peak, when a reorder can't arrive in time. Slow sellers tie up cash and warehouse space for months.
Why buyers care
Inventory and operations leads feel this most in September and October, when orders for the peak have to go in. Founders care when a stock-out costs a big weekend. Finance leads care when the stock bill lands before the sales do.
The Luca AI approach to inventory demand forecasting
Picture the inventory lead at a pet-food brand that sells on Shopify and through Amazon FBA. It is late October. Her supplier needs five weeks to make and ship dry food, and treats sell three times faster in December. She has to decide this week what to reorder for Christmas.
Her usual method is a spreadsheet. She exports last year's sales from Shopify and Amazon, adds a growth guess and checks stock counts in two places. It can take two days, and it is out of date by the time the supplier replies. Small products with lumpy sales get a guess.
Her real gap is time, not skill. Each bag of kibble and each box of treats already has a sales rhythm in last year's orders. A spreadsheet can't redo that rhythm for every product each morning as new orders arrive.
Luca forecasts orders and units for each product from her Shopify and Amazon history. Luca allows for seasonality and holidays such as Black Friday, and shows days of stock remaining and likely run-out dates. The forecasts are compared with real sales overnight and adjusted. She opens the Stock tab, holds each run-out date up to her supplier's five weeks and raises her orders.
Her finance lead can see the result for herself: run-out dates for every product, drawn from forecast demand rather than last month's pace. How that stacks up against other stock tools is covered in How Luca AI compares for inventory demand forecasting, below.
What a demand forecast in Luca shows you
You can read the forecast two ways. The Stock tab on your Numbers dashboard gives the standing view, and chat answers the questions it raises.
What you see on the Stock tab
On Numbers › Stock, you see stock cover, run-out dates and order-by dates for your products. A unit-demand chart shows sales so far and the forecast for the weeks ahead. A product table sets the next eight weeks' forecast beside the same weeks last year.
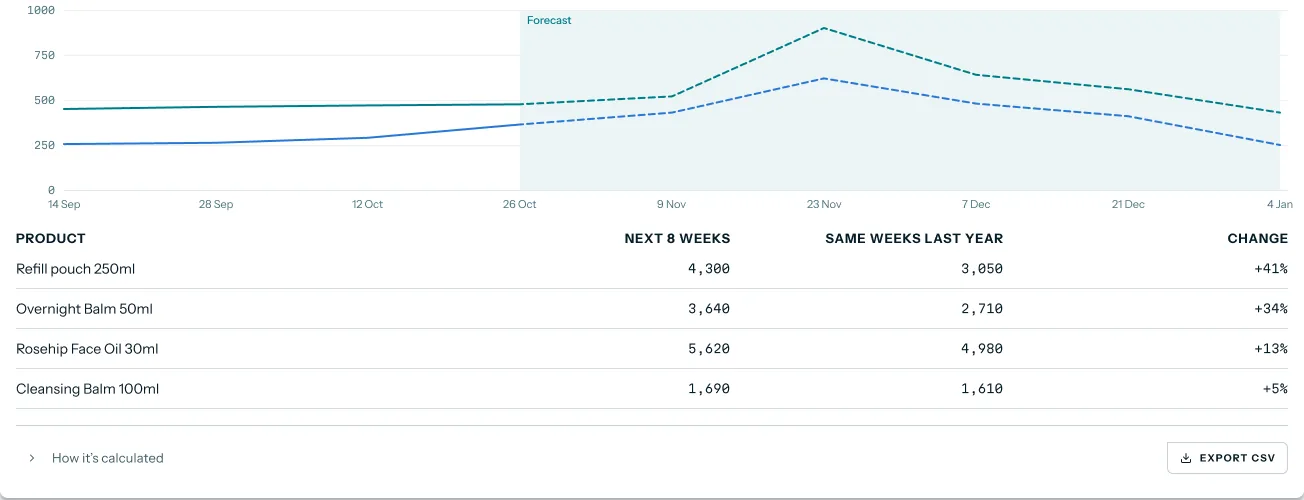 Illustrative example · demo brand
The unit-demand forecast for Fernlow, a demo brand. All figures are sample data; they show how each product's next eight weeks sit beside the same weeks last year.
Your Numbers dashboard is built for your brand by the Luca team and refreshed every morning.
What Luca calculates for stock
For every brand with the sources connected, Luca calculates weeks and days of stock cover, with and without incoming stock. It also tracks stock-out risk, days in stock, the share of the catalogue in stock and aged stock. Luca adds forecasted orders and units per product, and days of stock remaining. It shows slow-moving and aged stock with the cash tied up in it, and it handles bundles and kits.
Try asking Luca:
"Which products are going to run out before Black Friday at the current forecast?"
Where your stock sits
Luca brings Shopify inventory by location, Amazon FBA stock and your 3PL or warehouse data into one inventory view across channels. That matters for an FBA seller: a bag in your own warehouse can't fill an Amazon order until it has been sent in. Luca shows stock by location, so you can plan transfers to Amazon as part of the lead time.
Stock cover against supplier lead times
Luca holds supplier lead times and minimum order quantities (MOQs) as business context. It sets weeks of stock cover against each lead time, with the expected run-out date per product. The Stock tab shows lead time, run-out date and order-by date side by side, and flags the products to order now.
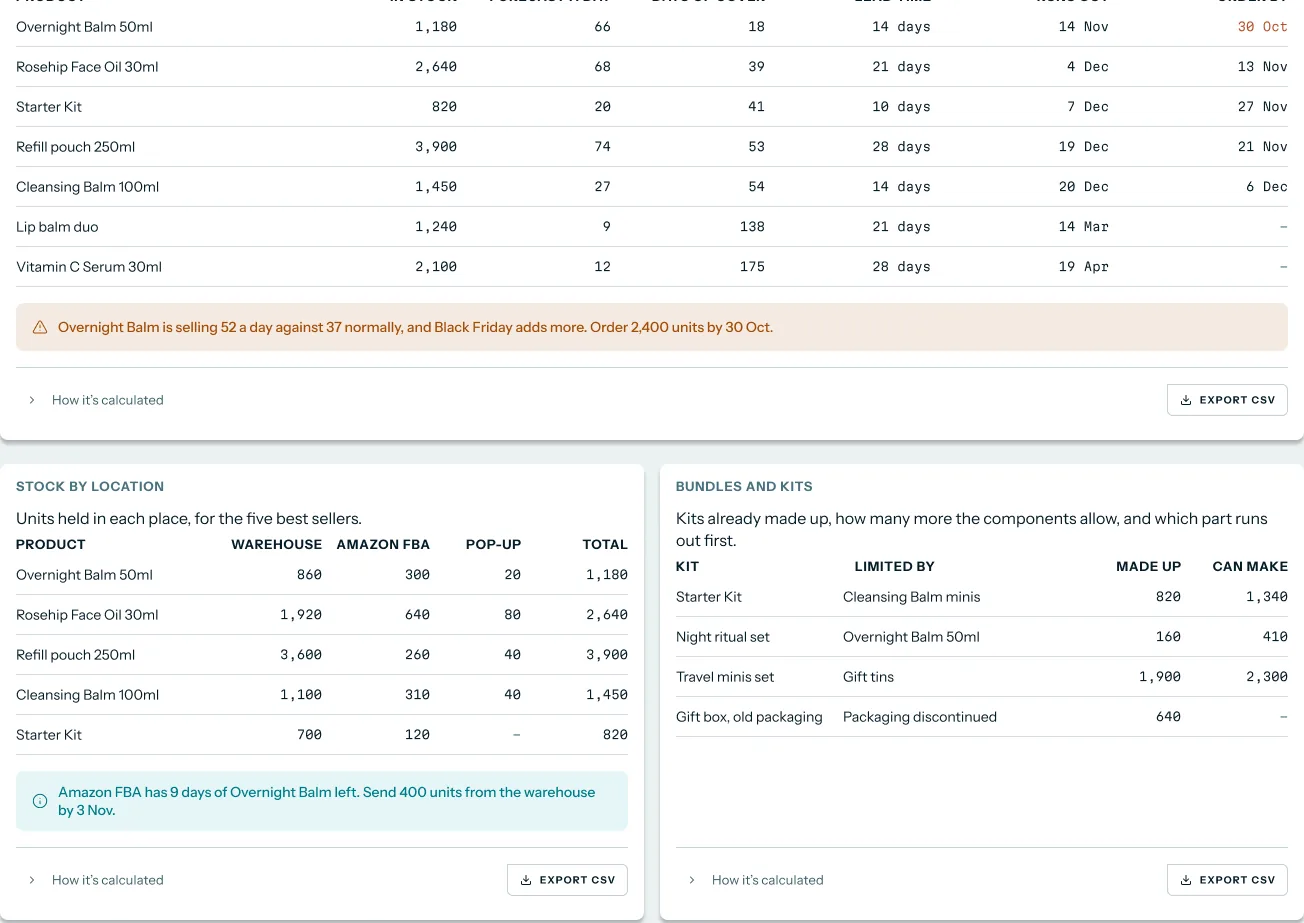 Illustrative example · demo brand
Stock cover and lead times for Fernlow, a demo brand. All figures are sample data; they show how each run-out date sits against its supplier lead time and order-by date.
How ecommerce demand forecasts are built
Every demand forecast, from a spreadsheet to an AI model, uses one of a handful of methods. Knowing them helps you judge any forecast you are shown, including Luca's. Shopify's guide calls inventory forecasting predicting future stock needs from sales history, seasonal trends and market conditions.
Seasonal naive
The simplest method copies last year. A seasonal naive forecast sets each week equal to the same week last year, so next December is forecast as last December. It is crude, but it is the benchmark every other method should beat.
Sales velocity
Many stock tools divide current stock by recent daily sales to get days of cover. It is quick and easy to explain. Its weak spot is that it looks backwards, so it misses a peak that hasn't started yet.
Exponential smoothing
Exponential smoothing averages the past but weights recent weeks more heavily than older ones. Versions of it add a trend and a seasonal pattern. It reacts faster than a plain average and copes well with steady products.
Intermittent demand
Some products sell in lumps: nothing for days, then ten units at once. The M5 forecasting competition included series with sporadic demand including many zeros. The authors note these are typical when forecasting unit sales at a store or product level. Croston's method, a classic answer, forecasts the size of each sale and the gap between sales separately.
Machine learning across products
Machine-learning models learn from many products at once, so a new flavour can borrow from a similar one. The M5 competition asked teams to forecast 42,840 series of Walmart unit sales. Its results carry a warning: only 7.5% of teams beat a simple exponential-smoothing benchmark. A complex method is no guarantee of a better forecast.
What this means for your demand forecast
Whatever the method, a good product forecast learns your seasons from your own history, treats peaks such as Black Friday as known events and is measured against what sold. Luca forecasts orders and units per product with seasonality and holidays allowed for, and checks its forecasts against actual sales every night. Ask the Luca team how much history a product needs before its forecast is reliable.
Plan purchase orders before peak season
Reading the forecast is half the job. The other half is turning it into orders that arrive in time.
- Ask what will run out. Start in chat with the products that run out before your peak at the current forecast.
- Open the Stock tab. Read days of stock remaining, run-out dates and order-by dates for each product.
- Set each against its lead time. If days of stock are fewer than your supplier's lead time, the order is already late.
- Add the Amazon leg. For FBA products, add the time it takes to send stock into Amazon.
- Check the forecast's assumptions. Read the seasonality and promotions behind the forecast before you trust a peak.
- Raise the order in your own system. Luca reads your data and never places an order.
For a deeper look at timing, Luca's guide to seasonal inventory management covers when to buy for each part of the season.
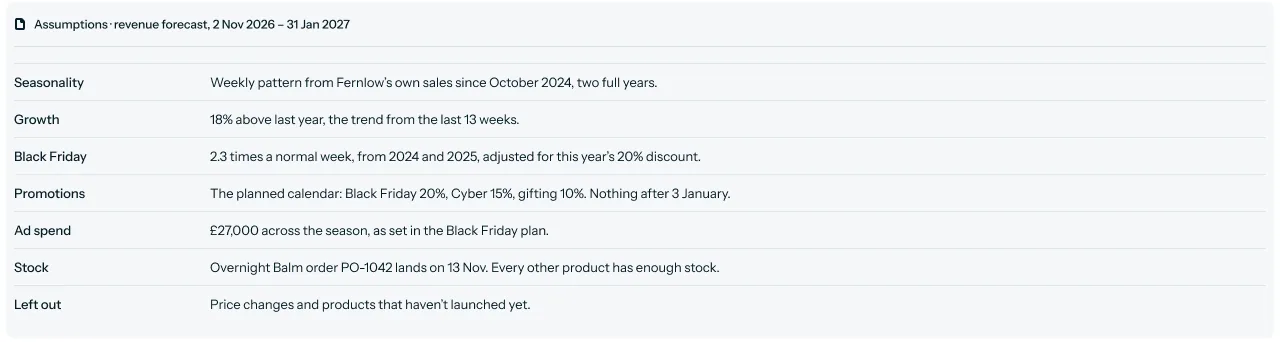 Illustrative example · demo brand
Forecast assumptions for Fernlow, a demo brand. The growth, multiples and dates are sample data; they show the assumptions to check, stock included, before trusting a peak.
"How many days of stock are left on our 12kg adult dry food in Amazon FBA, and in our own warehouse?"
Black Friday and peak season in 2026
Black Friday falls on Friday 27 November 2026, and Cyber Monday on Monday 30 November. Work backwards from those dates: a five-week lead time means peak orders go in by mid October, and FBA transfers need extra days on top.
The peak is large and still growing. Over Black Friday Cyber Monday 2025, Shopify merchants sold 14.6 billion US dollars, up 27% on the year. More than 94,900 merchants had their highest-selling day ever on Shopify that weekend. Shopify notes that the figures are approximate and unaudited. In the UK, the Office for National Statistics reports online spending up 7.4% on the year in July to September 2026.
Reorder recommendations, stock alerts and cash
A forecast is only useful if it turns into the right order at the right time. Luca carries the forecast through to reorders, warnings and cash.
Reorder points and recommendations
Luca sets reorder points per product. When a product nears its line, Luca makes purchase-order and inventory recommendations: how many units to order, and by when. Each recommendation comes with an implementation plan, and seasonality is built into stock planning. You raise the order in your own system, because Luca never places it.
Stock-out alerts
Luca sends stock-out warnings early enough to act, while a reorder can still arrive in time. For Amazon, it also sends alerts on stock and the Buy Box. Each person chooses where alerts reach them: Slack, email or the app.
The cash impact of a purchase order
Stock is cash on a shelf, and a peak order can strain it. Luca shows the cash impact of a purchase order: what it costs, when it has to be paid and when it arrives. It treats inventory as working capital, showing the cash tied up in stock, beside a cash-flow forecast 6 to 12 months ahead.
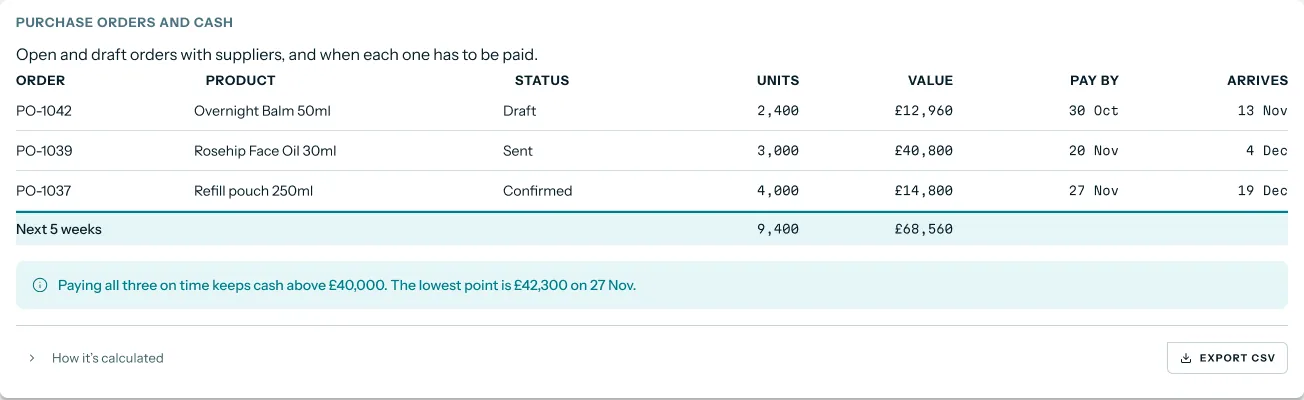 Illustrative example · demo brand
Purchase orders and cash for Fernlow, a demo brand. The orders and amounts are sample data; they show when each order must be paid and what that does to cash.
"Which products should we reorder this week, and what does each purchase order do to our cash before Black Friday?"
How demand forecast accuracy is measured
Forecasters judge accuracy with a few standard measures. For product demand, each has a weak spot worth knowing.
- Mean absolute error (MAE). The average miss in units. It is easy to understand and compute, and it suits one product at a time.
- Mean absolute percentage error (MAPE). The average miss as a percentage. Percentage errors become infinite or undefined on days with no sales, so MAPE misleads on lumpy products.
- Scaled errors. These compare the miss with a simple benchmark's miss, so slow and fast products can be compared. The M5 competition used a variant of the mean absolute scaled error for this reason.
- Bias. Whether the forecast misses high or low on average. For stock, bias matters as much as size, because under-forecasting causes stock-outs.
Accuracy pays. The M5 authors found that small improvements in accuracy lead to considerable inventory reductions in retail. Luca's own check is simpler to state: every night it compares the forecast with what actually sold and corrects it. Forecast accuracy is measured against actuals every night, and the assumptions behind every forecast are visible.
How to forecast demand and set reorder points by hand
You can build a product forecast and reorder points yourself. It is worth knowing the steps even if a tool does the forecast for you. Shopify's guide separates the two jobs: forecasting gives the demand outlook, and replenishment uses that forecast to decide when and how much to reorder.
The manual method
- Export units by product. Download at least a year of units sold per product from Shopify and Amazon.
- Take out the noise. Remove refunds, test orders and days when a product was out of stock.
- Copy last year's season. Take units for the same weeks last year as the base.
- Apply growth. Multiply by the growth you expect for each product, not one rate for all.
- Work out daily demand. Divide the forecast for the period by the number of days in it.
- Work out days of stock. Divide stock on hand by daily demand.
- Set the reorder point. Use daily sales velocity × lead time + safety stock, and reorder when stock falls to it.
- Size safety stock. One common rule is maximum daily usage × maximum lead time, minus average daily usage × average lead time.
Lead time is how long it takes to get inventory from your supplier once you order it. Shopify also warns that the basic safety stock rule works for average scenarios but not for seasonal changes, so recheck it before each peak.
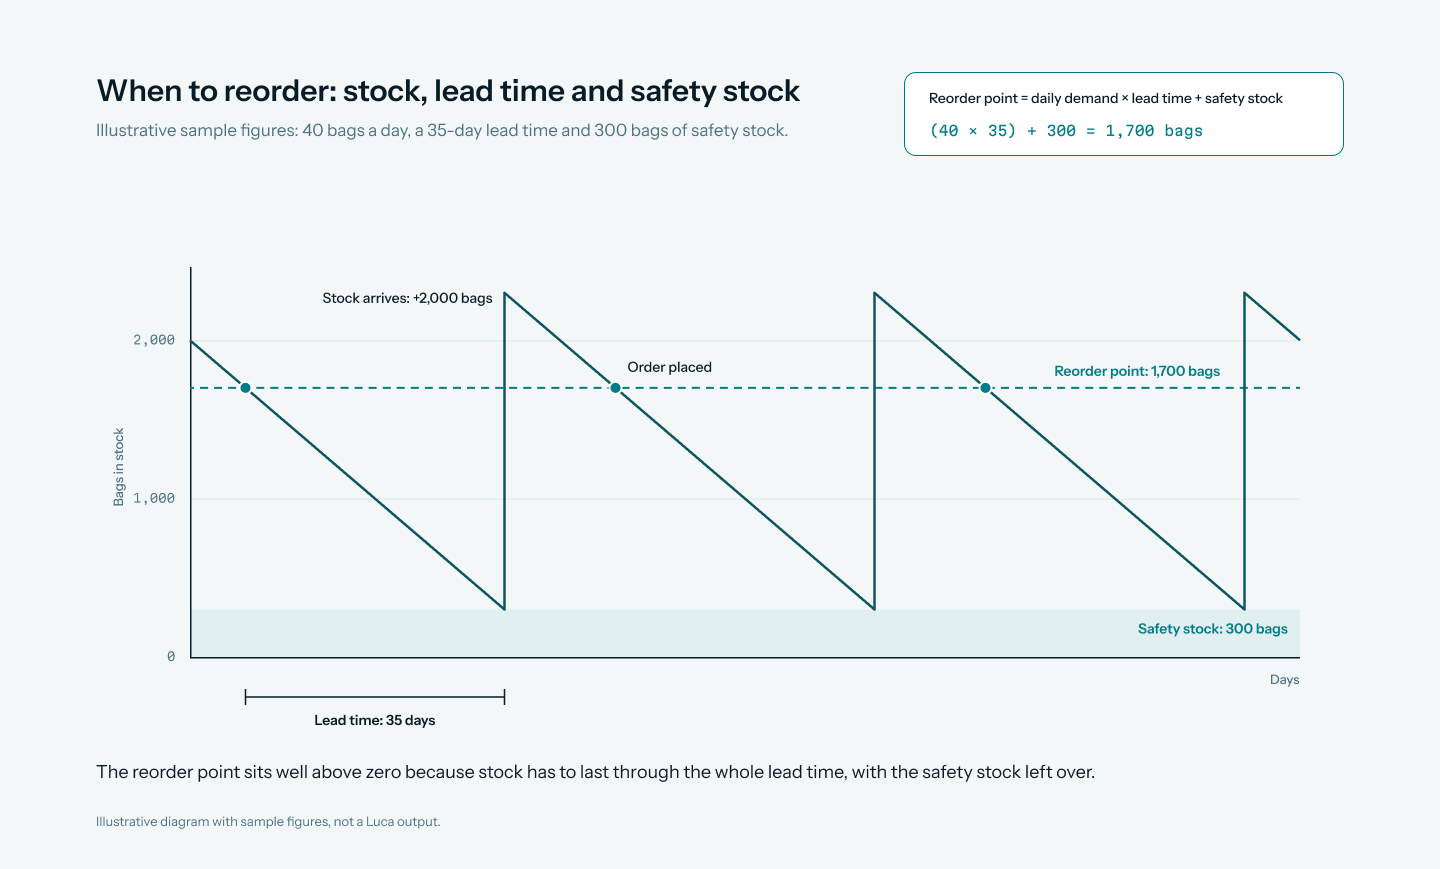
An illustrative diagram with sample figures, not a Luca output. It shows why the reorder point sits well above zero: stock has to last through the whole lead time.
The same job in Luca
In Luca, the forecast and the checking are done for you. Luca forecasts orders and units per product from your Shopify and Amazon history, allows for seasonality and holidays, and works out days of stock remaining. Each night it checks the forecast against what sold and corrects it. It sets the result against your lead times, recommends what to reorder and shows what each order does to cash. You decide, and you place the order.
Luca's forecasts improve as they run. They check themselves against actuals every night, and Luca's analysis improves as it learns your business.
A worked example: what to reorder before Christmas
This illustrative calculation follows the manual method for a demo pet-food brand. The figures are sample data, rounded, and are not a Luca output. The planning window is the 8 weeks, or 56 days, from early November.
| Product | Same 8 weeks last year (units) | Forecast with growth (units) | Daily demand (units) | Stock now (units) | Days of stock | Supplier lead time (days) |
|---|---|---|---|---|---|---|
| Adult dry food 12kg | 2,000 | 2,000 × 1.15 = 2,300 | 2,300 ÷ 56 = 41 | 1,200 | 1,200 ÷ 41 = 29 | 35 |
| Puppy dry food 2kg | 1,400 | 1,400 × 1.10 = 1,540 | 1,540 ÷ 56 = 27.5 | 2,100 | 2,100 ÷ 27.5 = 76 | 35 |
| Dog treats 300g | 4,000 | 4,000 × 1.20 = 4,800 | 4,800 ÷ 56 = 86 | 2,500 | 2,500 ÷ 86 = 29 | 21 |
The adult dry food has 29 days of stock against a 35-day lead time, so it is already six days late. Its reorder point is 41 × 35 + 300 safety stock = 1,735 units, well above the 1,200 on hand. The treats have 8 days of slack before their order is late. The puppy food can wait, with 41 days of slack.
The lesson is that the fastest-selling product is not always the urgent one. Treats sell twice as fast as adult food, but the adult food's longer lead time makes it the first order to place.
Get forecasting switched on
Luca's team switches forecasting on for your brand during set-up, and it is not gated by plan. Ask your Luca contact, or get in touch with the team, to get started.
- Connect Shopify. Open Sources and click Connect. Luca imports your full Shopify history and reads inventory by location. The set-up guide walks through it.
- Connect Amazon Seller Central. It connects self-serve, per region, with up to two years of history and your FBA stock.
- Share your lead times. Agree supplier lead times and MOQs with the Luca team as business context, or upload a lead-time spreadsheet to the knowledge base.
- Connect your stock system. For a 3PL, WMS or ERP, the Luca team builds the connector.
- Connect your books. Xero or QuickBooks adds purchase orders and the cash-flow forecast.
- Choose where alerts go. Pick Slack, email or the app for stock-out alerts.
- Start forecasting. Your Luca contact switches it on, and forecasts then run daily.
Every connection is read-only by design. Plans and what each includes are on the Luca AI pricing page.
How demand forecasting works with the rest of Luca
Shopify
Shopify is the record of what sold. Luca reads orders, refunds, products and variants, and inventory by location and transfers. Shopify data enables stock cover, stock-out risk and the weekly product-demand forecast.
Amazon Seller Central
Amazon Seller Central brings marketplace orders, fees and FBA stock, with up to two years of history. For a brand selling through FBA, it is the other half of the demand picture.
The revenue forecast
Demand and revenue forecasts come from the same forecasting work. The daily revenue forecast up to a year ahead gives the top line, and the product forecast tells you which units make it up.
Xero, QuickBooks and cash
Stock is cash on a shelf. With Xero or QuickBooks connected, Luca reads purchase orders and bills, and adds a cash-flow forecast 6 to 12 months ahead. Our piece on cash flow forecasting for e-commerce explains why stock buys strain cash before peak.
Chat
Chat answers questions that join Shopify, Amazon and your books in one reply. You can also ask "what if" questions in chat, where Luca reasons from your brand's data. Scenario planning shows its stated assumptions, and you can ask a counterfactual about any number. Read how Luca works as an AI analyst.
Who uses demand forecasting, and how
Operations and inventory leads
An inventory lead reads days of stock remaining every week and sets them against lead times before each order cycle. Our guide to ecommerce inventory management covers stock-outs and overstock in more depth.
Founders and CEOs
A founder checks which hero products will run out before the peak. There is no point scaling ads on a product that won't be in stock, which is where ROAS analysis by channel and the demand forecast meet.
CFOs and finance leads
A finance lead uses the forecast to size the stock bill and time it against cash. The demand forecast says what to buy, and the books say when it can be paid for.
How Luca AI compares for inventory demand forecasting
Luca forecasts units for each product with seasonality and holidays allowed for, and works out days of stock from that forecast rather than from past sales alone. It then checks the forecast against actual sales every night and corrects it. Luca AI is the only platform in this table that does all four.
Inventory demand forecasting features, from each platform's public documentation:
| Platform | Luca AI | Shopify Sidekick | Lifetimely by AMP | Triple Whale | Daasity |
|---|---|---|---|---|---|
| Unit demand forecast per product | Yes | Partly (on request, with code) | Not in docs | Not in docs | Partly (you input projected units) |
| Seasonality and holidays in the forecast | Yes | Not in docs | Not applied (no seasonality matching) | Not in docs | Partly (you plan daily around events) |
| Days of stock from forecast demand | Yes | Partly (from units sold per day) | Partly (from 7 or 30 day sales velocity) | Partly (Days of Stock on the Summary page) | Partly (weeks of cover you calculate) |
| Checked against actuals every night | Yes | Not in docs | Not in docs | Not in docs | Partly (daily plan against actual) |
Yes: documented and built in. Partly: documented with a limit, shown in brackets. Not in docs: not found in the vendor's public documentation.
Why Luca AI is the stronger choice for inventory demand forecasting
- Days of stock that see the peak coming. Luca works out days of stock remaining from forecast demand, with seasonality allowed for. Lifetimely's days of stock left is current inventory divided by sales velocity, so it looks backwards. See Luca AI and other Lifetimely alternatives.
- A forecast built for you. Luca forecasts units per product from your own history. In Daasity, you input projected sales, orders and units in a plan and compare actuals against it. See Luca AI and other Daasity alternatives.
- A forecast that checks itself. Luca compares each forecast with actual sales every night and corrects it. Triple Whale shows Days of Stock on its Summary page, with no nightly forecast check in its docs. See Luca AI and other Triple Whale alternatives.
Competitor details checked against each vendor's public documentation on 29 October 2026. Features and plans change, so confirm with the vendor before you decide.
Limits and things to know
- History matters. A forecast learns from your order history, so connect Shopify and Amazon before you rely on it.
- Lead times come from your suppliers. Luca uses the lead times and MOQs you share, so keep them current before each order cycle.
- Transfers are yours to plan. Luca shows stock by location and flags when Amazon FBA runs low, and you send the stock in.
- Custom connectors for stock systems. 3PL, WMS and ERP data come in through a connector the Luca team builds for your system.
- Read-only. Luca never raises, edits or sends a purchase order. Every order stays with you.
Common questions
What is ecommerce demand forecasting?
It is estimating how many units of each product will sell over the coming weeks, from your sales history. Inventory teams use it to time and size purchase orders so stock arrives before it runs out.
How is demand forecasting different from a revenue forecast?
A revenue forecast counts money for the whole brand. A demand forecast counts units for each product, which is what you need to place purchase orders.
Does Luca forecast demand for each product?
Yes. Luca forecasts orders and units per product, with likely run-out dates and days of stock remaining.
Does the forecast allow for Black Friday and Christmas?
Yes. Forecasts account for seasonality and holidays such as Black Friday, so the peak is in the numbers from the start.
How is the demand forecast checked?
Every night, Luca compares its forecasts with your actual sales and corrects them. Daily data-quality audits also compare Luca's data with Shopify, Amazon and QuickBooks to catch gaps and duplicates.
Does it include my Amazon FBA stock?
Yes. Amazon Seller Central brings in FBA stock alongside marketplace orders and fees. Luca puts it in one inventory view with your Shopify locations, and shows stock by location.
Does Luca know my supplier lead times?
Yes, once you share them. Luca holds supplier lead times and MOQs as business context, agreed with the Luca team or uploaded as a spreadsheet. It then sets stock cover against each lead time.
Will Luca place purchase orders for me?
No. Luca recommends what to reorder and shows each order's cash impact, but it writes to none of your systems. You raise every purchase order in your own tools.
How do I get demand forecasting switched on?
Luca's team switches forecasting on during set-up. Ask your Luca contact, and connect Shopify and Amazon first so the forecast has your order history.
Is demand forecasting tied to a plan?
No. Forecasting is not gated by plan. Luca's team switches it on during set-up instead.
Will Luca warn me before a product runs out?
Yes. Luca sends stock-out alerts early enough to act, plus Amazon alerts on stock and the Buy Box. Alerts reach Slack, email or the app.
What is a reorder point?
It is the stock level at which you reorder. A common formula is daily sales × lead time, plus safety stock, so the new delivery lands before the shelf is empty.
How accurate is product-level demand forecasting?
It depends on how steady each product sells. Fast, steady products forecast well. Slow, lumpy products are harder, because a single big order moves the numbers. Judge any forecast by how it compares with actual sales over time.
Can I ask what would happen if a delivery is late?
Yes, in chat. Luca reasons through "what if" questions from your brand's data, such as how many days of stock a late delivery would leave. Scenario planning shows its stated assumptions.
Updated 29 October 2026: added how ecommerce demand forecasts are built, how forecast accuracy is measured, the manual reorder method with a worked example, the 2026 peak dates and further reading. Later the same day: added stock cover against supplier lead times, one inventory view, reorder points and recommendations, stock-out alerts, the cash impact of purchase orders and 3PL, WMS and ERP data.