
Revenue forecasting is the first job when a Shopify brand sets its targets for the year: you need a number for every day, Black Friday included. Luca AI builds that Shopify revenue forecast for you, daily and up to a year ahead, from your store's order history. It allows for seasonality and holidays, and it checks itself against your actual sales every night. Forecasting is switched on per client by Luca's team.
At a glance
| What it is | A daily revenue forecast for your brand, up to a year ahead |
|---|---|
| What it's built from | Your Shopify order history, with seasonality and holidays such as Black Friday allowed for |
| How it's checked | Against your actual sales every night, then corrected |
| Where you see it | In chat, or on Numbers › Forecast in the Revenue Forecast card |
| What you can read | Actual revenue, the same weeks last year and the forecast, plus the assumptions behind it |
| Scenarios | What-if scenarios such as "ad spend +20%", spend scenarios that follow the change through to 90-day cash, and a counterfactual on any number |
| Plan and pacing | A budget and annual plan, with pacing against plan and budget against actual |
| Accuracy | Measured against actual sales every night and shown month by month |
| Related forecasts | Cash flow 13 weeks and 12 months ahead, demand and stock by SKU, and MRR for subscription brands |
| Who switches it on | Luca's team, per client. It is not tied to a plan |
| What it never does | Change your store. Luca only reads your data |
What the revenue forecast is
The revenue forecast is Luca's estimate of what your brand will sell each day, up to a year ahead. It is part of Luca's forecasting work, which also covers product demand with likely run-out dates and, for brands on Xero or QuickBooks, free cash flow. Forecasts run on a daily schedule and draw on the same private warehouse as every other answer Luca gives you.
Around the forecast sit the tools you need to plan with it. You can run what-if and spend scenarios, ask a counterfactual about any number, set a budget and track pacing against plan, and see how accurate past forecasts were.
The same forecasting work covers more than revenue. Luca forecasts cash flow week by week for 13 weeks and then for the next 12 months, and it works out your cash runway from that forecast and your burn. It forecasts demand and stock by SKU, with seasonality built into stock planning. Subscription brands also get MRR and a subscription revenue forecast. Every forecast shows the assumptions behind it.
The forecast starts from your store. Luca imports your full Shopify history, and that history is what lets it see your seasons: the slow weeks, the gift season and the Black Friday spike. Every source refreshes once a day, overnight, so each morning's forecast sits on yesterday's sales.
What you see on the Forecast tab
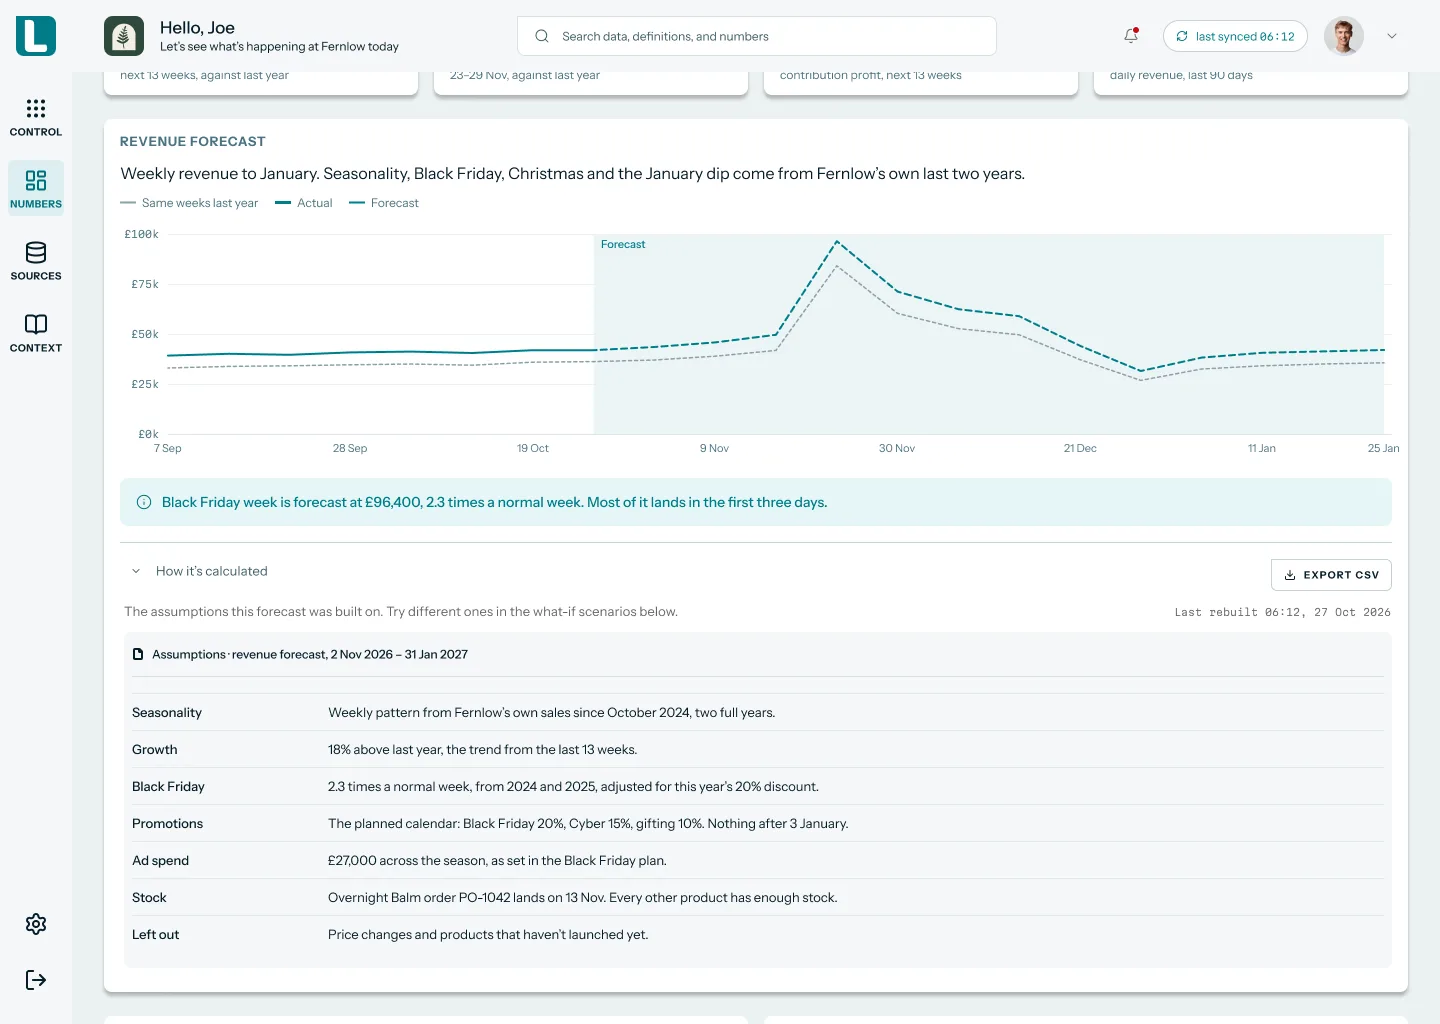
On Numbers › Forecast, the Revenue Forecast card shows a weekly chart with three lines of sight: your actual revenue, the same weeks last year, and a shaded forecast. Expand How it's calculated to see the assumptions the forecast rests on, such as seasonality, growth, promotions, ad spend and stock. Your Numbers dashboard is built for your brand by Luca's team and refreshed every morning.
 Illustrative example · demo brand
The Revenue Forecast card for Fernlow, a demo brand. All figures are sample data, shown to explain what each line on the chart means.
What it is not
The forecast is not a plan you type in. Luca works it out from your data and corrects it as sales come in. Your plan sits beside it instead: you set a budget and annual plan, and Luca tracks pacing against it. The forecast is also not a tool that acts on your store. Luca only ever reads from the systems you connect and writes to none of them.
Why revenue forecasting matters
What it's for
Revenue forecasting tells you what the year is likely to bring before you commit to it. A daily view up to a year ahead lets you set targets, plan stock and pace spend. It also shows how the forecast is checked against actuals, so you know how far to trust it.
How it helps
- Targets with a base. You start the year from a daily forecast, not a guess.
- Peaks you can see. Seasonality and holidays such as Black Friday are in the numbers.
- A forecast that stays honest. It is compared with actual sales every night and corrected.
- Scenarios before you commit. You can test a change in spend or price and see where revenue and cash would land.
- One source of truth. The same warehouse feeds your forecast, your dashboard and your chat answers.
What happens without it
Without a forecast, every target is a hope. You find out a month has fallen short only once it has passed. Stock and ad budgets get set for a year you have not modelled, and the big peaks catch you short or overstocked.
Why buyers care
Founders and growth leads care most in the weeks before they set the year's targets. Finance leads care when the board asks how solid the number is. Operations leads care before peak season, when an order placed late cannot be fixed.
The Luca AI approach to revenue forecasting
Picture a head of growth at a Shopify skincare brand in early autumn. She owes the founder next year's revenue targets by Friday. She also has to decide how hard to push Black Friday, and that call shapes stock and ad budgets for the whole quarter.
The usual route is a spreadsheet. She exports last year's orders, adds a growth rate and bumps November by a guess. It can take a day or two, and the result tends to go stale the week it is shared. Nobody checks it against real sales until the quarter is over.
The problem is not effort. Last year's sales already hold the pattern she needs, week by week. What is missing is a model that reads that pattern every day and owns up when it drifts.
Luca reads the brand's full Shopify history and forecasts daily revenue up to a year ahead. Luca allows for seasonality and holidays such as Black Friday, so the spike is in the forecast from the start. Each night, Luca checks the forecast against what actually sold and corrects it. The head of growth opens the Revenue Forecast card, reads the assumptions, and takes a number to the founder that she can defend.
One fact on this page is easy to test against other tools: whether a forecast is checked against actual sales every night. That point is covered in How Luca AI compares for revenue forecasting, below.
How revenue forecasts are built
Every sales forecasting tool, from a spreadsheet to an AI analyst, uses one of a handful of method families. Knowing them helps you judge any forecast you are shown, including Luca's. The descriptions below follow the free textbook Forecasting: Principles and Practice by Rob Hyndman and George Athanasopoulos, the standard reference for revenue forecasting models.
Naive and seasonal naive
The simplest ecommerce forecasting method copies the past. A seasonal naive forecast sets each future period equal to the same period last year, so next November is forecast as last November. It is crude, but it is the benchmark every better method has to beat.
Moving averages
A moving average takes the mean of the last few weeks or months. Averaging smooths out random noise and leaves the underlying trend. It reacts slowly, so on its own it misses sharp peaks such as Black Friday.
Exponential smoothing
Exponential smoothing also averages the past, but it gives recent weeks more weight than older ones. Versions of it add a trend and a seasonal pattern. Together with ARIMA, it is one of the two most widely used approaches to time series forecasting.
ARIMA
ARIMA models take a different angle. Rather than describing trend and seasonality directly, they describe how each value relates to the values before it. They suit steady series and need more care when a brand's sales jump around promotions.
Seasonality and holiday models
Some models add holidays as separate effects on top of the trend. Prophet, an open-source forecasting tool, is an additive model with yearly, weekly and daily seasonality plus holiday effects. Its documentation says it works best with strong seasonality and several seasons of history, which is the shape of most ecommerce revenue.
Machine learning
Machine-learning models learn patterns across many products and stores at once. The largest public test of retail forecasting, the M5 competition, asked teams to forecast 42,840 series of Walmart unit sales. Most of the leading entries used LightGBM, a gradient-boosted tree model. The same results carry a warning too: only 7.5% of teams beat a simple exponential-smoothing benchmark. A complex method is no guarantee of a better forecast, which is why checking a forecast against actual sales matters more than the method's name.
What this means for your Shopify revenue forecast
Whatever the method, a good Shopify revenue forecast does three things. It learns your seasons from your own history, it treats peaks such as Black Friday as known events, and it is measured against what actually sold. Luca's forecast is built from your full Shopify order history, runs daily up to a year ahead, allows for seasonality and holidays, and is checked against your actual sales every night.
History matters as much as method. Seasonal models need to see each season more than once, so two or more years of orders is a sensible base, and Luca imports your full Shopify history. Ask the Luca team how much history your brand needs before forecasting is switched on.
Read your revenue forecast
You can reach the forecast two ways. Ask in chat, or open the Forecast tab on your dashboard.
- Ask in chat. Type a plain question, for example "What's going to run out before Black Friday?" Luca answers from your brand's data, the same way it handles any plain-English question about your store.
- Or open the Forecast tab. Go to Numbers, then Forecast.
- Read the Revenue Forecast card. The weekly chart shows actual revenue, the same weeks last year and the shaded forecast.
- Expand How it's calculated. Check the assumptions: seasonality, growth, promotions, ad spend and stock.
- Check stock against the forecast. Open the Stock tab to see stock cover, run-out dates and order-by dates.
Set targets for the year
Read the forecast month by month and use it as the floor for your targets. Where you plan to grow faster than the forecast, write down why: a new channel, a launch, a bigger ad budget. Our guide to e-commerce growth strategy covers the levers. Then ask Luca in chat what that gap would take, and it will reason from your own numbers. Plan stock and cash to the forecast, and keep the stretch target above it with its reason written down, because the gap between the two is what your plan has to close.
Once the targets are agreed, put them into Luca as your budget and annual plan. Luca tracks pacing against that plan through the year and shows budget against actual, month by month. Goals sit in the control centre, where Luca turns its findings into the tasks that move them.
Plan for Black Friday
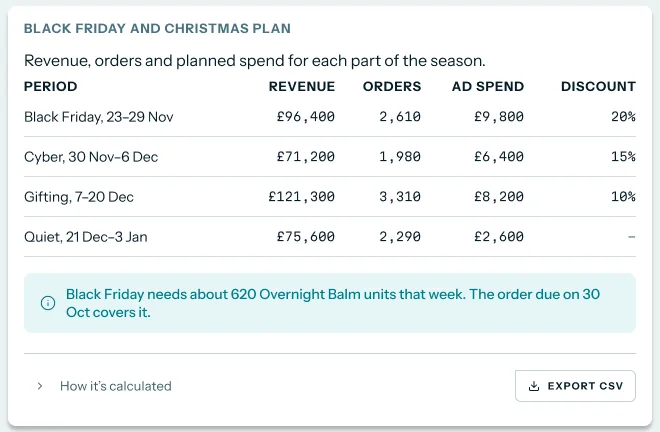
Black Friday is already in the forecast, because forecasts account for seasonality and holidays. Use the forecast for that week to size stock and ad spend, then check the Stock tab for order-by dates. Our piece on seasonal inventory management walks through the timing.
 Illustrative example · demo brand
A Black Friday and Christmas plan for Fernlow, a demo brand. The revenue, orders and ad spend are sample data that show how the season breaks into periods.
Try asking Luca:
"How much revenue is forecast for Black Friday week, and which products sold most in the same week last year?"
Black Friday and peak season in 2026
Black Friday falls on Friday 27 November 2026, after Thanksgiving on Thursday 26 November. Cyber Monday is Monday 30 November 2026. Build your forecast weeks around those dates, and remember that the gifting fortnight in December often carries as much revenue as the weekend itself.
The peak keeps growing. Over Black Friday Cyber Monday 2025, Shopify merchants sold 14.6 billion US dollars, up 27% on the year, and sales peaked at 5.1 million US dollars a minute on Black Friday. Shopify notes that the figures are approximate and unaudited. For UK brands, the latest Office for National Statistics release shows online spending up 7.4% on the year in the July to September 2026 quarter, even though total retail volumes fell 0.4% in September 2026.
Test what-if scenarios and counterfactuals
A forecast tells you where the year is heading if nothing changes. Scenarios tell you what happens if something does. Luca runs both kinds of question on the same data as the forecast, and every scenario states the assumptions it rests on.
What-if and spend scenarios
A what-if scenario changes one input and follows it through the forecast. For example, you can ask what happens if ad spend goes up 20%. A spend scenario goes one step further and follows the change into cash, so "+20% on Meta" comes back with what it does to your cash 90 days out. That matters because extra ad spend is paid out before the sales it brings in.
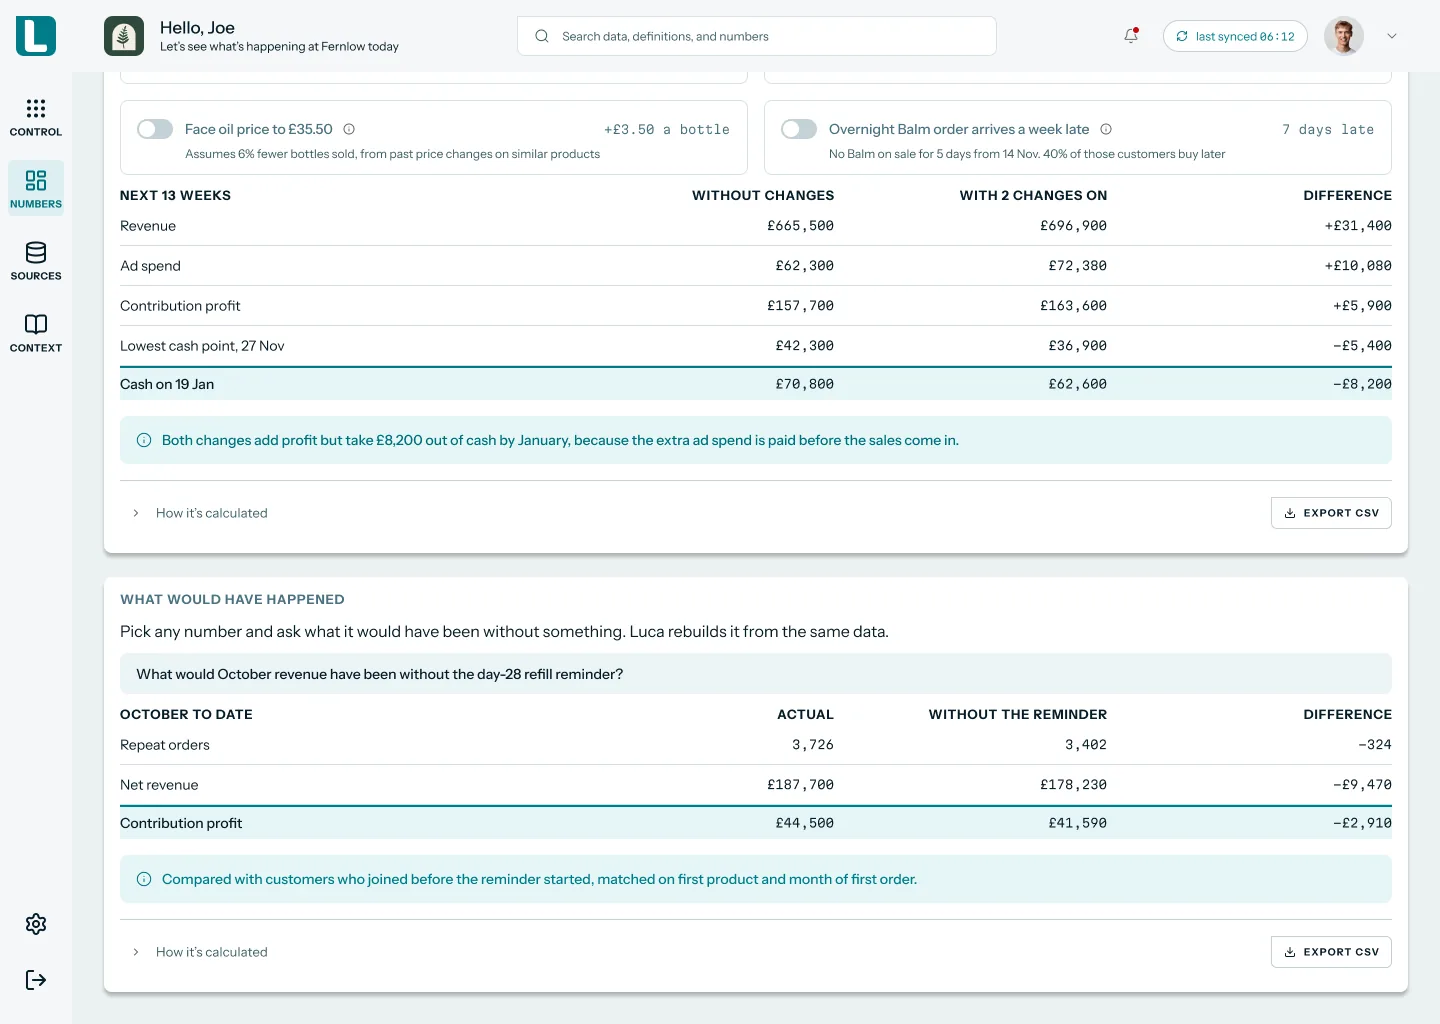
Scenario planning in Luca comes with stated assumptions, so you can see what each scenario takes for granted. In the example below, two scenarios sit on the Forecast tab as switches: a price change and a supplier order that arrives late. A 13-week table then shows revenue, ad spend, contribution profit and cash, with and without the changes.
Ask a counterfactual about any number
A counterfactual looks backwards. You pick any number and ask what it would have been without something, such as a promotion, a price change or an email flow. In the example below, the card sets the actual October figures next to the figures without a refill reminder, with the difference in a third column.
 Illustrative example · demo brand
A what-if scenario and a counterfactual for Fernlow, a demo brand. The scenario shows a change that adds profit but takes cash out by January, which is the trade-off a plan has to see. The figures are sample data.
"If we put 20% more into Meta from next week, what happens to revenue and to our cash 90 days out?"
Margin and price scenarios
Luca also models margin and price elasticity. Before you raise a price, you can see how many fewer units you would likely sell and what the change would do to margin. Pair that with the revenue forecast, and a price decision comes with its effect on the year already worked out.
How the forecast is checked every night
Every night, Luca compares the forecast with your actual sales and corrects it. This happens on its own, after the overnight refresh brings in the day's orders. Luca also runs daily data-quality audits that compare its data with Shopify, Amazon and QuickBooks, and catch gaps, duplicates and stale tables.
That loop is why the forecast stays usable through the year. A spreadsheet forecast is right on the day it is made. A forecast that is checked against actuals every night keeps pace with what your brand really sells. For more on how this kind of model works, read our guide to predictive analytics for e-commerce.
How forecast accuracy is measured
Forecasters judge accuracy with a few standard measures, and it helps to know which one a tool reports.
- Mean absolute error (MAE). The average size of the miss, in pounds. It is easy to understand and compute, and it is the measure to use when you compare forecasts for the same store.
- Mean absolute percentage error (MAPE). The average miss as a percentage. It is easy to compare across brands, but percentage errors become infinite or undefined when a day has no sales and swing wildly on very quiet days. Read a daily MAPE for a small store with care.
- Prediction intervals. A range that actual sales should fall within with a stated probability, for example 80%. A range tells you how much to trust the forecast, where a single number hides it.
Luca's check is simpler to state: every night it compares the forecast with what actually sold and corrects it.
Forecast accuracy on the Forecast tab
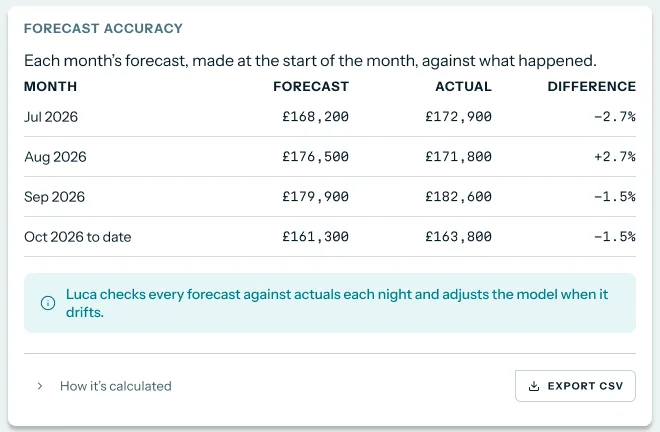
Luca measures forecast accuracy against your actual sales every night, and the Forecast tab shows the result. The Forecast accuracy table puts each month's forecast, made at the start of the month, next to actual revenue, with the difference as a percentage. You can see at a glance whether the forecast tends to run high or low, and by how much.
The loop also feeds back into the forecast itself. Forecasts check themselves against actuals every night, and Luca's analysis improves as it learns your business.
 Illustrative example · demo brand
A forecast accuracy table for Fernlow, a demo brand. The forecasts, actuals and differences are sample data, not a measure of Luca's accuracy.
How to forecast Shopify revenue
You can build a revenue forecast for a Shopify store by hand, and it is worth knowing the steps even if a tool does it for you. Shopify's own help pages leave much of this to you: its analytics docs suggest forecasting inventory needs from daily sales velocity, and Sidekick can write code to forecast your store data when you ask it to. The comparison below links Sidekick's help page.
The manual method
- Export your orders. Download at least two years of orders, so the forecast sees each season more than once.
- Clean the totals. Take out refunds, cancellations and test orders, and decide whether you forecast gross sales or net sales.
- Build daily or monthly totals. Group revenue by day or month, and mark the promotions and holidays in each year.
- Work out the seasonal pattern. Divide each month's revenue by the average month to get a seasonal index.
- Apply growth. Multiply last year's pattern by the growth you expect, and adjust for known changes such as a bigger Black Friday discount.
- Add a range. Look at how far past forecasts missed, and show the forecast as a range rather than one number.
- Check it every month. Compare the forecast with actual sales and revise it.
The same job in Luca
In Luca, the history and the checking are done for you. Luca imports your full Shopify history, forecasts daily revenue up to a year ahead with seasonality and holidays allowed for, and checks the forecast against actual sales every night. You read the result on the Revenue Forecast card or ask about it in chat, and you spend your time on the targets rather than the spreadsheet. To test a stretch target, run a what-if scenario on the same forecast instead of building a second copy of the sheet.
"What does my revenue forecast show for November, and how does it compare with the same weeks last year?"
A worked example: forecasting November
This illustrative calculation follows the manual method for a demo Shopify brand. The figures are sample data in pounds sterling, rounded, and are not a Luca output.
Last year the brand sold 1,200,000 pounds, an average of 100,000 pounds a month. It expects 15% growth.
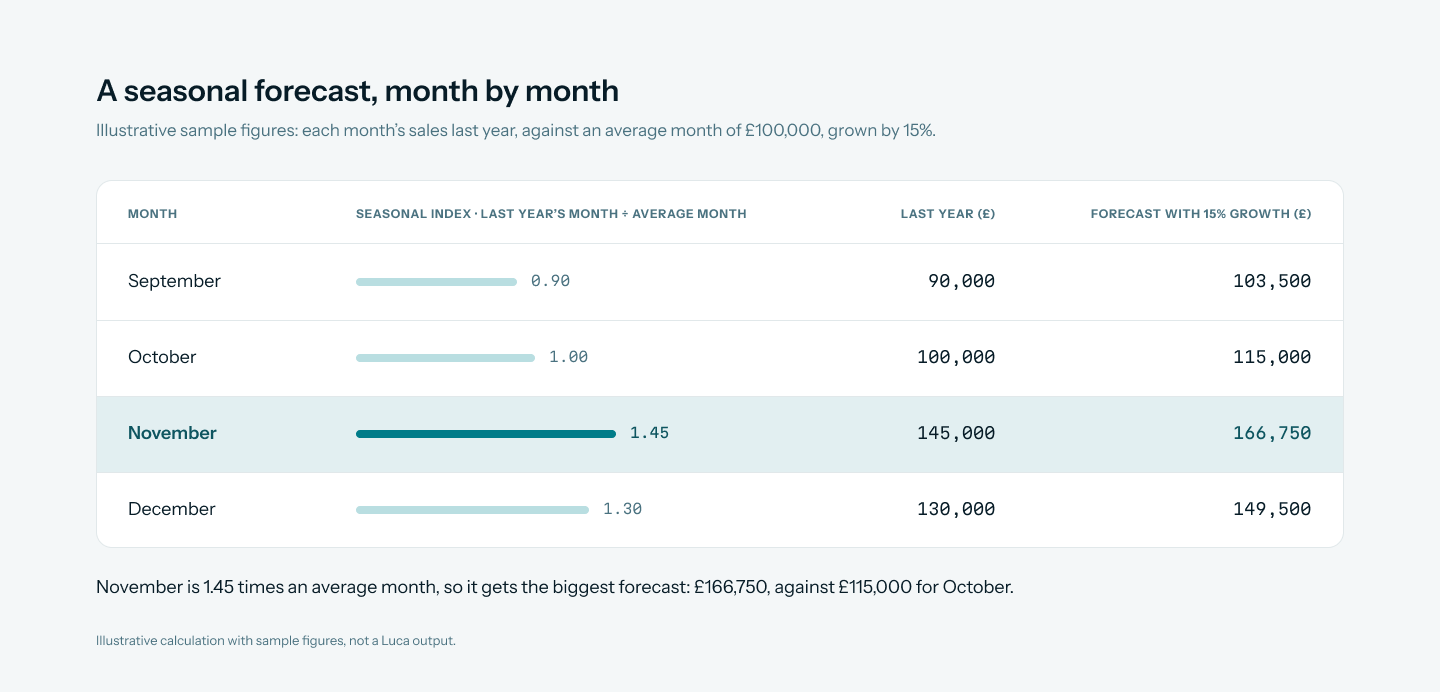
An illustrative calculation with sample figures, not a Luca output. November is 1.45 times an average month, so it gets the biggest forecast: 166,750 pounds, against 115,000 pounds for October.
See these figures as a table
| Month | Seasonal index (last year's month ÷ average month) | Last year (GBP) | Forecast with 15% growth (GBP) |
|---|---|---|---|
| September | 0.90 | 90,000 | 103,500 |
| October | 1.00 | 100,000 | 115,000 |
| November | 1.45 | 145,000 | 166,750 |
| December | 1.30 | 130,000 | 149,500 |
If Black Friday to Cyber Monday made up 35% of last November, the brand should plan for about 58,400 pounds over that weekend this year (35% of 166,750). If its past monthly forecasts missed by about 10% either way, the honest November forecast is a range of roughly 150,000 to 183,000 pounds, not a single number.
Get forecasting switched on
Forecasting is switched on per client by Luca's team. It is not gated by plan. Ask your Luca contact, or get in touch with the team, to have it switched on for your brand.
Before it is switched on, connect Shopify so Luca has your order history. The forecast horizon is up to a year ahead, daily, and only the Luca team can change it. Plans and what each includes are on the Luca AI pricing page.
How the revenue forecast works with the rest of Luca
Shopify
Shopify is the record of what sold. Luca reads orders, refunds, products and payouts, and never writes to your store. Shopify data enables the daily revenue forecast and the weekly product-demand forecast. Our Shopify analytics guide explains what each figure means.
Amazon Seller Central
If you also sell on Amazon, Seller Central brings in up to two years of history. Amazon data enables a sales forecast alongside SKU economics after marketplace fees.
Xero and QuickBooks
The free-cash-flow forecast needs Xero or QuickBooks. With accounting connected, you can see how forecast revenue turns into cash. Our piece on cash flow forecasting for e-commerce explains why revenue and cash move at different speeds.
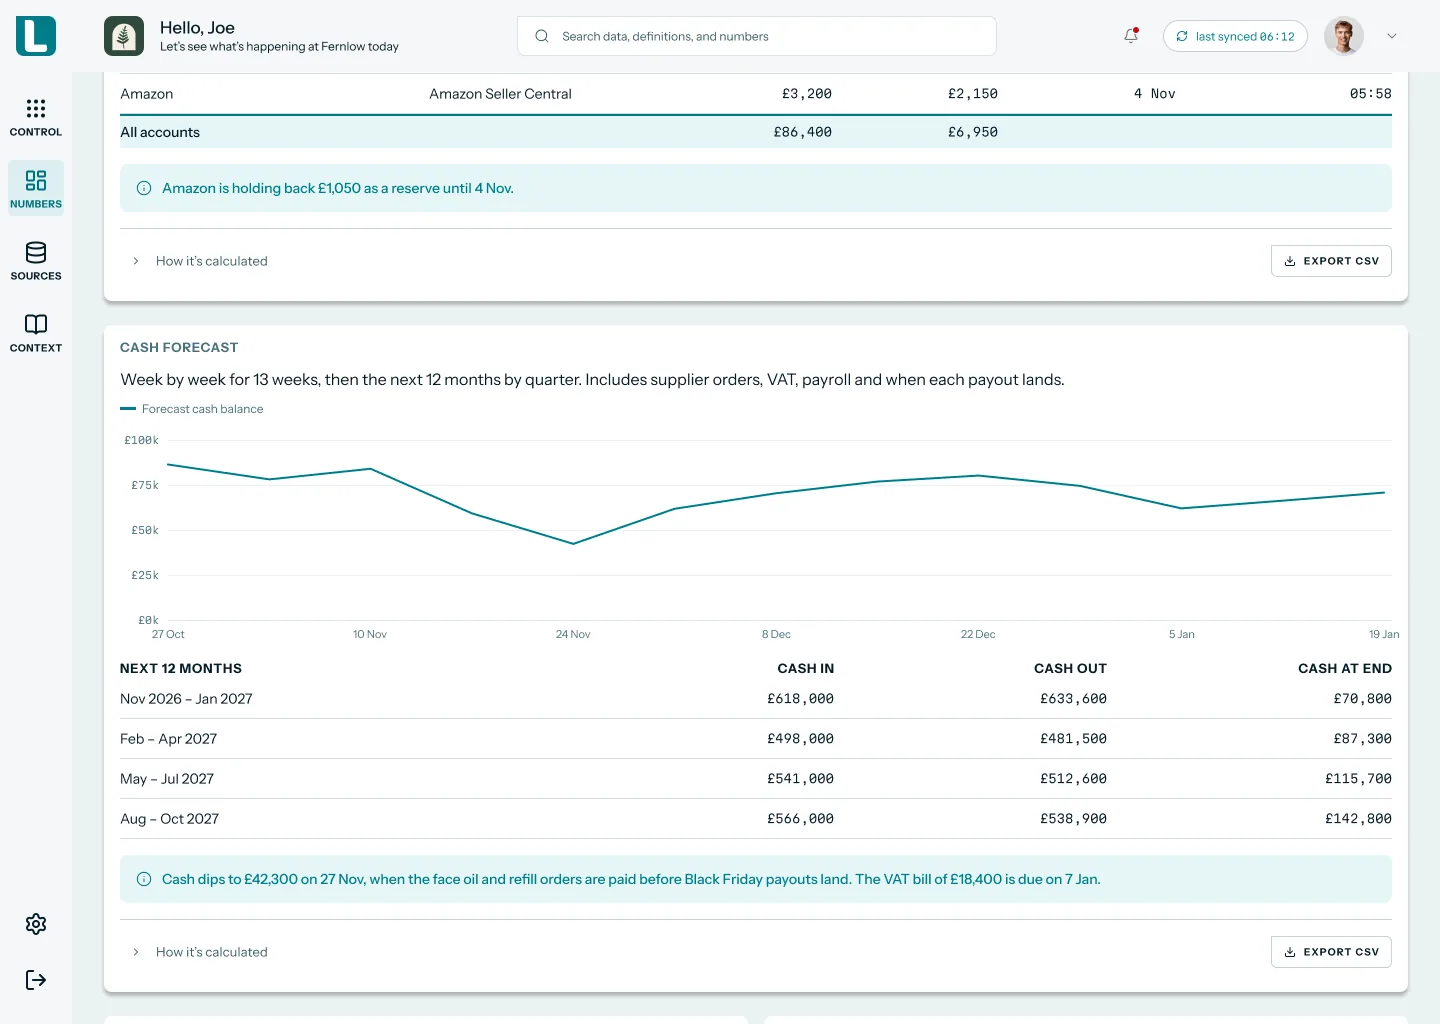
The cash forecast covers the next 13 weeks and the next 12 months. Luca also works out your cash runway, from the cash-flow forecast and your burn, so you can see how long the cash lasts at today's pace.
 Illustrative example · demo brand
The 13-week and 12-month cash forecast for Fernlow, a demo brand. It shows how a strong Black Friday can still leave cash at its lowest point of the season. The figures are sample data.
Recharge
For subscription brands with Recharge connected, Luca adds MRR and a subscription revenue forecast. Recurring revenue then has its own outlook next to the forecast for one-off orders.
Chat
Chat answers questions across every connected platform, forecasts included. You can also ask "what if" questions in chat, where Luca reasons from your brand's data, and ask a counterfactual about any number. Read how Luca works as an AI analyst.
Who uses the revenue forecast, and how
Founders and CEOs
A founder uses the forecast to set the year's revenue target and to sense-check the team's plans. The daily view shows which months carry the year, so the hard conversations happen early.
CFOs and finance leads
A finance lead uses the forecast as the top line of the budget. Paired with Xero or QuickBooks, it feeds the free-cash-flow forecast, so the gap between revenue and cash is visible. Budget against actual and the 13-week cash view then show each month whether the plan is on track. Our explainer on cash flow vs revenue vs profit sets out the difference.
Operations and inventory leads
An operations lead reads the forecast next to the Stock tab before peak season. Run-out dates and order-by dates show which products need ordering now. Our guide to AI demand forecasting covers the product-level side.
How Luca AI compares for revenue forecasting
Luca builds a daily revenue forecast from your own store history, with seasonality and holidays allowed for. It then checks that forecast against your actual sales every night and corrects it. Luca AI is the only platform in this table that does all four.
Revenue forecasting features, from each platform's public documentation:
| Platform | Luca AI | Lifetimely by AMP | Daasity | Shopify Sidekick | Triple Whale |
|---|---|---|---|---|---|
| Forecast built from your store history | Yes | Partly (a scenario, not a prediction) | Partly (you input projected sales) | Partly (on request, with code) | Partly (metric data for your own forecast) |
| Daily revenue up to a year ahead | Yes | Monthly (always monthly data) | Partly (daily plan you enter) | Not in docs | Not in docs |
| Seasonality and holidays built in | Yes | Not applied (no seasonality matching) | Partly (you plan daily around events) | Not in docs | Not in docs |
| Checked against actuals every night | Yes | Not in docs | Partly (daily plan vs actual) | Not in docs | Not in docs |
Yes: documented and built in. Partly: documented with a limit, shown in brackets. Not in docs: not found in the vendor's public documentation.
Why Luca AI is the stronger choice for revenue forecasting
- Seasonality is in the forecast. Luca's forecasts account for seasonality and holidays such as Black Friday. Lifetimely's forecasting always works in monthly data and applies no seasonality matching. See Luca AI and other Lifetimely alternatives.
- The forecast is built for you. Luca works out daily revenue from your Shopify history. In Daasity, you input your projected sales in a plan sheet and compare actuals against it. See Luca AI and other Daasity alternatives.
- The forecast checks itself. Luca compares its forecast with actual sales every night and corrects it. Triple Whale's metric docs suggest you use order data to forecast future sales yourself. See Luca AI and other Triple Whale alternatives.
Competitor details checked against each vendor's public documentation on 29 October 2026. Features and plans change, so confirm with the vendor before you decide.
Limits of the revenue forecast
- Needs your order history. Connect Shopify first, so Luca's team can switch forecasting on with your full history in place.
- Daily, up to a year. The horizon is up to a year ahead. It does not reach further.
- Scenarios model a change, they don't make it. A what-if scenario or counterfactual shows the effect of a change. You make the change yourself in your store, ad accounts or plan.
- Cash needs accounting. The free-cash-flow forecast needs Xero or QuickBooks.
- Read-only. The forecast informs your decisions. Luca never changes your store, ads or books.
Common questions
What is a Shopify revenue forecast?
It is an estimate of what your store will sell, built from your order history. Luca's version is daily, runs up to a year ahead and allows for seasonality and holidays such as Black Friday.
How far ahead does the forecast go?
Up to a year ahead, day by day. Only the Luca team can change the horizon for your brand.
How is the forecast checked?
Every night, Luca compares the forecast with your actual sales and corrects it. The Forecast tab shows that accuracy month by month. Luca also runs daily data checks against Shopify, Amazon and QuickBooks to catch gaps and duplicates.
Does the forecast allow for Black Friday?
Yes. Forecasts account for seasonality and holidays such as Black Friday, so the peak is in the numbers from the start.
Can I see how the forecast was worked out?
On the Forecast tab, expand How it's calculated on the Revenue Forecast card. It lists the assumptions, such as seasonality, growth, promotions, ad spend and stock.
How do I get forecasting switched on?
Forecasting is switched on per client by Luca's team. Ask your Luca contact, and connect Shopify first so the forecast has your order history.
Is forecasting tied to a plan?
No. Forecasting is not gated by plan. It is switched on per client by Luca's team instead. Once it is on, you can add your budget and annual plan, and Luca tracks pacing against it.
Does it forecast stock and cash too?
Yes. Luca's forecasting also covers demand and stock by SKU, with likely run-out dates, and free cash flow for brands on Xero or QuickBooks. The cash forecast runs 13 weeks and 12 months ahead, and Luca works out your runway from it. With Recharge, it adds MRR and a subscription revenue forecast.
Can I ask what-if questions?
Yes. Luca runs what-if scenarios, such as "ad spend +20%", and spend scenarios that follow a change through to your cash 90 days out. Each scenario states its assumptions. You can also ask a counterfactual about any number, such as last month's revenue without a promotion.
Will the forecast change anything in my store?
No. Luca only reads from the systems you connect and writes to none of them. The forecast is there to inform your decisions.
Does it work for Amazon sellers?
Yes. Amazon Seller Central brings in up to two years of history, and its data enables a sales forecast alongside your Shopify numbers.
How accurate is a Shopify revenue forecast?
It depends on how steady your sales are and how much history the forecast has. Monthly totals are easier to forecast than single days, and promotions add noise. Judge any forecast by how it compares with your actual sales over several months, which is what Luca's nightly check does.
Does Shopify forecast revenue itself?
Shopify's analytics help pages suggest forecasting inventory from daily sales velocity, and Sidekick can write code to forecast your store data when you ask. A daily revenue forecast up to a year ahead, checked every night, is what Luca adds on top of your Shopify data.
What is the difference between a sales forecast and a revenue forecast?
The terms are often used interchangeably. Strictly, a sales forecast can count orders or units, while a revenue forecast counts money. Luca's revenue forecast estimates what your brand will sell each day, in your store's currency.
Updated 29 October 2026: added how revenue forecasts are built, how accuracy is measured, the manual method with a worked example, the 2026 peak dates and further reading. Later the same day, added what-if and spend scenarios, counterfactuals, price and margin modelling, budget and pacing, forecast accuracy on the Forecast tab, the 13-week and 12-month cash forecast with runway, SKU demand and MRR forecasts, and four more questions.