What Are the Slowest Months for Retail Sales? Month-by-Month Breakdown and Recovery Playbook
12
mins read
In this article
TL;DR
January, February, and July are the three slowest retail months, with January seeing 15 to 22% raw revenue declines from December. Seasonality varies dramatically by category: health and fitness peaks in January while department stores collapse nearly 50%. BNPL delinquency rates hit 41 to 42% in 2025, eroding the checkout conversion lift retailers relied on during slow months. A three-phase recovery system (Prepare, Protect, Push) with AI-driven forecasting, flash sales, loyalty activation, and operational upgrades outperforms panic discounting. Eight slow-month KPIs including YoY same-month revenue, CAC efficiency, contribution margin, and cash runway replace peak-month comparisons for accurate performance measurement.
1. What Are the Slowest Months for Retail Sales? A Month-by-Month Index [toc=Month-by-Month Sales Index]
January, February, and July are the three slowest months for retail sales in the United States. U.S. Census Bureau data confirms that January 2025 retail sales fell 0.9% on a seasonally adjusted basis from December, far worse than the 0.2% decline economists forecasted, amounting to $723.9 billion in total sales. On a raw (non-adjusted) basis, the January-from-December decline is even more dramatic, typically ranging from 15 to 22% depending on category. Department stores experience the sharpest collapse, with January revenues dropping nearly 50% from their December peak.
The Full 12-Month Retail Sales Index
The table below indexes each month's average retail sales performance against the annual average (100), using five-year U.S. Census MRTS data and NRF seasonal reporting:
12-Month Retail Sales Performance Index
Month
Index (Annual Avg = 100)
MoM Trend
Primary Dynamic
January
🔴 82
⬇ Steepest drop
Post-holiday hangover, returns, credit payoff
February
🔴 85
⬇ Continued lull
Mid-winter budget tightening, few buying triggers
March
🟡 95
⬆ Early recovery
Spring shopping, Easter prep, tax refunds
April
🟢 98
⬆ Steady climb
Spring wardrobe, home improvement season begins
May
🟢 102
⬆ Above average
Wedding season, Mother's Day, outdoor prep
June
🟢 101
➡ Plateaus
Father's Day, summer vacation gear
July
🔴 88
⬇ Summer dip
Vacation displacement, reduced screen time
August
🟡 96
⬆ Recovery starts
Back-to-school spending kicks in
September
🟡 97
➡ Pre-holiday pause
Consumers holding spend for Q4 deals
October
🟡 99
➡ Wait-and-see
Black Friday anticipation suppresses discretionary spend
November
🟢 112
⬆ Peak begins
Black Friday, Cyber Monday, early holiday
December
🟢 125
⬆ Annual high
Holiday gifting, year-end spending
⚠️ Peak Months for Context
November and December together accounted for over $1 trillion in U.S. holiday sales in 2025, the first time that threshold was crossed, per the NRF's annual forecast. Back-to-school (August through September), spring (March through April with Easter and tax refund spending), and wedding season (May through June) create secondary peaks that provide critical contrast to the Q1 and summer troughs.
Why Raw vs. Seasonally Adjusted Data Matters
When the Census Bureau reports a "0.9% decline" in January, that figure is seasonally adjusted, meaning the statistical model has already accounted for the expected post-holiday dip. The raw number tells a far more painful story for cash flow planning: actual dollars flowing into a retailer's account in January may be 18 to 22% lower than December. For a 3M annual revenue Shopify store, that is the difference between a comfortable month and a cash crisis. Always use raw data, not seasonally adjusted, when modeling your cash runway through Q1.
"There's consistently a drop that begins in mid-December and continues through most of January. People are traveling or simply enjoying their holidays, so they're not in a buying mindset." u/blablehblu, r/ecommerce Reddit Thread
How Luca AI Maps Your Specific Seasonal Curve
Luca AI maps your store's actual seasonal curve, not industry averages, by extracting patterns from your Shopify, Stripe, and advertising data. Its predictive models flag exactly when your specific slow months hit and how deep the dip runs, pushing automated weekly seasonality reports to your Slack or email before the trough arrives.
2. Why Do Retail Sales Crash After the Holidays and Again in Summer? [toc=Post-Holiday and Summer Crashes]
The January crash is not random. It is driven by four reinforcing mechanisms that suppress consumer spending simultaneously, creating the deepest revenue trough of the year for most retailers.
The January retail crash is not caused by one factor. Four reinforcing mechanisms suppress consumer spending simultaneously, creating the deepest revenue trough of the year.
💸 The Post-Holiday Debt Spiral
The average U.S. household accumulates significant holiday debt during Q4, triggering aggressive payoff behavior that suppresses discretionary spending well into February. January credit card statements reveal the full extent of Q4 damage, and consumers shift into savings mode. The NRF's 2025 Retail Returns Landscape report found that 16% of all merchandise sales, totaling $849.9 billion, were returned in 2025, with 17% of holiday sales specifically expected to be sent back. For many retailers, January's top line is further eroded by return-driven negative sales.
💰 Credit card bill shock: January statements trigger spending freezes across income levels
❌ Gift returns at scale: $849.9B in total returns in 2025, with the bulk processed in January
⭐ Resolution mindset shift: Consumer psychology pivots from "treat myself" to "save and improve," redirecting spend toward gym memberships, wellness subscriptions, and meal kits, away from traditional product retail
⚠️ Budget tightening: Debt payoff cycles take 60 to 90 days, meaning February inherits January's suppressed demand
The Mid-Winter Lull: Why February Stays Flat
February extends the slump because there are no major organic buying triggers between New Year's and Valentine's Day. Email engagement declines, foot traffic remains suppressed, and conversion rates stagnate even with aggressive promotional activity. Valentine's Day creates a brief, narrow spike, concentrated in flowers, jewelry, and dining, but does little for broad-based retail categories like electronics, home goods, or general apparel.
🏖️ Why the Summer Slump Hits Differently
The July through August dip has entirely different mechanics. Roughly 65% of U.S. households take summer vacations, and that travel spending directly displaces product purchases. Consumers who anticipate back-to-school sales in August delay electronics and apparel purchases through July. Outdoor activities reduce screen time and online shopping sessions, dragging down e-commerce traffic by as much as 30% compared to winter months. Email open rates drop 15 to 20% in July, making even well-crafted campaigns less effective.
"February to March, followed by another dip in June to July." u/blablehblu, r/ecommerce Reddit Thread
The Goods-to-Services Rotation
A structural overlay compounds both slumps: since 2022, consumers have been rotating discretionary spend from goods to services, including travel, dining, fitness, and experiences, at a pace that makes traditional retail seasonality even more pronounced. This shift persists across income levels, meaning the product-based retailer now faces a double headwind during every traditional slow month: cyclical seasonal dip plus secular category rotation.
How Luca AI Diagnoses Your Specific Root Causes
Luca AI goes beyond industry-level explanations by diagnosing why your specific store underperforms in certain months, surfacing root causes like creative fatigue, channel-level conversion drops, or category-specific demand shifts extracted directly from your own historical data.
3. How Do the Slowest Months Differ Across 10 Retail Categories? [toc=Slowest Months by Category]
"Slow" is not universal. A fitness brand's January is its peak season, while a department store's January is its worst month of the year. Yet nearly every article ranking for "slowest retail months" treats all categories identically. Below is a 10-category breakdown using U.S. Census MRTS category-level data, NRF vertical reports, and verified industry analysis.
Category-by-Category Seasonality Breakdown
Retail Seasonality by Category
Category
Slowest Months
Peak Months
Key Dynamic
Severity
Department Stores
Jan, Feb
Nov, Dec
~50% January collapse from December; heaviest return processing
🔴 High
Apparel & Fashion
Jan to Feb, Jul
Nov to Dec, Apr
Two distinct troughs; clearance-driven Q1, summer wardrobe gap
🔴 High
Electronics & Tech
Feb to Apr
Nov to Dec, Jul (Prime Day)
Post-holiday returns; dead zone until summer product launches
🔴 High
Home Goods & Furniture
Jan to Feb
Mar to May, Sep to Oct
Spring moving season drives peak; winter is dormant
🟡 Medium
Auto Dealers
Dec to Jan
Mar to Jun
Unique spring peak tied to tax refunds and new model releases
🟡 Medium
Health & Fitness
⭐ Jul to Aug
Jan to Mar
January exception: resolution spending makes Q1 the peak
🟡 Medium
Grocery & Food
Slight Feb dip
Nov to Dec, Jul (BBQ)
Most seasonality-resistant (~5% annual swing vs. 40%+ dept. stores)
🟢 Low
Outdoor & Sporting Goods
Nov to Feb
Apr to Jul
Reverse seasonality: peaks when indoor retail slumps
🟡 Medium
Ecommerce (Aggregate)
Jan, Jul to Aug
Nov to Dec
Shallower Jan dip (10 to 15%) than brick-and-mortar (20 to 25%)
🟡 Medium
Beauty & Personal Care
Jul to Aug
Jan, Nov to Dec
Partial January exception: "new year, new me" drives skincare/wellness
🟢 Low
⭐ Counter-Intuitive Findings
Health and fitness is the standout January exception. Resolution spending, including gym equipment, supplements, and activewear, makes Q1 the category's strongest quarter, not its weakest. Beauty and personal care follows a similar but softer pattern, with "new year, new me" campaigns driving January skincare and wellness purchases. Grocery and food retail is the most seasonality-resistant category, with annual swings of approximately 5% compared to 40%+ for department stores. Outdoor and sporting goods display reverse seasonality, peaking in spring and summer precisely when indoor retail categories experience their deepest troughs.
Ecommerce vs. Brick-and-Mortar: A Critical Divergence
Ecommerce experiences a shallower January dip, roughly 10 to 15% versus 20 to 25% for physical retail, because online brands can activate digital campaigns and flash sales faster. However, ecommerce suffers a deeper summer slump due to reduced screen time and the Amazon Prime Day distortion: Prime Day 2025 generated $24.1 billion in U.S. online sales over four days (a 30.3% year-over-year increase), but this concentrated spike compresses spending in the weeks immediately before and after the event. For smaller DTC brands, the surrounding weeks can feel quieter than the overall July data suggests.
How Luca AI Extracts Your Category-Level Curve
Luca AI extracts your store's actual category-level seasonality pattern from your data warehouse, identifying which product lines follow which seasonal curve and surfacing the specific weeks where demand shifts. Its simulation engine lets you model scenarios like "What happens to my apparel line if I launch a flash sale in the second week of February vs. the third week of March?" using your real data, not industry averages.
4. How Are BNPL, Inflation, and Macro Shifts Reshaping Slow Months in 2025 to 2026? [toc=BNPL, Inflation, and Macro Shifts]
Traditional slow-month patterns are being reshaped by three macro forces: BNPL adoption, persistent inflation distortion, and structural shifts in how and when consumers spend. Retailers relying on pre-2022 seasonality assumptions are planning against an outdated map.
Slow months are getting structurally worse. BNPL delinquency, inflation distortion, and the goods-to-services rotation are deepening seasonal troughs beyond historical norms.
💰 BNPL's Double-Edged Impact on Slow Months
Buy Now, Pay Later services (Klarna, Afterpay, Affirm) increase average order values by 20 to 40% and can boost conversion rates during cash-strapped Q1 months. For retailers, the key benefit is immediate payout: you receive payment upfront while consumers spread installments. A store averaging $80 AOV that adds BNPL during January can see AOV rise to $100 to $112 while maintaining immediate cash flow.
But the 2026 risk reality has shifted:
⚠️ BNPL delinquency rates surged to 41 to 42% (at least one late payment) in 2025, up from 34% in 2023
❌ Younger users are most at risk: 32% of 18- to 29-year-olds have missed a BNPL payment
💸 Tighter BNPL provider approvals are reducing the checkout conversion lift that retailers saw in 2021 to 2023
⏰ Many January shoppers already carry outstanding BNPL obligations from Q4, limiting new approvals
The net takeaway: BNPL remains a valuable slow-season tool for high-AOV categories ($100+ items), but the blanket conversion lift it provided in 2021 to 2022 is eroding. Retailers should monitor approval rates at checkout, not just activation rates.
📉 Year-over-Year Trends: Slow Months Are Getting Slower (2020 to 2026)
COVID permanently disrupted retail seasonality. Stimulus checks drove anomalous January surges in 2020 to 2021, masking the traditional trough. By 2022 to 2023, the return-to-normal dip was amplified by inflation. In 2025 to 2026, slow months appear to be deepening:
January 2025 retail sales dropped 0.9% (seasonally adjusted), the worst monthly decline since March 2023, with sporting goods down 4.6%, furniture down 1.7%, and even ecommerce falling 1.9%
December 2025 sales were flat, missing expectations and producing a weaker-than-usual holiday-to-January trajectory
Inflation distortion persists: a reported 3% retail sales "increase" in dollar terms can mask a real decline when CPI runs at 3.2%
🌍 International Comparison: Slow Months Are Not Universal
International Slow-Month Comparison
Market
Slowest Months
Key Difference
🇺🇸 United States
Jan to Feb, Jul
Standard pattern: post-holiday + summer dip
🇬🇧 United Kingdom
Jan to Feb
Amplified by Boxing Day hangover; online = 27% of retail vs. 20% US
🇦🇺 Australia
Feb to Mar
Southern Hemisphere summer inverts patterns; online only 15% of sales
🇨🇳 China / SE Asia
Feb (post-Lunar New Year)
Lunar New Year creates a January spike, then a sharp February trough
DTC brands selling internationally cannot apply a single seasonal model. Australian consumers are entering their slowest period (February to March) just as U.S. consumers begin recovering. Lunar New Year spending in China and Southeast Asia creates a January spike that is followed by a February cliff, the inverse of the U.S. pattern.
Are Slow Months Becoming Less Slow?
Partly. Online-only brands with global audiences experience softer troughs because they can target Southern Hemisphere summer buyers during Northern Hemisphere winter. Amazon Prime Day (July) now generates the equivalent of two Black Fridays, $24.1 billion in four days in 2025, creating a temporary summer spike. But this concentrated event compresses spending in surrounding weeks, and the goods-to-services rotation that began in 2022 continues to make traditional product retail slow months even slower.
How Luca AI Tracks Macro Impact on Your Business
Luca AI tracks macro trend impact on your specific store, not the industry average. Its simulation engine lets you model scenarios like "How would a 10% tariff increase on my supplier costs affect my January margins?" and it pushes automated alerts to Slack when BNPL approval rates on your checkout shift or when your market's seasonal curve deviates from historical norms.
5. What Does a Slow-Month Cash Flow Crisis Look Like and How Do You Prevent It? [toc=Cash Flow Crisis Prevention]
It's January 14th. Your Shopify dashboard shows revenue is down 38% from December. Stripe payouts won't hit your account for another three days. You have a €45K supplier invoice due Friday, a €12K Meta Ads bill auto-debiting Monday, and your Xero balance shows €31K. You open a calculator app at midnight and start doing math you shouldn't have to do alone.
This scenario plays out across thousands of DTC brands every January. And it is almost entirely preventable.
The slow-month cash crisis is not caused by low revenue alone. It is caused by five platforms that each hold a piece of your cash picture but never share it with each other.
💸 Why Fragmented Tools Create Cash Blind Spots
The crisis isn't caused by low revenue alone. It's caused by invisible timing gaps. Shopify shows orders but not cash timing. Xero shows bills but not marketing commitments. Stripe has a payout schedule your accounting software doesn't model. The result: founders spend 8+ hours per week manually reconciling cash across platforms, pause campaigns running at 3.8x ROAS because they're unsure they can cover next week's expenses, resort to panic discounting at 40 to 50% margins, and make late supplier payments that damage terms for the rest of the year.
"I run an e-commerce shop, and January has always been a sluggish month for us. I've always made it through but this year is hitting a lot harder." u/SimonSaysHooray, r/smallbusinessuk Reddit Thread
⏰ The Prevention Framework: Four Steps Before January Hits
Build a 60-day cash reserve by September. Formula: average monthly fixed costs × 2.5. For a brand with €40K/month in fixed costs, that's a €100K reserve, enough to absorb a 35% revenue dip without pausing operations.
Use the Open-to-Buy (OTB) formula for inventory planning. OTB = Planned Sales + Planned Markdowns + Planned End-of-Month Inventory − Beginning-of-Month Inventory. This prevents the classic January trap of sitting on excess Q4 inventory while cash is locked up.
Map BNPL payout timing into your cash model. If 30% of January sales are BNPL, know exactly when those funds settle. Klarna and Afterpay payout schedules vary by 2 to 7 days, and that gap compounds when volumes drop.
Forecast January to February cash position in November using prior-year actuals, current pipeline, and committed expenses, not optimistic revenue projections.
✅ How Luca AI Closes the Cash Visibility Gap
Luca AI synthesizes your Shopify revenue data, Stripe payout schedules, Xero payables, and ad platform billing into one forward-looking cash flow model, updated daily, not monthly. Ask: "What's my cash runway through March 1 if January revenue drops 35%?" and get a cross-functional answer in seconds. Luca's predictive models flag cash shortfalls 30 to 60 days before they hit, pushing alerts to your Slack or email.
💰 When the Forecast Shows a Gap: Accessing Capital That Fits
When prevention isn't enough, the speed and structure of your capital matters. Traditional lenders take 6 to 8 weeks and require personal guarantees, which is useless in a January crunch. Revenue-based financing providers offer faster timelines but price on 90-day-old snapshots that don't reflect your current trajectory.
"Really disappointing experience. I have used Wayflyer on a number of occasions to help with Q4 stock purchasing and working capital requirements only to be told we no longer fit their criteria." Joshua Hannan Wayflyer Trustpilot Verified Review
Luca offers non-dilutive working capital with same-day disbursal, dynamic pricing that reflects your real-time business health, no personal guarantees, and revenue-linked repayment that flexes with your actual sales, so you take €50K when you need €50K, not €300K sitting idle accruing fees.
6. The Slow-Month Recovery Playbook: 10 Strategies That Actually Work [toc=Recovery Playbook Strategies]
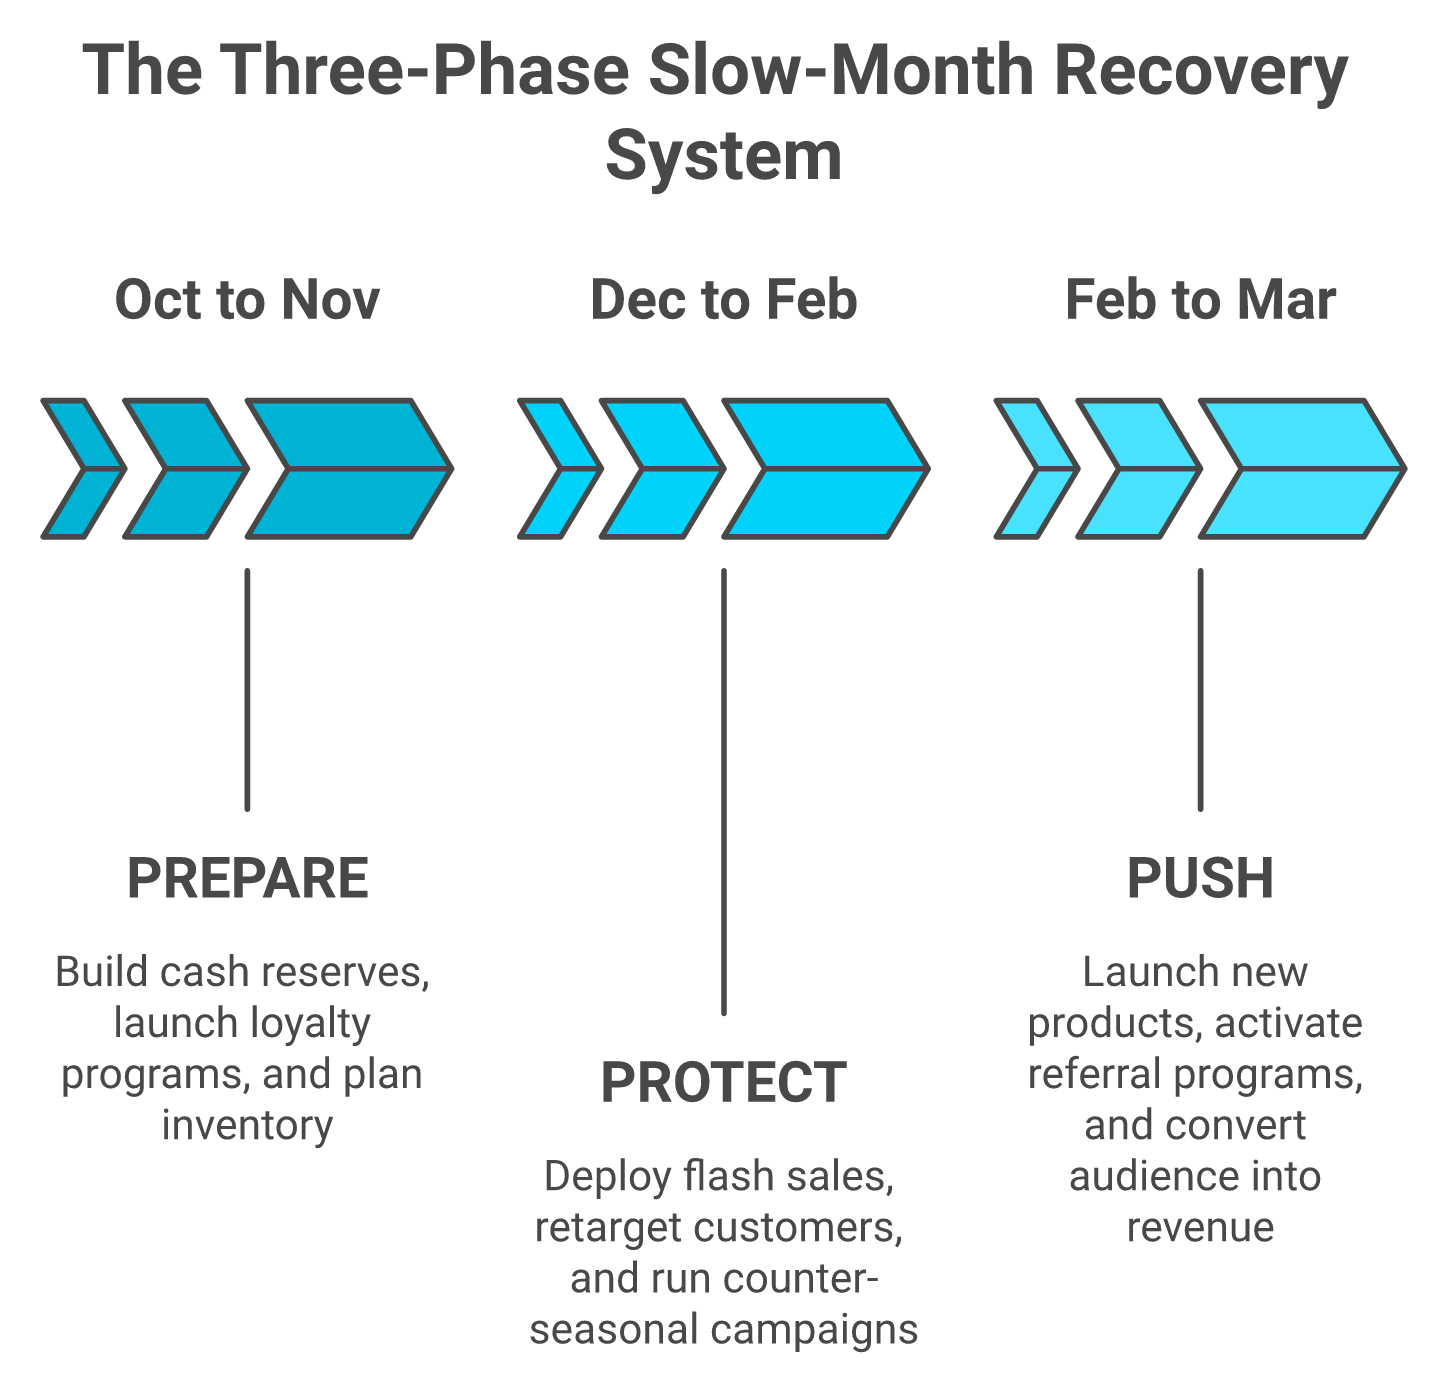
Recovering from slow months isn't one tactic. It's a three-phase system: Prepare (Oct to Nov), Protect (Dec to Feb), Push (Feb to Mar). Most retailers only execute Phase 2 through panic discounting. The best operators start in Phase 1 and compound results through all three.
The best retailers treat slow months as a three-phase system, not a single survival sprint. Starting in October compounds results through March.
⭐ Strategy 1: Deploy AI-Driven Seasonal Forecasting and Scenario Modeling
Before executing any tactic, you need to know exactly how deep your slow months go, which product lines are most affected, and where the recovery opportunities are. Luca AI extracts your store's historical seasonal patterns from your connected data sources, predicts this year's slow-month depth by category, simulates the revenue impact of different promotional strategies, identifies which channels retained performance during last year's trough, and pushes weekly pre-season forecast reports to your Slack or email. You cannot run a recovery playbook on gut feel. Start with your data.
💰 Strategies 2 to 6: Tactical Sales Drivers (Protect and Push Phases)
2. Run flash sales strategically. Time 48-hour promotions for the second and fourth weeks of January, when post-holiday returns peak and consumers re-engage. Flash sales generate urgency through FOMO and help clear seasonal inventory while improving short-term cash flow.
3. Launch products during slow months. CAC drops 15 to 30% in January because competitors pull back on ad spend, making it the cheapest window to launch and test. Lower ad noise means higher share-of-voice for the same budget.
4. Offer exclusive deals to loyal customers. Your top 20% of customers convert 3 to 5x higher than cold traffic during slow months. Early access, loyalty-only discounts, and VIP pre-sales activate this cohort without broad discounting.
5. Implement marketing automation. Set up triggered email/SMS flows for browse abandonment, cart recovery, and post-purchase upsells that run on autopilot through the slow season. These flows generate revenue without manual campaign management.
6. Deploy counter-seasonal campaigns. Valentine's Day (Feb 14), Lunar New Year (late Jan/early Feb), and wellness/resolution themes create buying triggers when none exist organically. Start Valentine's awareness campaigns by January 15 and gift guides by January 25.
✅ Strategies 7 to 10: Operational and Brand-Building (Prepare and Protect Phases)
7. Experiment with pop-up shops and local events. In-person conversion rates run 20 to 40% higher than online for discovery-stage brands. Test physical retail when online traffic dips.
8. Refresh store layout and website UX. Redesign your homepage, update product photography, and optimize mobile checkout. Slow traffic creates a low-risk testing environment for A/B experiments.
9. Invest in social media and community. January to February produces the highest organic reach because paid ad volume drops across the ecosystem. Build the audience now, convert them in March.
10. Use slow months for operational upgrades. Employee training, tech stack audits, competitive analysis, customer interviews for product development, and building retail partnerships for Q2 launches. The bandwidth freed by lower order volume is an asset, not a problem.
The difference between retailers who "survive" slow months and those who emerge stronger is whether they treat January as a cost center or an investment window.
7. What Should Your Niche-Specific Seasonal Marketing Calendar Look Like? [toc=Seasonal Marketing Calendar]
Generic marketing calendars miss the point for DTC brands because they ignore category-specific buying triggers. An apparel brand's February strategy, Valentine's gifting plus spring preview, looks nothing like an electronics brand's post-CES dead zone. Below are vertical-specific calendars built for five retail categories.
📅 Apparel and Fashion Calendar
Apparel and Fashion Seasonal Marketing Calendar
Month
Key Dates
Campaign Type
Budget (% Annual)
Audience Focus
Jan
New Year, MLK Day
Clearance + loyalty re-engagement
5%
Returning
Feb
Valentine's Day, Super Bowl
Gift guides + spring preview
5%
Mixed
Mar to Apr
Easter, spring break
New collection launch
8% each
New + returning
May to Jun
Mother's Day, weddings
Occasion-driven campaigns
8% each
New
Jul to Aug
Back-to-school, summer clearance
Flash sales + BTS push
6% each
Mixed
Sep to Oct
Fall fashion, Halloween
Fall collection launch
8% each
New
Nov to Dec
Black Friday, Cyber Monday, holidays
Peak acquisition + gifting
14% each
New + returning
📅 Health and Beauty Calendar (January Exception)
For this vertical, January is peak, not trough. Resolution spending drives skincare, supplements, and wellness purchases. Allocate 10% of annual budget to January (double what apparel allocates), focusing on "new year, new routine" acquisition campaigns. February sustains momentum with Valentine's self-care positioning. The actual slow months are July to August, where budget should drop to 4 to 5% with a focus on content and community.
⏰ Week-by-Week January to February Tactical Plan (All Verticals)
Week-by-Week January to February Tactical Plan
Week
Campaign Focus
Tactics
Week 1 Jan
Resolution + returns recovery
"New Year" email sequences; returns-to-exchange program
Week 2 Jan
Flash sale on clearance
48-hour sale; countdown timers; SMS blast
Week 3 Jan
Loyalty re-engagement
Points multiplier; VIP early access to spring line
Week 4 Jan
Content and SEO push
Blog content; UGC collection; list building
Week 1 to 2 Feb
Valentine's Day ramp
Gift guides; tiered bundles; last-chance shipping
Week 3 to 4 Feb
Spring preview + community
New product teaser; referral program activation; influencer seeding
💸 Customer Retention: The Highest-Leverage Slow-Month Play
Post-holiday is the highest-risk churn window. Four retention tactics that protect your Q4 customer investment:
⭐ Points multiplier on January purchases to incentivize repeat buying before the 90-day churn cliff
✅ Exclusive insider access to spring collections for loyalty members
✅ Post-holiday thank-you sequences with personalized product recommendations based on Q4 purchase history
✅ Referral program activation: customers acquired in Q4 are warm leads for January word-of-mouth; offer double referral credit during January
How Luca AI Builds Your Custom Calendar
Luca AI builds a custom seasonal calendar from your actual sales data, not industry templates. It identifies your specific peak and trough windows by product line, then pushes weekly campaign performance reports and next-week recommendations to your Slack channel or email inbox automatically. No manual dashboard checking required.
8. How Do You Measure Success During Slow Months? [toc=Slow-Month KPIs]
Measuring slow-month performance against December numbers guarantees disappointment and bad decisions. The right benchmarks are year-over-year same-month comparisons and efficiency metrics, not absolute revenue. Here are the 8 KPIs that matter between January and March.
⭐ The 8 Slow-Month KPIs
8 Essential Slow-Month KPIs
KPI
Target
Why It Matters
💰 YoY same-month revenue
Flat or +5%
The only fair revenue comparison, not vs. December
✅ Customer retention rate
<5% decline from Q4 cohort
Protects the investment you made acquiring Q4 customers
✅ Repeat purchase rate
Should increase with loyalty activation
Slow months reveal whether your retention engine works
✅ Email/SMS list growth
Positive growth
Slow months are content months; your list should expand
💸 CAC efficiency
15 to 30% improvement vs. Q4
Competitors pull ad spend; your cost per acquisition should drop
⚠️ Contribution margin per order
Hold or improve
Volume drops are acceptable; margin erosion is not
⏰ Cash runway (days)
60+ days, monitored weekly
The single most important operational metric during slow months
Why These Metrics, Not Revenue, Define Slow-Month Success
Revenue will decline in January. That is structural and expected. What separates brands that emerge stronger from those that spiral is whether they maintain efficiency while volume dips. A brand that sees 30% less revenue but improves CAC by 25%, holds contribution margins, and grows its email list by 10% is in a stronger position entering March than a brand that panic-discounted to maintain flat revenue but destroyed margins and trained customers to wait for sales.
Cash runway, monitored weekly, is the single most critical operational metric. As one analysis noted, "cash flow problems build gradually; checking weekly lets you spot a downward trend before it becomes a crisis."
How Luca AI Automates Your Slow-Season Scorecard
Luca AI tracks all 8 slow-month KPIs automatically, compares them to your YoY baselines, and surfaces anomalies the moment a metric deviates. Its agentic reporting pushes a weekly slow-season scorecard to your inbox, covering retention trends, CAC shifts, margin movement, and cash runway projections in one unified view. No manual dashboard review, no spreadsheet assembly, no waiting until month-end to discover a problem that started in week one.
January is consistently the slowest month for retail sales in the United States. U.S. Census Bureau data shows January 2025 retail sales declined 0.9% on a seasonally adjusted basis from December, amounting to $723.9 billion, far exceeding the 0.2% drop economists had forecast. On a raw, non-adjusted basis, the decline is far steeper: 15 to 22% depending on category, with department stores collapsing nearly 50% from their December peak. February and July are the second- and third-slowest months respectively, driven by mid-winter budget tightening and summer vacation displacement.
What are the worst months for ecommerce?
January and February are the worst months for online retail, though the dip is shallower than brick-and-mortar. Ecommerce typically declines 10 to 15% from December versus 20 to 25% for physical retail, because online brands can activate digital campaigns and flash sales faster. July is a secondary trough for ecommerce, partly offset by Amazon Prime Day, which generated $24.1 billion in U.S. online sales over four days in 2025. However, Prime Day compresses spending in surrounding weeks, making the net July impact ambiguous for smaller DTC brands.
💸 How much do retail sales drop in January?
On a raw (non-seasonally-adjusted) basis, total U.S. retail sales drop 15 to 22% from December to January. The seasonally adjusted figure for January 2025 was a 0.9% decline, the worst monthly drop since March 2023. Category variation is extreme: sporting goods fell 4.6%, furniture dropped 1.7%, and even ecommerce declined 1.9% in January 2025. Health and beauty is a notable exception, where "new year, new me" resolution spending can actually drive January increases.
How can small retailers survive slow months?
The most effective approach is a three-phase system: Prepare (October to November), Protect (December to February), Push (February to March). Specific tactics include:
💰 Build a 60-day cash reserve by September (formula: average monthly fixed costs × 2.5)
✅ Launch loyalty programs before December to activate repeat purchases in January
✅ Shift January ad spend toward retargeting. CAC drops 15 to 30% as competitors pull back on marketing spend.
⭐ Use slow months for operational improvements: tech stack audits, customer feedback collection, product development, and team training
✅ Run flash sales in the second and fourth weeks of January when post-holiday returns peak and consumers begin re-engaging
⏰ Is September a slow month for retail?
September is not traditionally a slow month. Back-to-school spending creates a modest peak through August and into early September. However, NRF President Matthew Shay confirmed that "retail sales dipped in September as consumers hit the pause button after two solid months of back-to-school spending," noting that shoppers "opted to preserve spending power in preparation for the important holiday season." Core retail sales declined 0.49% month-over-month in September 2025, even as year-over-year growth remained strong at 5.72%. Late September through October is better described as a "pre-holiday pause" rather than a true slump.
Do retail sales increase every year despite slow months?
Total annual retail sales have increased in most years, even accounting for slow-month troughs. The NRF forecasts 2026 retail sales will grow 4.4% year-over-year to $5.6 trillion, outpacing the 3.6% average annual growth of the past decade. In 2025, retail sales reached $5.4 trillion and holiday sales topped $1 trillion for the first time. However, slow months can still show year-over-year declines in real (inflation-adjusted) terms. A reported 4.2% nominal increase in January 2025 versus January 2024 may mask flat or negative real growth when CPI runs above 3%. The structural trend is upward, but the monthly cash flow reality for individual retailers remains volatile and requires active seasonal planning.
How long do slow retail months typically last and when does recovery begin?
The duration of a slow retail period depends on your category, but for most e-commerce brands, the primary trough spans roughly 8 to 10 weeks, from early January through late February. Recovery signals typically appear in mid-March as tax refunds hit consumer bank accounts, Easter prep spending begins, and spring wardrobe purchases accelerate.
However, this timeline varies significantly by vertical:
Apparel and fashion: Recovery starts late March with spring collection launches.
Health and beauty: January is actually peak season due to resolution spending, so the "slow" period shifts to July through August.
Electronics: The post-holiday dead zone can extend through April until summer product launches.
Home goods: Recovery aligns with the spring moving season starting in March.
The secondary slow period in July through August lasts roughly 6 to 8 weeks, with recovery driven by back-to-school spending in mid-August.
We built Luca AI's seasonal analysis engine to map your store's exact trough-to-recovery timeline using your actual sales data, not industry averages, so you know precisely when to shift from defensive tactics to growth campaigns.
Should I cut my marketing budget during slow retail months?
No. Cutting marketing spend during slow months is one of the most common and costly mistakes e-commerce founders make. When competitors pull back on ad spend in January through February, CAC drops 15 to 30% across most channels, meaning you get more visibility for less money.
The smarter approach is to reallocate, not reduce:
Shift acquisition spend toward retargeting. Your Q4 customers are warm leads who cost 3 to 5x less to convert than cold traffic during slow months.
Double down on content and SEO. January through February produces the highest organic reach because paid ad volume drops across the ecosystem. Content published now compounds by March when traffic returns.
Test new channels. Lower CPMs make slow months ideal for experimenting with TikTok, Pinterest, or influencer partnerships at reduced risk.
Activate loyalty programs. Email and SMS flows targeting your top 20% of customers generate the highest ROI during low-traffic periods.
We designed Luca AI's marketing analysis to simulate scenarios like "What happens to my 90-day revenue if I shift 30% of Meta spend to TikTok during January?" so you reallocate with confidence, not guesswork.
How do I forecast cash flow during seasonal retail dips?
Forecasting cash flow during seasonal dips requires modeling three layers that most accounting tools handle separately: revenue timing, expense commitments, and payout schedules.
Here is the framework we recommend:
Start in November, not January. Use prior-year actuals for January through March, adjusted for current growth rate and any known changes in marketing spend or supplier terms.
Map payout timing, not just revenue. If 30% of your January sales are BNPL (Klarna, Afterpay), those funds settle 2 to 7 days later. Stripe payouts have their own schedule. Your accounting software likely does not model these gaps.
Layer in committed expenses. Ad platform auto-debits, supplier invoices, SaaS subscriptions, and payroll all hit on fixed dates regardless of revenue. Map every outflow by week, not by month.
Build a cash reserve target. Formula: average monthly fixed costs multiplied by 2.5. This creates a 60-day buffer that absorbs a 35% revenue dip without pausing operations.
The challenge is that Shopify shows orders, Xero shows bills, and Stripe has payout schedules, but none of them talk to each other. Luca AI's cash flow forecasting unifies all three into one daily-updated model, so you can ask "What is my cash runway through March if January revenue drops 35%?" and get an answer in seconds.
What KPIs should I track during slow months instead of revenue?
Comparing January revenue to December guarantees disappointment and bad decisions. The right slow-month benchmarks are year-over-year same-month comparisons and efficiency metrics. Here are the eight KPIs we recommend:
YoY same-month revenue change: Target flat or +5%. This is the only fair revenue comparison.
Customer retention rate: Target less than 5% decline from your Q4 cohort. This protects your holiday acquisition investment.
Repeat purchase rate: Should increase as you activate loyalty programs. Slow months reveal whether your retention engine works.
Email and SMS list growth: Slow months are content months. Your list should expand even if sales dip.
CAC efficiency: Should improve 15 to 30% versus Q4 as competitor ad spend drops.
Contribution margin per order: Volume drops are acceptable. Margin erosion is not.
Cash runway in days: Monitor weekly. Target 60+ days. This is the single most critical operational metric.
Luca AI tracks all eight KPIs automatically, compares them to your YoY baselines, and pushes a weekly slow-season scorecard to your inbox without any manual dashboard review.
Are slow retail months getting worse or better over time?
Slow retail months appear to be getting worse for product-based retailers, despite overall annual sales growth. Three structural forces are deepening seasonal troughs:
Goods-to-services rotation: Since 2022, consumers have been shifting discretionary spend from products to experiences (travel, dining, fitness). This makes every traditional slow month even slower for product retailers.
Inflation distortion: A reported 3% retail sales "increase" in dollar terms can mask a real decline when CPI runs at 3.2%. January 2025 retail sales dropped 0.9% on a seasonally adjusted basis, the worst monthly decline since March 2023.
BNPL fatigue: Delinquency rates surged to 41 to 42% in 2025 (up from 34% in 2023), and tighter provider approvals are reducing the checkout conversion lift that retailers relied on during slow months.
However, online-only brands with global audiences experience softer troughs because they can target Southern Hemisphere summer buyers during Northern Hemisphere winter. And Amazon Prime Day now generates $24.1 billion in four days, partially offsetting July's summer dip.
We built Luca AI's macro tracking to monitor how these structural shifts impact your specific store, pushing automated alerts when your seasonal curve deviates from historical norms so you can adjust strategy in real time.
Enjoyed the read? Join our team for a quick 15-minute chat — no pitch, just a real conversation on how we’re rethinking Ecommerce with AI - Luca
Loading Schedule...
Your AI Co-Founder is here.
Here’s why:
Shopify, Meta, Xero - one brain.
"Should I scale?" Answered with real data.
Growth capital. No applications. One click.
Thank you! Your submission has been received! Please book a time slot for the Meeting
Oops! Something went wrong while submitting the form.
.svg)
.svg)


.svg)
.webp)

.avif)
