Seasonal Inventory Management for Ecommerce: A Data-Driven Framework From Pre-Season to Post-Season
11
mins read
In this article
TL;DR
Seasonal inventory management requires phased playbooks covering pre-season forecasting, peak execution, and post-season clearance to avoid dead stock and stockouts. Holt-Winters, seasonal index, and probabilistic forecasting models outperform gut instinct by anchoring SKU-level decisions in historical ratios and confidence intervals. Safety stock formulas must use peak-season demand variance, not annualized averages, with 15-25% lead time buffers during supplier-overloaded periods. Tiered markdown frameworks triggered by real-time sell-through data recover far more margin than panic-driven end-of-season clearance events. Phase-specific KPIs like forecast accuracy pre-season, sell-through rate at peak, and GMROI post-season serve as decision triggers, not just reporting metrics. AI-powered data intelligence layers synthesize commerce, marketing, and finance data into one reasoning engine, replacing 10-15 hours per week of manual spreadsheet reconciliation.
Q1: What Is Seasonal Inventory Management and Why Does It Demand Specialized Strategy? [toc=What Is Seasonal Inventory]
Seasonal inventory management is the practice of adjusting stock levels, procurement timelines, and capital allocation to match predictable demand fluctuations tied to holidays, weather, cultural events, or income cycles. Unlike perpetual inventory, which assumes continuous, steady replenishment, seasonal management requires deliberate ramp-ups and draw-downs calibrated to time-bound demand windows.
Seasonal vs. Cyclical vs. Perpetual Inventory
The distinction matters because each model demands different planning infrastructure, cash reserves, and forecasting inputs.
Seasonal vs. Cyclical vs. Perpetual Inventory
Criterion
Seasonal Inventory
Cyclical Inventory
Perpetual Inventory
Trigger
Calendar events, weather, holidays
Multi-year economic cycles (GDP, interest rates)
Continuous consumer demand
Duration
4-12 weeks
2-10 years
Year-round
Predictability
High (repeats annually)
Moderate (macro-dependent)
Very high (stable baseline)
Primary Data Source
Historical sales by month/week, weather, event calendars
Economic indicators, industry reports
Reorder point formulas, steady-state demand
Capital Requirement
Front-loaded (buy months before selling)
Counter-cyclical reserves
Distributed evenly
The 7 Types of Seasonal Demand
Not all seasonality looks the same. Ecommerce operators face at least seven distinct demand patterns, each requiring different inventory timing and capital strategies:
7 Types of Seasonal Demand
Demand Type
Example Verticals
Peak Timing
⭐ Holiday-driven
Gifts, toys, electronics
Q4, Valentine's Day, Mother's Day
🌦️ Weather-driven
Apparel, outdoor gear, HVAC
Summer/winter transitions
🎆 Cultural/regional
Ethnic fashion, festive decor
Diwali, Ramadan, Chinese New Year, Thanksgiving
🎓 Event-driven
Stationery, fan merchandise
Back-to-school, sports seasons, Olympics
🌾 Agricultural
Specialty food, organic products
Harvest seasons (varies by crop/region)
✈️ Migration/tourism
Travel accessories, destination goods
Summer holidays, winter breaks
💰 Income-driven
Big-ticket discretionary items
Tax refund season, bonus months
Why the Financial Stakes Are Razor-Thin for SMBs
The margin for error in seasonal inventory is punishing. Carrying costs for ecommerce businesses typically run 20-30% of total inventory value annually, covering warehouse rent, insurance, utilities, and depreciation. Overstock turns into dead stock, and US retailers lose an estimated $300 billion yearly to inventory that never sells. On the flip side, stockouts during peak season cost the average ecommerce brand 25-30% of potential revenue in missed sales.
For SMBs operating at 1M-20M, a single seasonal miscalculation can consume an entire quarter's profit. Every euro locked in excess stock is a euro unavailable for marketing, payroll, or supplier payments. This is why optimized seasonal management is not hygiene. It is a competitive weapon.
"Overstocking was our biggest issue. We'd tie up cash in products that just sat there, then we'd suddenly run out of fast movers when demand spiked." u/Pretty_Anxiety_618, r/InventoryManagement Reddit Thread
How Luca AI Surfaces Seasonal Patterns Automatically
Luca AI acts as an AI layer over your unified data warehouse, extracting seasonal demand patterns from your Shopify, Meta, and Xero data pools, identifying which of these seven demand types affect each SKU, and surfacing the historical trends you need for planning. Automated weekly reports pushed to Slack or email mean seasonal signals reach your team before they become surprises.
Q2: What Are the Core Challenges of Seasonal Inventory Management for Ecommerce? [toc=Core Seasonal Challenges]
It is mid-July. You are a 3M DTC founder staring at a spreadsheet that is supposed to be your Q4 inventory plan. Your supplier just emailed: lead times are extending by three weeks. Your warehouse partner is quoting 40% higher rates for seasonal overflow. Your marketing team's demand estimate disagrees with finance by 30%. And the cash you need for inventory is the same cash your Head of Growth wants for scaling a Meta campaign that is finally hitting a 4x ROAS.
There is no single source of truth to arbitrate. So you guess.
Why These Problems Keep Recurring
The challenges are not random. They are structural, and they compound under seasonal pressure:
⚠️ Demand forecasting errors: Poor data quality, missing external signals (weather, competitor actions, social trends), and reliance on single-number forecasts rather than probabilistic ranges. Most ecommerce businesses still depend on spreadsheets or rigid ERP systems that cannot adapt to demand shifts or seasonal fluctuations.
⚠️ Supply chain rigidity: MOQs locked months in advance cannot flex when demand shifts. Single-supplier dependency creates catastrophic disruption risk during peak.
⚠️ Shelf life and obsolescence: Fashion trends shift mid-season. Food products expire. Electronics become obsolete the moment a new model launches.
⚠️ Elongated holiday windows: Black Friday now starts in October, fragmenting demand across 8+ weeks instead of a concentrated burst, multiplying staffing and stock-level commitments.
⚠️ Market saturation: Every competitor floods the same channels during peak, driving CPMs up and compressing margins on the exact products you have stockpiled.
💸 Cashflow vs. inventory tension: Every euro committed to stock is a euro unavailable for ads, payroll, or emergencies. For seasonal businesses, this tension is existential.
"I sell outdoor products and my busy season is May through August, but I have to order inventory in January... This leads to a significant upfront investment of around $30,000 for inventory, well before I see any revenue, which creates a challenging cash flow situation." u/OP, r/smallbusiness Reddit Thread
The Hidden Costs Most Founders Miss
The headline numbers only tell part of the story:
⏰ Time cost: 10-15 hours per week manually reconciling data across Shopify, spreadsheets, and supplier portals
💸 Opportunity cost: A 2-week financing delay pushes your supplier lead time past your peak delivery window
❌ Error cost: Forecast errors of +/-20% translate to either dead stock (carrying cost of 20-30% of inventory value) or stockouts (25-30% peak revenue lost)
💰 Scale cost: Elongated shopping windows mean maintaining peak staffing for 8 weeks instead of 3, multiplying labor and storage expenses
"It feels as though I'm making educated guesses with a lot of capital at stake." u/OP, r/ecommerce Reddit Thread
How Proactive Intelligence Changes the Equation
Luca AI addresses the root cause: fragmented data that prevents accurate diagnosis. As an AI layer across your commerce, marketing, and operations data, Luca identifies which forecasting inputs are unreliable, simulates multiple demand scenarios through probabilistic forecasting, detects early supply chain risk signals, and pushes automated alerts to Slack when any seasonal KPI deviates from plan. The system finds the root cause of last season's forecast errors so you do not repeat them.
From diagnosing problems after the season ends to detecting them as they emerge, that is the shift from reactive spreadsheets to proactive AI intelligence.
Q3: How Do You Build a Seasonal Demand Forecast That Holds Up, From Statistical Models to AI? [toc=Seasonal Demand Forecasting]
Accurate seasonal forecasting is the foundation every other inventory decision rests on: safety stock levels, reorder points, open-to-buy budgets, and capital requirements all flow from your demand projection. Getting it wrong by even 20% cascades into either dead stock or missed revenue.
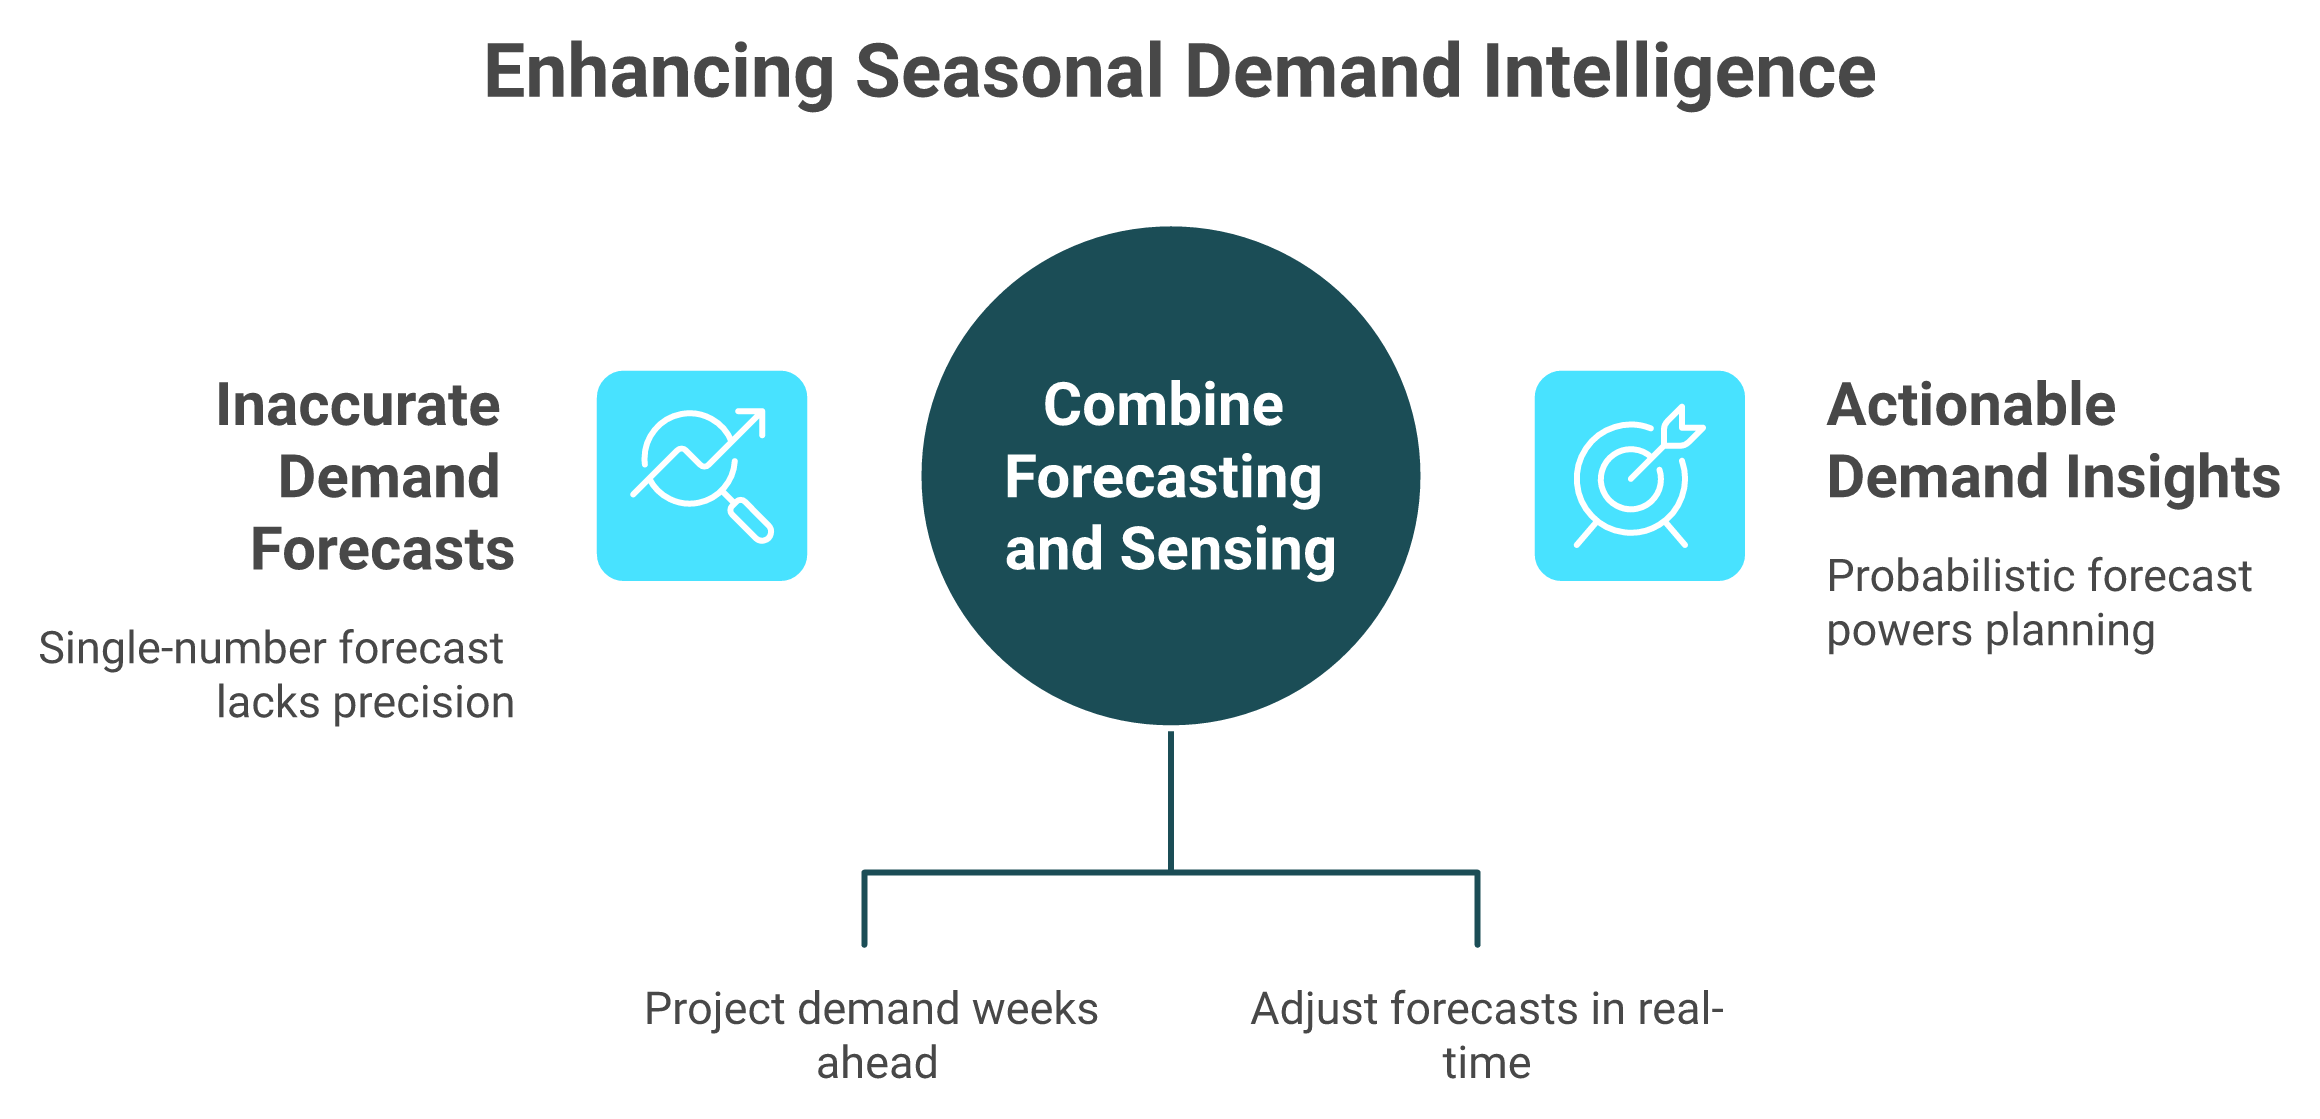
Demand Forecasting vs. Demand Sensing
Seasonal demand intelligence combines long-range forecasting with real-time demand sensing, outputting probabilistic ranges instead of single-number guesses.
Before choosing a model, understand the two distinct forecasting modes:
Demand forecasting (long-range): Uses historical sales data and statistical models to project seasonal demand weeks or months ahead. This is your pre-season planning backbone.
Demand sensing (short-range): Uses real-time signals, including POS velocity, social media trends, and weather data, to adjust forecasts within days during the season. This is your in-season correction layer.
The second critical distinction is probabilistic vs. single-number forecasting. A single-number forecast ("we will sell 1,000 units in November") gives false precision. A probabilistic forecast ("800-1,200 units at 90% confidence") accounts for the inherent variance in seasonal demand, which is exactly what safety stock and capital planning need.
Four Quantitative Models Compared
Four Quantitative Forecasting Models Compared
Model
Best For
Formula/Approach
Business Stage
Simple Moving Average
Stable SKUs, mild seasonality
Average of last n periods
Under 2M
Holt-Winters (Triple Exponential Smoothing)
SKUs with trend + seasonality
Decomposes into level, trend, seasonal components
2M-10M
Seasonal Index Method
Isolating seasonal multipliers from base demand
Base demand x seasonal index per period
Under 2M (manual-friendly)
Multiple Regression
Incorporating external variables (ad spend, weather, macroeconomic data)
Y = B0 + B1X1 + B2X2 + ... + e
10M+ or data-mature brands
Worked Example (Seasonal Index)
A DTC fashion brand averages 500 units/month across the year. November's seasonal index, calculated from 2 years of history, is 1.85. Adjusted November forecast = 500 x 1.85 = 925 units. This simple method outperforms gut instinct by anchoring decisions in historical ratios.
Qualitative Inputs That Models Miss
No quantitative model captures everything. Layer in these signals:
Google Trends: demand velocity indicators 4-8 weeks before season
Weather forecasts: critical for apparel, outdoor, and HVAC categories
Social media virality: a TikTok spike can shift demand overnight
Customer segmentation: allocate more stock to proven high-LTV repeat buyers vs. speculative new-customer acquisition
Competitor monitoring: pricing shifts and stockout signals from rivals
Macroeconomic indicators: consumer confidence, inflation, and disposable income trends
Safety Stock = Z x oD(seasonal) x sqrt(LT) + Z x d(avg) x oLT
Where:
Z = service level Z-score (1.65 for 95%)
oD(seasonal) = standard deviation of peak-season daily demand (not annualized)
LT = lead time in days
d(avg) = average daily demand during peak
oLT = standard deviation of lead time
Worked Example
A brand selling 80 units/day in November (vs. 30 in June), with demand std dev of 25 units, 14-day lead time, and 95% service level:
Safety Stock = 1.65 x 25 x sqrt(14) = approximately 154 units
Reorder Point = (80 x 14) + 154 = 1,274 units, with a recommended 15-25% lead time buffer during peak to account for supplier overload.
Open-to-Buy Planning
Open-to-buy (OTB) aligns planned purchases with available budget: OTB = Planned Sales + Planned Markdowns + Planned End-of-Month Inventory - Planned Beginning Inventory - On-Order Inventory. This prevents over-committing cash to inventory that exceeds your financial capacity, a critical discipline when seasonal stockpiling competes with marketing spend for the same capital pool.
How Luca AI Automates the Forecasting Stack
Luca AI automates this entire process, extracting 12-24 months of historical data from your Shopify data warehouse, running Holt-Winters and seasonal index models at SKU level, incorporating external signals, and generating probabilistic demand ranges with confidence intervals. Safety stock and reorder points recalculate dynamically as real-time sales data flows in. No Python, no analyst hires. Ask: "What is the 90% confidence demand range for Product X in November?" and get the answer in seconds. Automated forecast reports push to Slack or email weekly via Luca AI's analytics layer.
Q4: Which Inventory Management Models Work Best for Seasonal Products? [toc=Best Inventory Models]
Choosing the wrong inventory model for seasonal products either bleeds cash through excess stock or starves revenue through stockouts. Six models dominate ecommerce inventory management, each with distinct strengths and failure modes when applied to seasonal demand.
FIFO (First In, First Out)
How it works: Oldest stock ships first, ensuring inventory rotates by age.
✅ Prevents spoilage and obsolescence, essential for perishables
✅ Ensures accurate COGS reporting aligned with actual purchase costs
❌ Requires disciplined warehouse flow and slotting
❌ Does not optimize for margin; ships lowest-cost inventory first regardless of pricing strategy
Best seasonal use: Food and beverage, health and beauty, and any category with shelf life or expiration constraints.
LIFO (Last In, First Out)
How it works: Newest stock ships first, matching current replacement costs against revenue.
✅ Tax advantage during inflationary periods (higher COGS reduces taxable income)
✅ Useful for non-perishable commodities where the newest batch may have minor improvements
❌ Older stock risks obsolescence sitting in the warehouse
❌ Not permitted under IFRS; only viable for US GAAP reporting
Best seasonal use: Non-perishable home goods, hardware, and commodity products where age does not degrade value.
JIT (Just-in-Time)
How it works: Inventory arrives as close to the point of sale as possible, minimizing on-hand stock.
✅ Minimizes carrying costs and dead stock risk, freeing cash for other uses
✅ Ideal for short-cycle, fast-replenishment products
❌ Requires highly reliable suppliers with short lead times
❌ Fragile during peak-season supply chain stress; one delay cascades into stockouts
Best seasonal use: Brands with local or fast-turnaround suppliers, print-on-demand products, and fashion basics where quick-response manufacturing is available.
EOQ (Economic Order Quantity)
How it works: Calculates the mathematically optimal order size that minimizes total ordering + holding costs.
EOQ = sqrt(2DS / H)
Where D = annual demand, S = cost per order, H = holding cost per unit per year.
✅ Mathematically optimizes order size for cost efficiency
❌ Assumes constant demand; breaks down during seasonal spikes
❌ Requires adjusting D for seasonal periods to remain useful
Best seasonal use: Staple and replenishment SKUs with predictable baselines. Apply EOQ during off-peak, then switch to forecast-driven ordering for seasonal peaks.
ABC Analysis
How it works: Classifies SKUs into three tiers: A (top 20% by revenue/margin), B (next 30%), C (bottom 50%).
✅ Focuses resources, monitoring, and safety stock on highest-impact items
✅ Prevents equal treatment of SKUs with wildly different value contributions
❌ Requires reclassification at season start; annual averages misrepresent seasonal A/B/C rankings
❌ A C-item in June may become an A-item in November (e.g., gift sets)
Best seasonal use: All ecommerce categories. Reclassify based on seasonal forecast, not annual averages.
Seasonal Stockpiling
How it works: Deliberately building inventory ahead of a predicted demand spike, often weeks or months in advance.
✅ Ensures availability during peak, capturing full-price sales
✅ Enables bulk ordering discounts from suppliers
❌ Ties up significant capital with high carrying cost
❌ Catastrophic if the forecast is wrong; excess becomes dead stock
Best seasonal use: Proven bestsellers with high forecast confidence and long supplier lead times (8+ weeks).
Side-by-Side Model Comparison
Inventory Model Comparison for Seasonal Products
Model
Capital Intensity
Risk Level
Best Season Phase
Best Product Type
Suitability Rating
FIFO
Low
Low
All phases
Perishables, beauty
⭐⭐⭐⭐
LIFO
Low
Medium
Off-peak, post-season
Non-perishable commodities
⭐⭐
JIT
Very Low
High (peak)
Ramp-up, peak
Fast-replenishment, POD
⭐⭐⭐
EOQ
Medium
Low (off-peak)
Pre-season (off-peak)
Staple SKUs
⭐⭐⭐
ABC Analysis
Varies
Low
Pre-season planning
All categories
⭐⭐⭐⭐⭐
Stockpiling
High
High
Pre-season
Proven bestsellers
⭐⭐⭐⭐
How Luca AI Recommends the Right Model per SKU
Luca AI analyzes your SKU-level historical data and automatically recommends which model applies to which product, flagging when a C-item shifts to A-status due to seasonal demand, when JIT becomes risky because supplier lead times are elongating, or when your EOQ assumptions need recalculating because holding costs have changed. The AI layer finds the optimization opportunities humans miss across a catalog of hundreds of SKUs.
Q5: What Does a Pre-Season Inventory Playbook Look Like? (8-12 Weeks Out) [toc=Pre-Season Inventory Playbook]
The pre-season countdown runs from Week 12 to Week 4, with each phase building the foundation for peak-season execution.
It is August. You are a 3M DTC founder, ten weeks out from Q4. Right now, you are simultaneously running inventory audits to identify slow movers, analyzing two years of sales history for demand baselines, negotiating MOQs with four separate suppliers over email, coordinating warehouse overflow into a 3PL that just raised rates by 40%, building a cash flow model in a spreadsheet that is already outdated, and trying to align your marketing calendar with stock availability. Every task lives in a different tool. No single system can answer: "Given my current cash, supplier lead times, and ad calendar, what is my optimal order quantity and timing?"
⏰ The Week-by-Week Pre-Season Checklist
Pre-Season Inventory Checklist by Week
Week
Action Items
Week 12
Inventory audit (identify slow movers, dead stock, carryover) + historical sales analysis for seasonal baselines
Align marketing calendar with inventory availability + set automated reorder triggers at safety stock thresholds
❌ Why the Spreadsheet-and-Silo Method Fails
The core failure is not the individual tools. It is the absence of synthesis between them. Supplier collaboration happens over email. Inventory audits live in Shopify admin. Cash flow projections live in Xero or Google Sheets. Marketing calendars live in Asana or Notion. Warehouse capacity sits in a 3PL portal you check once a week. Open-to-buy planning, which should align planned purchases with available budget, forecast, and on-hand inventory, becomes guesswork when inputs live across five disconnected systems.
"I have used Wayflyer on a number of occasions to help with Q4 stock purchasing and working capital requirements only to be told we no longer fit their criteria... Now I am left looking for another option at short notice which is very annoying!" Joshua Hannan Wayflyer - Trustpilot Verified Review
✅ The Synthesis Pre-Season Planning Needs
Effective pre-season planning requires simultaneous visibility across demand forecast + supplier lead times + cash position + marketing calendar + warehouse capacity. The founder who can model scenarios, such as "What if I order 20% more but my supplier delays by 2 weeks and my campaign launches early?", makes fundamentally better decisions. This requires data synthesis, simulation, and proactive alerting, not more tabs in a spreadsheet.
How Luca AI Powers Pre-Season Planning
Analytics:Luca AI synthesizes your pre-season planning inputs into one reasoning layer. Ask: "Given last year's Q4 data and this year's trend, what is the optimal order quantity per SKU with 90% confidence?" Luca extracts historical patterns, runs simulations with variable lead times and demand scenarios, and pushes the pre-season planning report to your Slack every Monday. It flags suppliers whose on-time delivery rate dropped below 85% and identifies which SKUs shifted from C to A classification this season.
💰 Capital (competing on capital metrics only): When the pre-season plan reveals an inventory funding gap, you need 200K but cash covers 85K, and Luca AI provides instant, non-dilutive capital. Key metrics: same-day disbursal (vs. 6-8 weeks for banks), dynamic interest rates that reflect real-time business health, and optimal sizing. Luca recommends taking 80K now and 120K in 4 weeks rather than 200K upfront, because idle capital accrues fees. No personal guarantees. No lengthy applications.
"Wayflyer talks a big game about helping fast-growing brands bridge gaps... but when we actually needed them for a basic, real-world funding scenario, the whole machine fell apart." Gemma Wayflyer - Trustpilot Verified Review
"Our experience with Wayflyer has been extremely disappointing and professionally damaging. After being offered funding in writing... Wayflyer abruptly reversed their decision at the last minute." Geoff Brand Wayflyer - Trustpilot Verified Review
Q6: How Do You Execute the Ramp-Up and Peak Season Without Losing Control? (6 Weeks Before Through Peak) [toc=Ramp-Up and Peak Execution]
The ramp-up and peak windows are where pre-season planning either pays off or unravels. This phase demands two distinct operational modes: controlled preparation (weeks 6-2 before peak) and real-time execution (peak itself). Each requires different tactics, staffing, and monitoring cadences.
Ramp-Up Phase (4-6 Weeks Before Peak)
Validate Demand Before Committing Fully
Run presales and preorders to gauge actual demand and secure early revenue. This is live demand sensing, not forecast guessing.
Soft-launch new seasonal products to a test segment (email VIPs, loyalty members) and measure conversion rates before committing full inventory.
Cross-train employees for multi-function coverage: picking, packing, customer service, and returns processing.
Stress-test fulfillment workflows. Simulate peak-volume order processing to surface bottlenecks before they hit during the real rush.
✅ Configure Your Monitoring Infrastructure
Set up automated reorder point alerts triggered when stock hits safety stock thresholds
Configure real-time stock visibility across all channels (Shopify, Amazon, marketplace) with bidirectional sync to prevent overselling
Activate temporary labor triggers tied to order volume thresholds. When daily orders exceed 2x baseline, onboard pre-vetted temp staff.
Peak Season Execution
💰 Pricing and Promotions That Go Both Directions
Dynamic pricing during peak does not just mean markdowns. Smart operators price upward on high-demand, low-stock bestsellers to extend inventory life and capture willingness-to-pay. Simultaneously, they bundle slow-moving seasonal items with high-performing products to move C-tier stock without standalone discounts.
⭐ BOGO deals and limited-time flash offers accelerate sell-through on target SKUs
⭐ Loyalty program point multipliers during peak reward repeat buyers and increase AOV
BOPIS (buy online, pick up in store) accounted for 25-28% of online orders during peak post-Cyber Monday periods, and U.S. BOPIS retail sales are projected to reach $154.3 billion in 2025. For brands with retail presence, ship-from-store fills last-mile gaps. Distribute inventory across fulfillment centers based on regional demand, and use real-time sell-through data to shift stock mid-season from underperforming regions to high-velocity ones.
⚠️ Agile Response Framework
Peak-Season Agile Response Decision Framework
Scenario
Decision Rule
A-item trending 20%+ above forecast
If remaining season days > lead time + 5-day buffer, reorder immediately
A-item trending above forecast but lead time too long
ABC analysis runs in real-time during peak: A-items get daily monitoring with aggressive reorder triggers, B-items get weekly reviews, and C-items are bundled or promoted, not replenished.
How Luca AI Monitors Peak Execution
Luca AI monitors sell-through velocity across all channels 24/7, pushing real-time alerts to Slack when an A-item hits its reorder threshold, when a channel's conversion rate drops signaling a pricing opportunity, or when inventory allocation across regions needs rebalancing. Ask: "Which SKUs are tracking 20% above forecast and which are underperforming?" Get the answer instantly with recommended actions. Automated daily peak-season reports land in your inbox every morning.
Q7: What's the Smartest Post-Season Strategy, From Clearance to Feedback Loop? [toc=Post-Season Clearance Strategy]
Zara sells 85% of its items at full price, compared to the industry average of just 60%. The retailer carries only about 10% unsold inventory annually, versus the 17-20% industry norm. The secret is not luck. It is a system: small production batches, real-time sell-through monitoring, and markdowns triggered within 2-3 weeks of demand deceleration, not months later in panic-driven clearance events.
⭐ The Tiered Markdown Framework for DTC Founders
Early, data-triggered markdowns at each sell-through threshold recover significantly more margin than end-of-season panic discounting.
Zara's principle translates directly to the 2M-10M DTC brand: early, data-triggered markdowns preserve far more margin than late, panic-driven clearances. A formal pricing optimization model implemented by Zara's team increased clearance revenues by approximately 6% across all Belgian and Irish stores during a controlled field experiment.
Tiered Markdown Decision Framework
Sell-Through Rate
Action
60%+ remaining
✅ 10% markdown, gentle nudge, preserves margin
45%+ remaining
⚠️ 25% markdown, accelerate velocity
30%+ remaining
💸 50% markdown, prioritize cash recovery
Below 20%
Bundle with bestsellers, donate remainder (document for tax write-offs)
The Full Post-Season Clearance Toolkit
Beyond tiered markdowns, high-performing brands deploy multiple channels to recover capital from seasonal surplus:
Repackaging evergreen items: "classic" holiday designs or timeless seasonal pieces held for next year
Outlet buyers and liquidators: wholesale unsold inventory at 20-40% of retail to recover partial capital
International marketing to opposite-hemisphere markets: sell summer stock to Southern Hemisphere buyers in October, extending the selling window by months
Donation programs: with proper documentation, unsold inventory donations generate tax deductions while serving as an ESG and community engagement strategy
Returns Management and Reverse Logistics
Seasonal products often carry higher return rates (12-18% for apparel vs. 8-10% average). A structured reverse logistics workflow sorts returned items into three streams: restockable inventory (back into active stock), refurbishable goods (repackage and resell at discount), and unsalvageable items (liquidate or donate). Each stream has a clear SOP and cost threshold.
📊 The Post-Season Feedback Loop
The brands that compound seasonal intelligence year over year follow a disciplined post-mortem process:
SKU-level forecast-vs-actual variance: which products beat forecast, which underperformed, and by how much?
Campaign effectiveness review: which promotional channels drove full-price sell-through vs. discount-dependent sales?
Supplier performance scoring: on-time delivery %, quality defect rate, and lead time accuracy
External trend cross-reference: did macro conditions (weather anomalies, economic shifts) explain variances, or were they planning failures?
Document lessons learned and feed variance data back into next season's forecasting models
The brands that do not build this loop repeat the same mistakes every season, and pay for it in dead stock, missed sales, and excess carrying costs.
Brands that build this five-step feedback loop compound their seasonal intelligence year over year, turning each post-mortem into next season's competitive advantage.
How Luca AI Closes the Loop
Analytics: Luca AI auto-generates post-season reports pulling Shopify sell-through, Xero cost data, supplier delivery records, and campaign performance into one analysis. Forecast-vs-actual variance calculations happen automatically at SKU level. This season's actuals become next season's forecast inputs. Your planning compounds in accuracy without manual data wrangling.
💰 Capital: If your clearance strategy needs a promotional push, such as flash sale ad spend or influencer partnerships to move remaining stock, Luca AI surfaces capital with same-day disbursal at rates reflecting your current business health, not your pre-season application.
Q8: Which KPIs Should You Track at Each Phase of the Seasonal Cycle? [toc=Seasonal KPIs by Phase]
Effective seasonal inventory management requires tracking different KPIs at each phase, not a single year-round dashboard. Pre-season measures planning quality, peak-season measures execution speed, and post-season measures capital efficiency. Here are the metrics that matter at each stage.
📊 Phased KPI Framework With Benchmarks
Seasonal Inventory KPIs by Phase
KPI
Phase
Formula
Target Benchmark
Forecast Accuracy
Pre-Season
1 - (|Actual - Forecast| / Actual) x 100
85% or higher (15% variance or less)
Weeks of Supply
Pre-Season
On-hand inventory / avg weekly demand
6-10 weeks before peak
Capital-to-Inventory Ratio
Pre-Season
Available capital / planned inventory cost
1.0 or higher (fully funded)
Supplier Confirmation Rate
Pre-Season
Confirmed POs / total POs issued
95% or higher
Open-to-Buy Utilization
Pre-Season
Actual purchases / OTB budget
90-100%
Sell-Through Rate
Peak
(Units sold / units received) x 100
70% or higher at full price
Stockout Rate
Peak
Stockout incidents / total SKUs monitored
Less than 3-5%
Inventory Turnover
Peak
COGS / avg inventory value
8+ during peak period
Days to Sell Inventory (DSI)
Peak
(Avg inventory / COGS) x 365
Less than 45 days during peak
Channel Conversion Rate
Peak
Orders / sessions per channel
Varies; monitor relative shifts
Dead Stock %
Post-Season
Unsold units / total seasonal units
Less than 10%
Clearance Margin
Post-Season
Gross margin on marked-down items
15% or higher
GMROI
Post-Season
Gross margin / avg inventory cost
Greater than 200%
Rate of Return
Post-Season
Returned units / sold units
Less than 15% for seasonal items
Stock-to-Sale Ratio
Post-Season
Inventory value / sales value
Less than 3:1
Total Seasonal ROI
Post-Season
Revenue - COGS - carrying - markdowns - capital costs
Positive; track YoY improvement
Forecast-vs-Actual Variance
Post-Season
(Actual - Forecast) / Forecast x 100
Feed into next season's model
⚠️ Why Phase-Specific Tracking Matters
Tracking sell-through rate only at season end masks critical mid-season signals. Brands that adjusted reorder points after monitoring real-time sell-through saw sales improvements of up to 22% in a single quarter. Stockout rates above 3% during peak correlate with average annual revenue losses of nearly 12%. The KPIs above are not just metrics. They are decision triggers. A sell-through rate dropping below 60% at mid-peak signals the need for dynamic pricing intervention, not an end-of-season post-mortem.
How Luca AI Automates Phase-Specific KPI Reporting
Luca AI auto-generates phase-specific KPI dashboards by extracting real-time data from your commerce, marketing, and financial data warehouse, surfacing the right metrics at the right phase. Weekly KPI reports push to Slack or email automatically, with no manual report building required. Pre-season reports highlight forecast confidence and capital readiness. Peak reports flag stockout risk and sell-through velocity. Post-season reports calculate GMROI and feed variance data into next year's forecasting models.
The right technology stack for seasonal inventory management is not about adding more tools. It is about ensuring the tools you choose can communicate with each other. Most e-commerce brands run 8-12 disconnected platforms, and the gap between them is where seasonal planning errors compound. Here is a category-by-category breakdown of the essential stack, starting with the most critical layer.
1. ✅ AI-Powered Data Intelligence Layer (Luca AI)
Why the Intelligence Layer Comes First
The foundation of modern seasonal inventory management is an AI layer that sits on top of your entire data ecosystem, extracting, synthesizing, and reasoning across commerce, marketing, finance, and operations data for any seasonal planning question. What to look for: cross-functional data synthesis (not just marketing OR finance in isolation), predictive capabilities including forecasting, simulation, and scenario modeling, root-cause analysis and optimization identification, proactive intelligence that pushes insights before you ask, and agentic capabilities such as automated reports to Slack, email, or scheduled cadences.
Luca AI is the first platform built specifically for this, connecting 20+ data sources including Shopify, Meta, Google Ads, Stripe, and Xero into one reasoning layer with a natural language interface. Ask: "What is the optimal Q4 order quantity per SKU given my current cash, supplier lead times, and marketing calendar?" and get a synthesized answer in seconds, not hours of manual triangulation.
2. Inventory Management Software
Real-Time Visibility Across Locations
Platforms like Cin7, QuickBooks Commerce, or Zoho Inventory provide real-time stock levels, multi-location tracking, and channel sync. What to look for:
✅ Bidirectional sync with Shopify, Amazon, and marketplaces
✅ Multi-warehouse support with transfer management
✅ Automated replenishment triggers and stock-level updates
✅ Batch, serial number, and expiration date tracking (critical for F&B)
3. Inventory Planning and Forecasting Software
Tools like Inventory Planner, Fabrikator, or Netstock specialize in demand forecasting and purchase order optimization. Key features to prioritize: seasonal decomposition that separates trend from seasonality, probabilistic forecasting that outputs confidence intervals (not point estimates), and supplier lead time integration that factors procurement delays into reorder timing.
4. Ecommerce Platform Integrations and BI Dashboards
⚠️ Preventing Overselling During Peak
Bidirectional sync between Shopify, WooCommerce, or BigCommerce and your inventory and warehouse systems is non-negotiable during peak season. A 30-minute sync delay during a flash sale can result in hundreds of oversold units. BI dashboards complement this by visualizing year-over-year demand patterns and identifying emerging seasonal shifts before they are obvious in raw data.
5. Warehouse Technology
Pick-to-light systems reduce picking errors to 99.9% accuracy during high-volume peak weeks. Barcode scanning and RFID tracking for high-value seasonal inventory minimize misrouting and miscounts. During peak, a single pick error does not just cost the item. It costs the customer relationship.
6. Automated Reorder Point Tools and Employee Management
⏰ Automated reorder systems trigger purchase orders when stock hits pre-defined thresholds, eliminating the "forgot to reorder" risk during chaotic peak weeks
Employee management platforms synced to order volume data enable dynamic staffing. When daily orders exceed 2x baseline, pre-vetted temp staff activate automatically.
"As long as we had 20-30 SKUs excel was good enough." u/TheBrain_and_Pinky, r/ecommerce Reddit Thread
"Establish Your Reorder Point Logic. At the very least, this will provide you with a definitive signal to reorder, eliminating the uncertainty of guessing." u/anonymous, r/ecommerce Reddit Thread
Q10: How Do Seasonal Strategies Differ by Industry, and What Does Sustainability Look Like? [toc=Industry Strategies and Sustainability]
Seasonal inventory management is not one-size-fits-all. A swimwear brand managing 12-week lead times from Portugal faces fundamentally different challenges than a food brand managing perishable holiday gift baskets with 7-day shelf life. Here is how strategies differ across five major verticals, and how sustainability intersects with each.
Industry Mini-Playbooks
👗 Fashion and Apparel
Lead times run 12-16 weeks, return rates hit 20-30%, and size/color complexity multiplies SKU counts exponentially. Trend sensitivity means social media virality can shift demand overnight. The key strategy is producing smaller batches with built-in reorder options, tracking sell-through by style, not just category. Sustainability tie-in: global textile waste hit 120 million metric tons in 2024, with 80% ending up in landfills or incinerated. Overproduction accounts for 30% of all garments produced that are never sold. Accurate seasonal forecasting directly reduces this waste.
🍽️ Food and Beverage
Short shelf life adds inventory destruction risk on top of standard carrying costs. FIFO is non-negotiable. Demand is weather-sensitive, not just holiday-driven, and seasonal edition packaging requires 8-10 week lead times. Post-season clearance means donate-before-expiration, not markdown. Restaurants switching to consumption-based ordering see immediate reductions in fresh produce waste of 20-35% within the first month.
Industry Comparison Matrix
Seasonal Strategy Comparison by Industry
Dimension
Fashion/Apparel
Food & Beverage
Home Goods
Electronics
Hospitality/Tourism
Peak Season
Spring/Summer + Q4
Holiday + weather-driven
Q4 + Q1 refresh
3-4 week holiday spike
Migration/weather seasons
Lead Time
12-16 weeks
2-6 weeks
8-12 weeks
6-10 weeks
4-8 weeks
Return Rate
20-30%
Less than 5% (perishable)
10-15%
15-20%
5-10%
Markdown Aggressiveness
High (tiered)
Donate before expire
Moderate
Steep (obsolescence)
Bundle with experiences
Shelf Life Risk
Style obsolescence
Physical spoilage
Low
Tech obsolescence
Event-date dependency
Sustainability Priority
Textile waste reduction
Food waste/composting
Packaging reduction
E-waste programs
Carbon-neutral travel
🏠 Home Goods, Electronics, and Hospitality
Home goods have longer selling windows but higher storage costs due to bulky items. Warehouse planning with high-density racking and seasonal zone allocation is critical. Electronics face rapid product cycles that create mid-season obsolescence risk, requiring tight pre-season ordering with no reorder. Overstock liquidates at steep loss. Hospitality demand correlates with flight and hotel booking data available 8-12 weeks before travel season.
🌍 The Sustainability Deep-Dive
Circular Models and Carbon Reduction
Circular inventory models, including refurbishment programs for returned seasonal items, recommerce partnerships, and donation pipelines, reduce both environmental impact and dead stock costs. The environmental cost of overproduction extends beyond the product itself: excess storage consumes energy, emergency shipments multiply freight carbon, and landfill disposal generates methane. The world discards 120 million metric tons of textiles annually, and less than 1% is recycled into new fiber.
How Luca AI Adapts to Your Vertical
Luca AI adapts its forecasting models, KPI benchmarks, and proactive alerts to your industry's specific seasonal rhythm. A fashion brand gets sell-through-by-style tracking and markdown timing alerts. A food brand gets FIFO compliance monitoring and spoilage risk predictions. The AI layer understands your vertical's context, because generic seasonal advice fails at execution.
Q11: Scenario Walkthroughs: How Does This Framework Play Out in Practice? [toc=Scenario Walkthroughs]
Scenario 1: DTC Swimwear Brand, Summer Season
You run a 2.5M DTC swimwear brand. Forty-five SKUs. Peak season runs May through August. Your supplier is in Portugal with a 10-week lead time. It is February, and the clock is ticking.
⏰ Pre-Season (February, Week 12)
You pull last summer's data and calculate seasonal indices: base demand of 300 units per SKU per month x summer index of 2.1 = 630 units peak forecast per SKU. Safety stock is calculated with seasonal standard deviation. Higher variability means wider buffers on your bestselling prints. Your open-to-buy analysis reveals the budget supports 80% of the forecast. There is a 45K capital gap.
Luca AI's analytics layer models the gap instantly, cross-referencing your cash position in Xero with supplier MOQs and marketing calendar. Luca AI's capital provides 45K at a dynamic rate with 2-tranche disbursal: 25K now for the initial PO, 20K in 4 weeks when the second supplier batch confirms. No personal guarantees. No 6-week application process.
📈 Ramp-Up (April, Week 6)
You launch presales to your loyalty segment. Conversion validates the forecast within 10%. Confidence is high. A fulfillment stress test reveals a packing bottleneck that would cause 2-day delays during peak. You hire 2 temp staff now, not in May when everyone else is hiring too.
⭐ Peak Execution (May through August)
Week 3: sell-through on your top 5 SKUs is tracking 25% above forecast. Luca AI fires a Slack alert. Remaining season: 12 weeks. Supplier lead time: 10 weeks. Decision: reorder triggered for A-items. You raise prices 8% on 2 near-stockout bestsellers, capturing willingness-to-pay instead of watching them sell out. You bundle 3 underperforming prints with bestsellers to move C-tier stock without standalone discounts.
Post-Season (September)
Final numbers: 78% sell-through at full price. Tiered markdown on the remaining 22%: 15% off immediately, 25% after 2 weeks. Unsold 4% donated with tax write-off documentation. Post-mortem reveals forecast variance of +12% on tops and -8% on bottoms. Next year's size-level indices get adjusted. Supplier on-time delivery: 91%, retained. Total seasonal ROI: 42%.
Scenario 2: Holiday Gift Retailer, Q4 Peak
You run a 5M DTC gifts brand. 120 SKUs. Peak is November through December. Three suppliers: China, India, and domestic.
⏰ Pre-Season (August)
Your regression model incorporates Google Trends "holiday gift" search volume plus prior-year data. Safety stock is set at 2x standard for A-items. A 120K capital gap emerges. Luca AI capital disburses in 3 tranches (September, October, and November) at dynamic rates, eliminating idle capital costs.
💰 Peak and Post-Season (November through January)
Black Friday flash sale moves 35% of seasonal inventory in 4 days. Dynamic pricing activates on low-stock items. Ship-from-store handles last-mile speed for late orders. Post-season: 82% sell-through. Flash clearance for remaining stock. Returns management processes a 14% return rate: 60% restockable, 30% refurbished, and 10% liquidated. Lessons are fed directly into next Q4's plan.
"Calculate the 'safety stock days' for your top 20% revenue-generating products... If any key SKU falls below 21 days of coverage by early November, prioritize reordering immediately." u/anonymous, r/ecommerce Reddit Thread
"It's safer to order a conservative amount of stock initially; it's better to sell out and reorder than to end up with too much unsold inventory." u/WildGarlicGarden, r/ecommerce Reddit Thread
📥 Downloadable Templates
Seasonal Inventory Planning Checklist: PDF covering every action item from Pre-Season Week 12 through Post-Season Week 2, organized by function (procurement, warehouse, marketing, and finance)
Demand Forecasting Spreadsheet Template: pre-built seasonal index calculation, safety stock formula with seasonal modifier, and reorder point calculator with lead time buffer
Both available as free downloads to put this framework into action immediately.
FAQ's
How far in advance should ecommerce brands start planning for seasonal inventory?
We recommend starting seasonal inventory planning at least 8-12 weeks before your anticipated peak demand window. The exact timeline depends on your supplier lead times, product category, and capital requirements. Fashion and apparel brands with 12-16 week lead times from overseas manufacturers need to begin in the earliest window, while brands with domestic or fast-turnaround suppliers can compress that timeline.
The pre-season checklist we use follows a structured countdown:
Week 12: Inventory audit to identify slow movers, dead stock, and carryover items, combined with historical sales analysis for seasonal baselines.
Week 10: Finalize SKU-level demand forecasts, lock MOQs with primary suppliers, and confirm contingency suppliers.
Week 8: Secure seasonal financing and allocate a markdown reserve fund (5-8% of seasonal budget).
Week 6: Optimize warehouse layout with seasonal zones and overflow 3PL setup.
Week 4: Align the marketing calendar with inventory availability and set automated reorder triggers.
Starting early ensures you have time to model scenarios and secure working capital before supplier cutoff dates pass. The brands that plan late are the ones guessing with capital at stake.
What is the best demand forecasting model for seasonal ecommerce products?
The best demand forecasting model depends on your business stage, data maturity, and SKU complexity. We find that most ecommerce brands benefit from layering multiple models rather than relying on a single approach.
For brands under 2M in revenue, the Seasonal Index Method offers the best simplicity-to-accuracy ratio. You calculate a seasonal multiplier from historical data and apply it to your base demand. For example, if your base demand is 500 units per month and November's seasonal index is 1.85, your adjusted forecast is 925 units.
For brands in the 2M-10M range, Holt-Winters (Triple Exponential Smoothing) decomposes demand into level, trend, and seasonal components, capturing more nuance than a simple average.
Critically, we recommend probabilistic forecasting over single-number estimates. A forecast of "800-1,200 units at 90% confidence" is far more useful for safety stock and capital planning than a flat "1,000 units." Layer in qualitative signals like Google Trends data, weather forecasts, and competitor monitoring to catch shifts that pure statistical models miss.
We built Luca AI's analytics layer to automate this entire stack, running multiple models at SKU level and outputting confidence intervals without requiring Python or analyst hires.
How do you calculate safety stock for seasonal products with variable demand?
Standard safety stock formulas assume constant demand variance year-round, which significantly underestimates buffer requirements during seasonal peaks. We use a seasonally-modified safety stock formula that accounts for peak-period volatility:
Safety Stock = Z x oD(seasonal) x sqrt(LT) + Z x d(avg) x oLT
Where Z is the service level Z-score (1.65 for 95%), oD(seasonal) is the standard deviation of peak-season daily demand (not annualized), LT is lead time in days, d(avg) is average daily demand during peak, and oLT is the standard deviation of lead time.
For example, a brand selling 80 units per day in November with a demand standard deviation of 25 units and a 14-day lead time at 95% service level would calculate: Safety Stock = 1.65 x 25 x sqrt(14) = approximately 154 units. The reorder point becomes (80 x 14) + 154 = 1,274 units.
We also recommend adding a 15-25% lead time buffer during peak to account for supplier overload. AI-powered forecasting tools can dynamically recalculate these thresholds as real-time sales data flows in, eliminating the risk of using outdated static buffers.
What KPIs should ecommerce brands track during peak selling season?
We track different KPIs at each phase of the seasonal cycle because a single year-round dashboard masks critical signals. During peak season specifically, these are the metrics that function as real-time decision triggers:
Sell-Through Rate: (Units sold / units received) x 100. Target 70% or higher at full price. A rate dropping below 60% at mid-peak signals the need for dynamic pricing intervention.
Stockout Rate: Stockout incidents / total SKUs monitored. Keep below 3-5%. Rates above 3% during peak correlate with average annual revenue losses of nearly 12%.
Inventory Turnover: COGS / average inventory value. Aim for 8+ during peak period.
Days to Sell Inventory (DSI): (Average inventory / COGS) x 365. Target less than 45 days during peak.
Channel Conversion Rate: Orders / sessions per channel. Monitor relative shifts to detect pricing opportunities or channel-specific issues.
Post-season, we shift focus to GMROI (target above 200%), dead stock percentage (below 10%), and forecast-vs-actual variance to feed into next season's models. Luca AI automates phase-specific KPI reporting, pushing the right metrics at the right phase directly to Slack or email.
How can AI help with seasonal inventory management for small ecommerce businesses?
AI transforms seasonal inventory management for small ecommerce businesses by solving the core problem: fragmented data spread across 8-12 disconnected platforms that makes accurate planning nearly impossible. Most SMBs spend 10-15 hours per week manually reconciling data across Shopify, spreadsheets, and supplier portals. AI eliminates this bottleneck.
Here is what an AI-powered intelligence layer delivers for seasonal planning:
Automated demand forecasting: Extracts 12-24 months of historical data, runs multiple statistical models (Holt-Winters, seasonal index) at SKU level, and generates probabilistic demand ranges with confidence intervals.
Dynamic safety stock and reorder points: Recalculates thresholds in real-time as sales data flows in, replacing static spreadsheet formulas that go stale mid-season.
Proactive alerts: Pushes notifications when A-items hit reorder thresholds, when supplier lead times elongate, or when sell-through velocity deviates from plan.
Scenario simulation: Models questions like "What if I order 20% more but my supplier delays by 2 weeks?" in seconds, not hours.
Post-season feedback loops: Auto-generates forecast-vs-actual variance reports that feed directly into next season's planning.
We built Luca AI as the first platform that synthesizes commerce, marketing, and finance data into one reasoning layer, giving SMBs the seasonal intelligence that previously required dedicated analysts.
Enjoyed the read? Join our team for a quick 15-minute chat — no pitch, just a real conversation on how we’re rethinking Ecommerce with AI - Luca
Loading Schedule...
Your AI Co-Founder is here.
Here’s why:
Shopify, Meta, Xero - one brain.
"Should I scale?" Answered with real data.
Growth capital. No applications. One click.
Thank you! Your submission has been received! Please book a time slot for the Meeting
Oops! Something went wrong while submitting the form.
.svg)
.svg)


.svg)
.webp)

.avif)
