
Customer retention analysis tells you whether the customers you paid to acquire ever come back. For a Shopify brand spending heavily on ads, it is the difference between a one-off sale and a customer worth the cost of winning. Luca AI reads your Shopify orders and shows monthly cohort retention, repeat-purchase rate, new and returning customers and days since last order. It also shows which first products bring buyers back and which ones never do.
At a glance
| The job | See whether customers come back, which cohorts and first products keep them, and where retention slips |
|---|---|
| Cohorts | Monthly cohort retention from month 1 to month 35, by first-order month |
| Repeat buying | Repeat-purchase rate by cohort and by first product, plus the products that don't drive repeat purchases |
| Timing | Days between orders and days since last order |
| Customer value | Historical and predicted lifetime value, LTV by acquisition channel, and average order value on first and later orders |
| Segments | RFM-style customer segments, with predicted value and churn risk per customer |
| Alerts | Cohort-decay and retention-regression alerts, plus subscription churn alerts |
| Klaviyo flow and campaign performance, including which flows drove orders | |
| How you ask | In plain English in chat, or on Numbers › Customers |
| What it changes | Nothing. Luca reads Shopify and Klaviyo and writes to neither |
Where it fits
What it's for
Customer retention analysis answers one question: do the customers you paid for come back? Luca shows whether customers return, which cohorts and products keep them, and where retention is slipping. You then know which first purchases to push and which customers to win back.
How it helps
- Cohorts you can compare. Each month's new customers are tracked at the same ages, so you compare like with like.
- First products that matter. Repeat rate by first product shows which items start a habit.
- Early warning on lapses. Days since last order, set against days between orders, shows who is drifting.
- Value, not just counts. Historical lifetime value by cohort shows what a returning customer is worth.
- Value by channel. Lifetime value by acquisition channel shows which channels bring customers who stay.
What happens without it
Without retention analysis, growth looks healthy while each new customer is worth less. Ad spend keeps buying first orders that never repeat. By the time revenue stalls, the cohorts behind it have been weak for months.
Why buyers care
Retention leads care every month, when they decide which flows and offers to run. Founders care when acquisition costs rise and payback stretches. Finance leads care when they need to know what a customer is really worth.
The Luca AI approach to customer retention analysis
Meet the retention lead at a direct-to-consumer baby-products brand on Shopify, with email and SMS in Klaviyo. The range runs from wipes and nappy balm to sleepsuits and a newborn starter bundle. Her founder has asked which first purchases turn into loyal parents.
Her current answer comes from Klaviyo's flow reports and a Shopify export. She builds a cohort grid by hand, which can take most of a week. Grouping by first product is harder still, so she tends to guess. Babies also outgrow products, which muddies the picture.
The answer sits in the order history. Every customer has a first order, a first product and a date. Grouped the right way, those orders show which starts lead somewhere. What she lacks is a grid that updates itself as new orders arrive.
Luca reads her full Shopify history and Klaviyo's flow and campaign revenue. It calculates monthly cohort retention from month 1 to month 35, repeat-purchase rate by cohort and by first product, and days since last order. Luca also names the products that don't drive repeat purchases. She opens the Customers tab and asks Luca follow-up questions in plain English.
Her founder can read one thing straight off the grid: whether each new month's customers return faster or slower than the last. How that compares with other analytics tools is covered in How Luca AI compares for customer retention analysis, below.
What a retention analysis in Luca shows you
A retention analysis in Luca has two parts. The Customers tab on your Numbers dashboard gives the standing view, and chat answers the questions it raises.
What you see on the Customers tab
On Numbers › Customers, you see cohort retention by first-order month, with each cohort's size and value so far. A table above it compares new and returning customers over the last 30 days. Your Numbers dashboard is built for your brand by the Luca team and refreshed every morning.
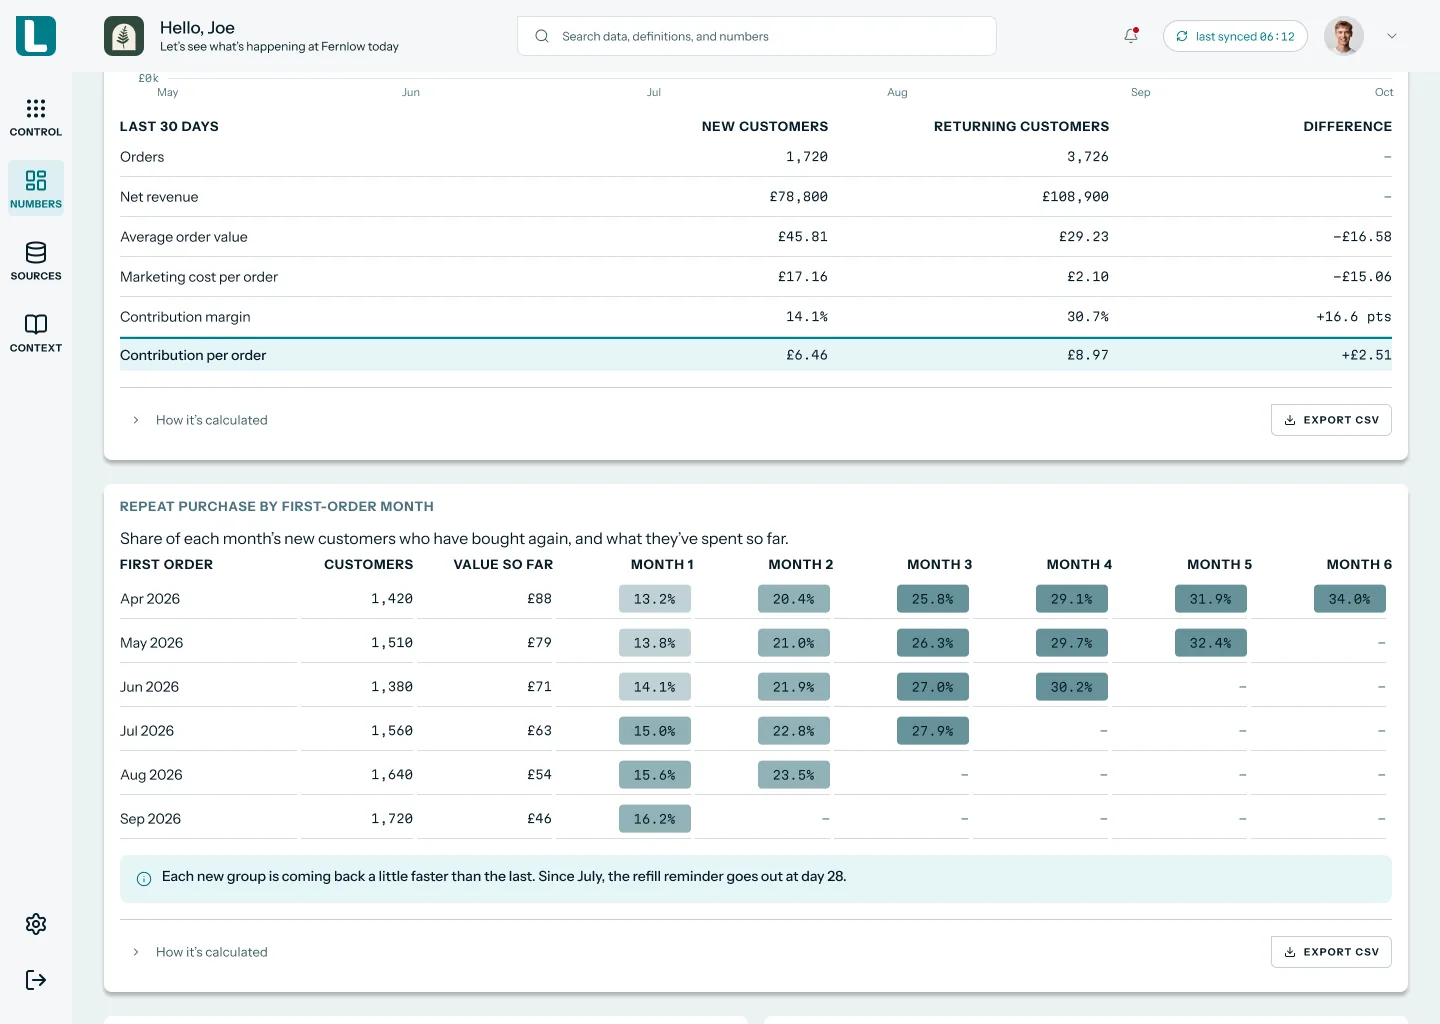 Illustrative example · demo brand
Cohort retention for Fernlow, a demo brand. All figures are sample data, and the refill reminder in the note is the demo brand's own email flow, not something Luca sends.
What Luca calculates for retention
For every brand with Shopify connected, Luca calculates monthly cohort retention from month 1 to month 35 and the repeat-purchase rate. It also tracks repeat units, new against returning customers, and cohort lifetime revenue and transactions. On value, it adds historical lifetime value by acquisition cohort, average order value on first and later orders, days between orders and days since last order.
Try asking Luca:
"Which products don't drive repeat purchases, and how many first orders did each one start in the last six months?"
New and returning customers
New and returning customers behave like two different businesses. New customers usually carry the ad cost, while returning ones often buy smaller baskets at better margins. Luca shows new against returning customer economics every week, with contribution margin per order for each group. Luca's guide to ecommerce customer lifetime value covers how to value each group.
Segments and predicted value
Luca groups customers into RFM-style segments, by how recently, how often and how much they buy. It predicts lifetime value and churn risk per customer. So each segment shows what it is expected to spend next and how likely it is to lapse. Luca also tracks active against lapsed customers, for subscribers and one-off buyers.
Lifetime value by acquisition channel
Luca shows LTV by acquisition channel: where customers first found you, and what they are worth against what they cost. CAC by channel and by cohort, and LTV to CAC with payback, sit in the same place. A channel with cheap first orders can still bring customers who never return.
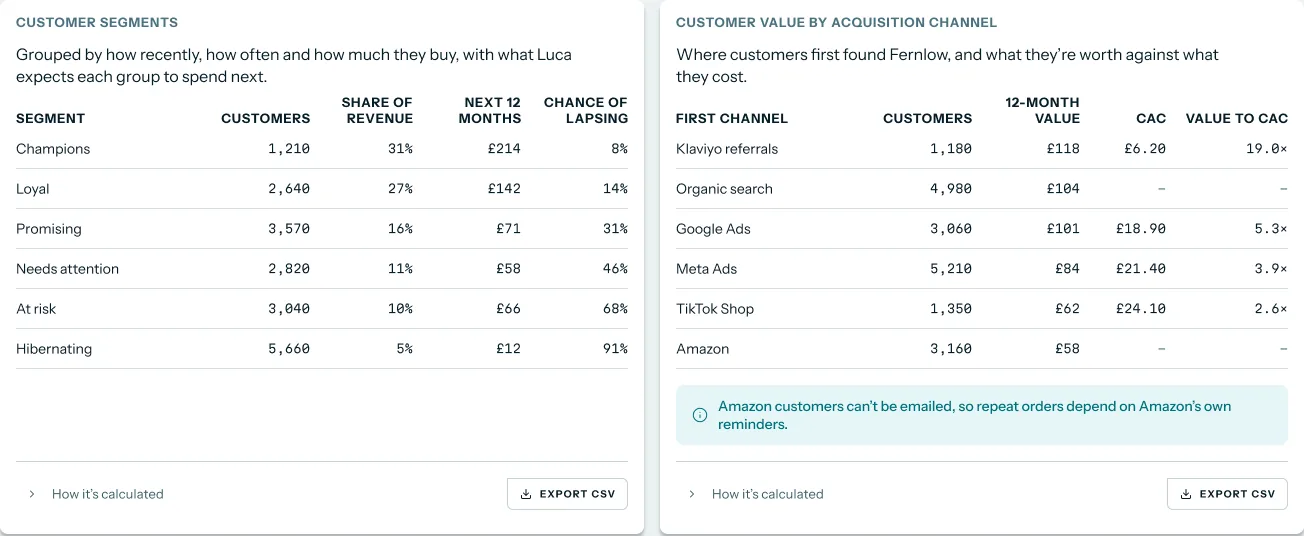 Illustrative example · demo brand
Segments and value by channel for Fernlow, a demo brand. All figures are sample data; they show which segments to win back and which channels bring valuable customers.
"Which acquisition channel brings customers with the highest 12-month value against what they cost to win?"
Cohort-decay alerts
Luca sends cohort-decay and retention-regression alerts when retention slips. A new cohort returning more slowly than the ones before it is the classic sign. Subscription brands also get subscription churn alerts. Each person chooses where alerts reach them: Slack, email or the app.
How customer retention analysis works
Every retention report rests on a few ideas. Knowing them helps you read any number you are shown, including Luca's. Shopify defines customer retention as bringing back first-time customers to make repeat purchases.
Cohort analysis
A cohort is every customer whose first order fell in the same month. A cohort grid follows each one month by month, showing the share who have bought again. Reading down a column compares cohorts at the same age. Reading along a row shows how one cohort keeps buying.
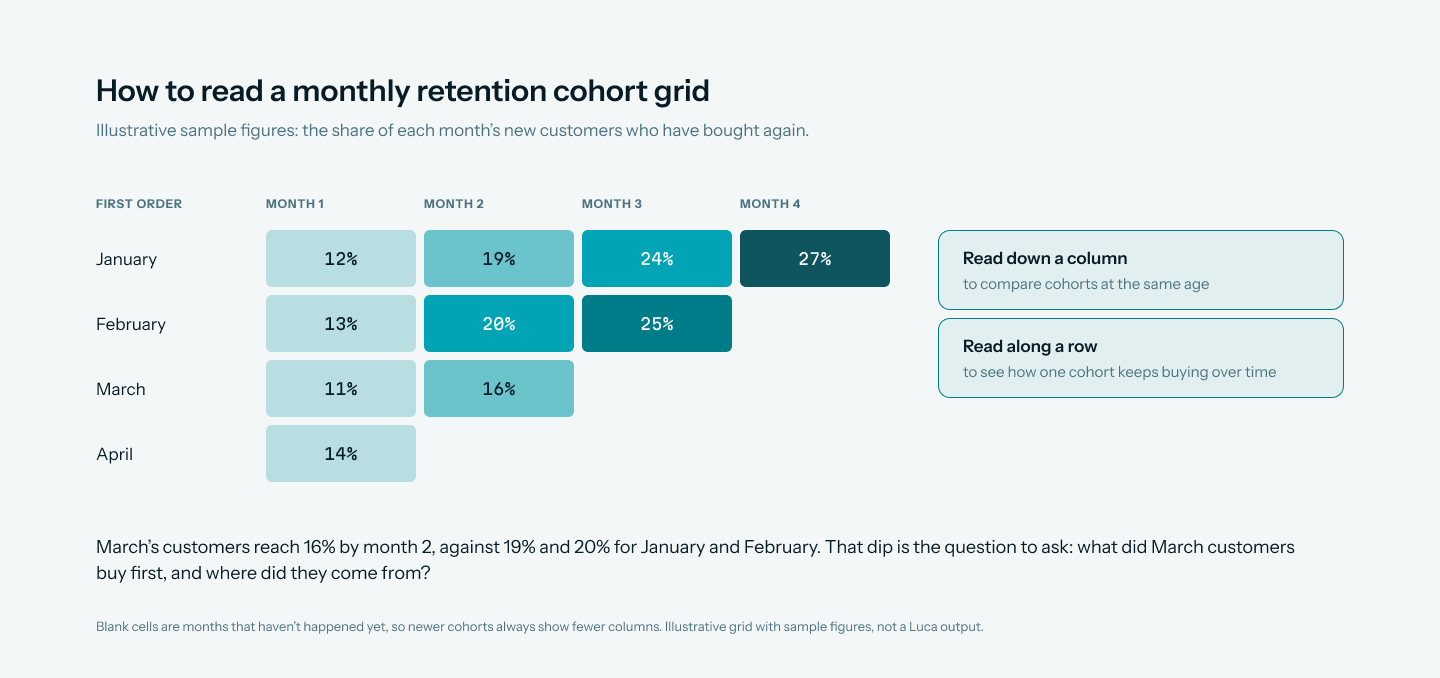
An illustrative cohort grid with sample figures, not a Luca output. It shows why you compare cohorts at the same age, and how one weak month stands out.
Repeat-purchase rate
The repeat customer rate is the share of customers who have bought more than once. Shopify's formula is customers who purchased more than once divided by unique customers. It depends heavily on the window you choose, so a 90-day rate and a one-year rate tell different stories.
Time between orders and lapse
Most ecommerce brands have no cancel button, so customers don't leave; they simply stop buying. Days between orders tells you a customer's normal rhythm. Days since last order tells you how far they have drifted from it. A parent who buys wipes every 30 days and hasn't ordered in 70 is likely lapsing.
First-product analysis
Grouping customers by their first product shows which items start a buying habit. Consumables such as wipes tend to bring buyers back. As Shopify's guide puts it, some products don't lend themselves to repeat purchases. For a baby brand, a sleepsuit may be outgrown before it is reordered.
Customer lifetime value
A simple formula multiplies average order value by purchase frequency and customer lifespan. A stricter version multiplies by gross margin too. Shopify suggests you then compare margin-adjusted value with CAC for the same customer group. Our explainer on Shopify LTV compares the revenue and profit versions.
What Luca is confirmed to do
Luca calculates monthly cohort retention from month 1 to month 35, repeat-purchase rate by cohort and by first product, and the products that don't drive repeat purchases. It adds historical lifetime value by acquisition cohort, days between orders and days since last order. It predicts lifetime value and churn risk per customer, groups customers into RFM-style segments and shows LTV by acquisition channel. With Klaviyo connected, it also reads Klaviyo's own predicted values. Luca does not change your flows or lists.
Run a retention analysis by cohort and first product
You can run it two ways: ask in chat, or open the Customers tab. Most retention leads use both.
- Open Numbers, then Customers. Read the cohort grid down each column to spot a weak month.
- Ask why. Ask Luca what that cohort bought first and how it compares with the months around it.
- Check first products. Ask for the repeat-purchase rate by first product over 90 days.
- Find the drifters. Ask how many customers are past their usual days between orders.
- Check the segments. Read which RFM segments are at risk, and what each is expected to spend.
- Bring in email. Ask which Klaviyo flows earned revenue from returning customers last month.
- Take the result to the team. Download the answer's data as CSV or Excel.
Each answer comes with figures, a chart where useful and next steps, and each figure links to the table it came from. The page on answers that join Shopify, Klaviyo and your books shows how chat combines sources.
What first orders contain
The products bought together in a first order matter too. Luca's basket analysis shows products frequently bought together, with support, confidence and lift. A first basket of wipes plus balm may behave very differently from balm alone.
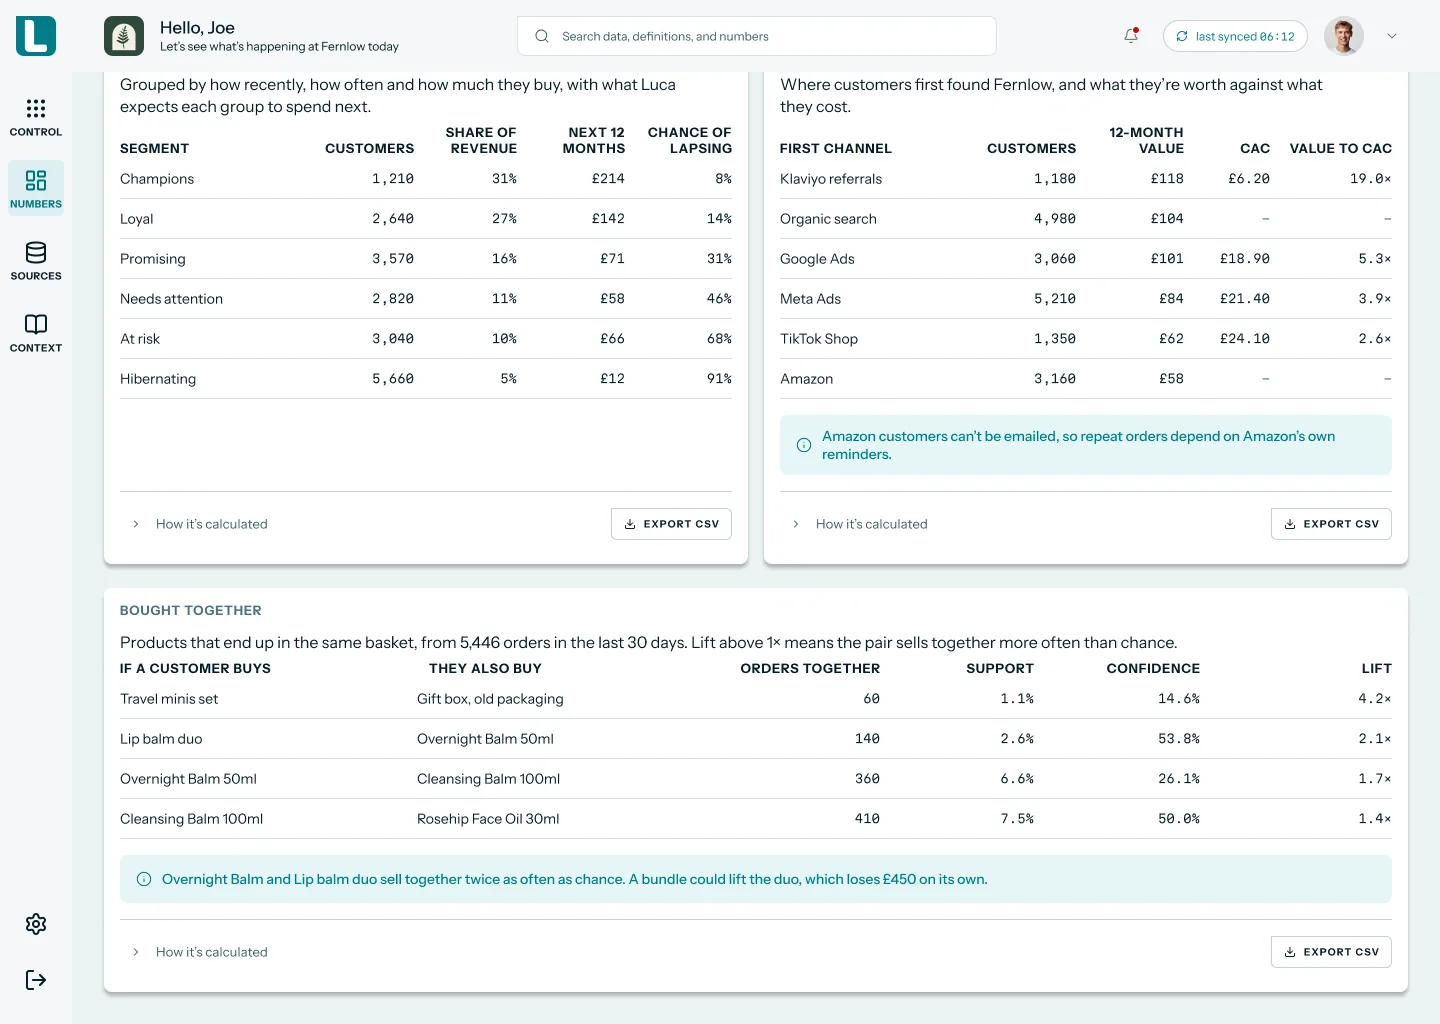 Illustrative example · demo brand
Bought-together pairs for Fernlow, a demo brand. The orders, support and lift figures are sample data; they show which pairs might make a stronger first basket.
Luca's guide to customer cohort analysis covers more ways to cut cohorts. Our customer retention strategies article turns what you find into flows and offers.
Black Friday cohorts in 2026
Black Friday falls on Friday 27 November 2026, and Cyber Monday on Monday 30 November. The peak brings a large, discount-led cohort. Over Black Friday Cyber Monday 2025, 81 million or more consumers bought from Shopify-powered brands, and sales reached 14.6 billion US dollars, up 27%. Shopify notes the figures are approximate and unaudited.
That cohort deserves its own check in the new year. Compare it with your October cohort at the same age before you judge the campaign. In the UK, the Office for National Statistics reports online spending up 7.4% on the year in July to September 2026, so the peak cohort may be larger than last year's.
Retention also has a budget problem. The 2026 CMO Survey found acquisition spending is 26% higher than retention spending, even though retention outperforms acquisition.
How customer retention is measured
There are four standard measures, and each has a weak spot.
- Customer retention rate. Shopify's formula takes customers at the end, minus new customers, divided by customers at the start. It mixes old and new customers in one figure, so it hides a weak cohort.
- Repeat customer rate. Simple and widely used. Its weak spot is the window: a short window understates products with long buying cycles.
- Churn rate. Lost customers divided by customers at the start. It fits subscriptions well, but a one-off buyer has no clear moment of loss.
- Cohort retention. The most honest view, because each group is measured at the same age. Its weak spot is that new cohorts show few months, so trends take time.
Shopify's own advice is to compare cohorts over equal periods, so older groups don't look better just because they have had longer to buy. Luca's cohort grid follows that rule by design: each column is a month since first order.
How to run a cohort retention analysis by hand
You can do this in a spreadsheet, and the steps are worth knowing even if a tool does them for you.
The manual method
- Export orders. Download every order with customer ID, date, products and order value from Shopify.
- Find each first order. For every customer, mark their first order date and first product.
- Group into cohorts. Group customers by the month of their first order.
- Count repeat buyers by age. For each cohort, count who has ordered again by month 1, 2, 3 and onwards.
- Turn counts into rates. Divide each count by the cohort's size.
- Repeat by first product. Group again by first product, and work out each group's 90-day repeat rate.
- Add value. Sum revenue per customer, and multiply by gross margin for a margin-adjusted view.
- Compare with CAC. Set margin-adjusted value against what it cost to win each customer.
The same job in Luca
In Luca, the grouping and counting are done for you each night. Luca reads your full Shopify history and calculates cohort retention, repeat-purchase rate by cohort and first product, and historical lifetime value by cohort. Blended CAC, which is total marketing spend divided by new customers, sits in the same place. You can ask for any ratio between these figures, such as LTV to CAC, directly in chat. Luca also shows LTV to CAC with payback, and LTV by acquisition channel, as standing views.
"What is the 90-day repeat-purchase rate for customers whose first order was the newborn starter bundle, compared with wipes?"
A worked example: which first products pay back
This illustrative calculation follows the manual method for a demo baby-products brand. The figures are sample data in pounds sterling, rounded, and are not a Luca output. Gross margin is 60%, and blended CAC is 25 pounds.
| First product | New customers | Bought again within 90 days | 90-day repeat rate | Revenue per customer in 6 months (GBP) | Margin-adjusted value (GBP) | Against CAC of 25 |
|---|---|---|---|---|---|---|
| Fragrance-free wipes | 800 | 328 | 328 ÷ 800 = 41% | 2.4 orders × 22 = 52.80 | 52.80 × 0.6 = 31.70 | Pays back |
| Nappy balm | 600 | 198 | 198 ÷ 600 = 33% | 1.9 orders × 18 = 34.20 | 34.20 × 0.6 = 20.50 | Not yet |
| Newborn starter bundle | 400 | 104 | 104 ÷ 400 = 26% | 1.6 orders × 55 = 88.00 | 88.00 × 0.6 = 52.80 | Pays back |
| Cotton sleepsuit | 500 | 55 | 55 ÷ 500 = 11% | 1.2 orders × 30 = 36.00 | 36.00 × 0.6 = 21.60 | Not yet |
Repeat rate alone would rank wipes first and the bundle third. On value, the bundle wins, because its first basket is large. The sleepsuit starts few habits, so customers who start there need a different next step, such as a size-up email.
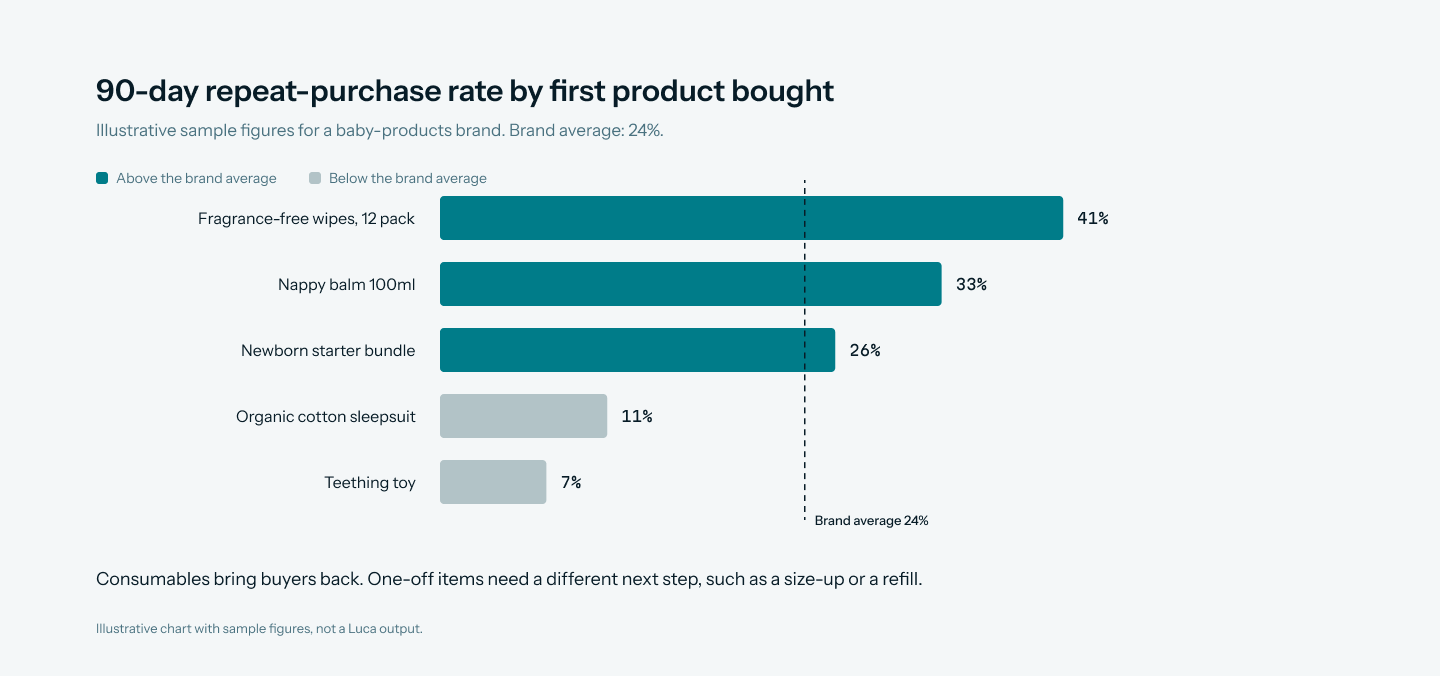
An illustrative chart with sample figures, not a Luca output. It shows how first products split into habit starters and one-off buys around the brand average.
Set up retention analysis in Luca
You can set up Luca without a developer, and every connection is read-only by design.
- Connect Shopify. Open Sources and click Connect on the Shopify card. Luca imports your full order history, which the cohort grid needs.
- Ask the team for Klaviyo. The Klaviyo card shows Get in touch, and the Luca team sets it up, read-only.
- Add Recharge if you sell subscriptions. The Luca team sets it up, and Luca adds churn and retention by plan.
- Add Amazon if you sell there. Amazon Seller Central connects self-serve and adds customer cohorts for marketplace buyers.
- Choose where alerts go. Pick Slack, email or the app for cohort-decay and churn alerts.
- Open Numbers the next morning. After the overnight refresh, the Customers tab and chat have your cohorts.
Plans and what each includes are on the Luca AI pricing page.
How retention analysis works with the rest of Luca
Shopify
Shopify is the record of every first and repeat order. Shopify data enables new against returning customers, monthly cohorts to three years, historical lifetime value and bought-together analysis.
Klaviyo
Klaviyo is set up by the Luca team, read-only. Luca reads campaigns, flows and the revenue attributed to each, plus Klaviyo's own predicted customer value and churn risk. That shows which flows earn money from returning customers. Luca combines Recharge, Klaviyo and order history to show which flows and offers keep customers, and what those customers are worth over time. Luca never edits a flow or list.
Ads and acquisition cost
Retention only pays if a customer is worth more than they cost to win. Set cohort value and LTV by acquisition channel against CAC, and read ROAS by channel and campaign to see which channels bring customers who stay.
The morning view and chat
Retention figures sit beside sales, ads and cash in the morning business overview. Chat can combine ad spend, store orders and your accounting ledger in one reply. Luca keeps a persistent memory across conversations, shared by everyone in your organisation. Read how Luca works as an AI analyst.
Who runs retention analysis, and how
Growth and retention leads
A retention lead reads the cohort grid monthly and the first-product view before planning flows. The products that don't drive repeat purchases become the target for a better follow-up. Our guide to customer churn analysis covers what to do with lapsing buyers.
Founders and CEOs
A founder checks whether newer cohorts return faster or slower than older ones. A weakening grid is an early sign that growth is being bought rather than earned.
Subscription brands
A subscription brand adds Recharge, so active subscribers, monthly and 90-day churn and retention by plan sit beside one-off buyers. The two groups often need different offers. Luca compares subscriber and one-time margin, analyses skips and pauses booked ahead, and reports churn reasons with customer comments.
How Luca AI compares for customer retention analysis
Luca tracks monthly cohort retention by first-order month and names the products that don't drive repeat purchases. You ask about both in plain English, and the same answer can bring in your Xero or QuickBooks ledger. Luca AI is the only platform in this table that does all four.
Customer retention analysis features, from each platform's public documentation:
| Platform | Luca AI | Lifetimely by AMP | Triple Whale | Shopify Sidekick | Daasity |
|---|---|---|---|---|---|
| Monthly cohort retention by first-order month | Yes | Yes (Cohorts by first order) | Yes (LTV Cohorts view) | Yes (Customer cohort analysis report) | Partly (cohorts in a retention playbook) |
| Products that don't bring buyers back | Yes | Yes (Repurchase Rate Breakdown by product) | Partly (SQL example for second product) | Not in docs | Not in docs |
| Plain-English questions on retention | Yes | Partly (questions about Klaviyo flows) | Yes (plain-English prompts) | Yes (answers from your store data) | Yes (AI Analyst in plain English) |
| Xero or QuickBooks in the same answer | Yes | Partly (QuickBooks cost and expense sync) | Not in docs | Not in docs | Not in docs |
Yes: documented and built in. Partly: documented with a limit, shown in brackets. Not in docs: not found in the vendor's public documentation.
Why Luca AI is the stronger choice for customer retention analysis
- Retention beside your books. Luca can combine store orders, ad spend and your accounting ledger in one reply. Lifetimely's QuickBooks connection syncs and categorises cost and expense data. See Luca AI and other Lifetimely alternatives.
- Weak first products, named for you. Luca calculates which products don't drive repeat purchases as a standard figure. Triple Whale offers an SQL example for the most common second product that you run yourself. See Luca AI and other Triple Whale alternatives.
- Cohorts built in, not a playbook. Luca tracks monthly cohort retention from month 1 to month 35 for every brand with Shopify connected. Daasity describes a playbook that tracks cohorts, repurchase and RFM segments. See Luca AI and other Daasity alternatives.
Competitor details checked against each vendor's public documentation on 29 October 2026. Features and plans change, so confirm with the vendor before you decide.
Limits and things to know
- Klaviyo through the team. Klaviyo is set up by the Luca team, not self-serve.
- Predictions are forecasts. Predicted lifetime value and churn risk look forward, so read them beside historical value.
- Segments are for analysis. Luca shows each segment and its value; any email to a segment goes from your own Klaviyo.
- Young cohorts are short. A cohort only shows the months it has lived, so judge recent ones at the same age as older ones.
- Read-only. Luca informs your retention plans. It never sends an email, edits a flow or changes a list.
Common questions
What is customer retention analysis?
It is the work of checking whether customers come back after their first order. You track each month's new customers over time, compare repeat rates and find the products and cohorts that keep buyers.
What is a cohort retention analysis?
It groups customers by the month of their first order and follows each group month by month. Comparing cohorts at the same age shows whether retention is improving or slipping.
How far does Luca's cohort grid go?
Monthly cohort retention runs from month 1 to month 35, which is nearly three years after each customer's first order.
Can Luca show repeat rate by first product?
Yes. Luca calculates the repeat-purchase rate by cohort and by first product bought, and lists the products that don't drive repeat purchases.
How do I spot customers who are lapsing?
Compare days since last order with the customer's usual days between orders. Luca calculates both, so you can ask how many customers are well past their normal rhythm.
What is a good repeat-purchase rate?
It depends on what you sell. Consumables such as wipes repeat far more often than durable items. Compare your own cohorts and first products over time rather than chasing one benchmark.
What is the difference between retention rate and repeat rate?
Retention rate counts customers kept over a period, net of new ones. Repeat rate counts customers who have bought more than once. Cohort retention is the clearest of the three.
Does Luca use my Klaviyo data?
Yes. The Luca team sets it up, and Luca reads Klaviyo flow and campaign performance, including which flows drove orders. It writes nothing back.
Will Luca send emails or change my flows?
No. Every connector is read-only. Luca reads Shopify and Klaviyo and writes to neither, so every message stays your decision.
Can I compare customer value with acquisition cost?
Yes. Luca shows LTV to CAC and payback, CAC by channel and by cohort, and LTV by acquisition channel. You can also ask for any ratio in chat.
Can Luca predict which customers will lapse?
Yes. Luca predicts lifetime value and churn risk per customer, and groups customers into RFM-style segments. Cohort-decay alerts warn you when a new cohort returns more slowly.
Does it work for subscription brands?
Yes. With Recharge set up by the Luca team, Luca adds active subscribers, monthly and 90-day churn, skip rates and retention by plan.
How often do the retention figures update?
Every source refreshes automatically once a day, overnight. Each morning's cohort grid includes yesterday's orders.
Does it include Amazon customers?
Amazon Seller Central connects self-serve and adds customer cohorts for marketplace buyers. Shopify remains the main record for direct-to-consumer retention.
Updated 29 October 2026: added how customer retention analysis works, how retention is measured, the manual cohort method with a worked example, the 2026 peak dates and further reading. Later the same day: added predicted lifetime value and churn risk, RFM segments, LTV by acquisition channel, cohort-decay and churn alerts, new against returning economics and retention economics across Recharge and Klaviyo.