
E-commerce sales analysis answers the question behind a revenue total: which products, sales channels and customers moved it, and in which period. A total that rose or fell tells you nothing about what to back next quarter. Luca AI is an e-commerce analytics platform with an AI analyst that breaks your net revenue and orders down by product, sales channel, new or returning customer and period, then charts the result in a chat. This page covers ecommerce sales from Shopify, Amazon and wholesale, not B2B sales-team or pipeline analysis.
At a glance
| Question | Answer |
|---|---|
| What it does | Breaks net revenue and orders down by product, sales channel, new or returning customer and period |
| Sales channels | Shopify, Amazon, and wholesale, trade or physical-store sales added through a custom source that Luca's team builds |
| How you ask | In plain English, with follow-up questions; ask for a chart and Luca draws it from your data |
| Periods | Any date range set against a comparison period |
| Revenue basis | Net revenue, with gross sales, discounts, returns, shipping and tax kept as separate figures |
| Explaining a change | Ask why a number moved and Luca investigates what drove the change |
| What it is not | B2B sales-team or pipeline analysis, and not ad attribution |
| Access | Read-only: Luca never changes your store, ads, email or books |
So if revenue rose last quarter, the answer to "what produced it?" is four splits of the same net revenue figure: by sales channel, by product, by new or returning customer and by discount. The rest of this page shows how to run each one, check it and plan from it.
Where it fits
What it's for
E-commerce sales analysis is for the moment a revenue total moves and you have to decide what to do about it. It turns one number into the few things that changed underneath it, so next quarter's plan backs the right products and sales channels.
How it helps
- Finds the real driver. A rise from one hero product looks very different from a rise spread across the range.
- Separates bought growth from earned growth. Discounts stay visible, so a sale-driven quarter isn't mistaken for demand.
- Shows who bought. New and returning customers tell you whether you grew your base or sold more to the same people.
- Puts every sales channel on one definition. Shopify, Amazon and wholesale all report net revenue the same way.
What happens without it
You plan next quarter from the total. If the rise came from a one-off wholesale order or a sitewide discount, the targets you set will be too high. Stock, staff and marketing budgets then follow a number that won't repeat.
Why buyers care
Founders care most at quarter end, when the plan for the next three months is set. Finance leads care when a board or investor asks what drove growth. Both need the answer in hours, from figures that match the books.
The Luca AI approach to sales analysis
Take the founder of a Shopify skincare brand whose revenue rose 18% last quarter. She also sells on Amazon, ships to a handful of wholesale stockists and ran a sitewide discount for two weeks. One serum is her hero product. Before she plans next quarter, she needs to know which of those four things produced the rise.
The usual route is a pile of exports: the store's sales report, an Amazon download, a wholesale spreadsheet and a list of discount codes. Someone joins them over an evening or two, and the files rarely agree on what revenue means. By the time the answer arrives, the next quarter has often started.
The questions themselves are simple. Which channel grew, which product, which customers, and how much of it was discount? Once every channel's orders share one definition of net revenue, each question becomes a filter and a comparison. It stops being a project.
Luca AI reads her orders from Shopify and Amazon, and brings wholesale sales in through a custom source. It reports net revenue on every connected sales channel, with discounts and returns kept as separate figures. She asks in plain English, follows up on what she sees and asks for a chart. When Luca can't see the data a question needs, it says so instead of guessing.
One fact is easy to check. Luca's answers cover revenue by sales channel and new and returning customers, and they can sit beside your Xero or QuickBooks figures. How that compares with Shopify's own reports, Lifetimely, Triple Whale and Saras Analytics is covered in How Luca AI compares for e-commerce sales analysis, below.
What a sales analysis in Luca shows you
A sales analysis in Luca is a set of splits on one figure, net revenue. You can see them on the Profit tab or ask for them in chat. Either way, the figures come from the same connected sources.
What you see on the Profit tab
Open Numbers › Profit. The tab is headed What each product, channel and month actually made. A filter bar across the top sets the brand, store, country, date range and comparison period, so every card on the tab shows this period against the one you chose.
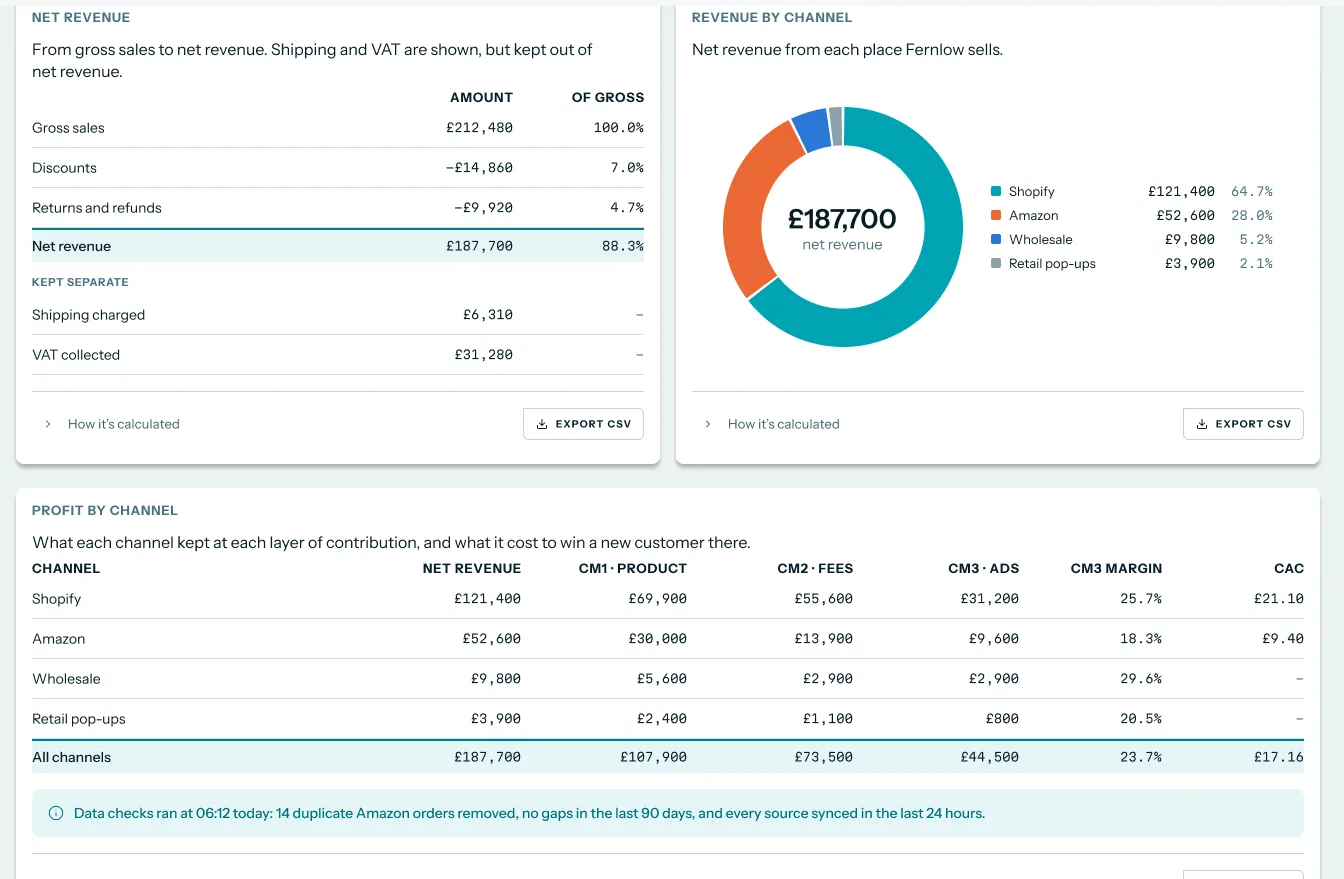
The Net revenue card walks from gross sales through discounts and returns to net revenue. Shipping and VAT sit to one side, so they never inflate the sales figure. Next to it, Revenue by channel shows each sales channel's share of the total.
 Illustrative example · demo brand
The net revenue walk shows how much of a quarter's sales went back out as discounts and returns, before you read the channel split. The figures are sample data for a demo brand.
Revenue by product
Luca breaks revenue and profit down by product, variant and SKU, including Amazon SKU economics after marketplace fees. Return and refund rates sit at product level too, so a hero product with a high return rate shows up before you order more of it. You can also ask which products are bought together, with the standard support, confidence and lift measures.
Revenue by sales channel
On this page, "channel" always means a sales channel: where the order was placed. Shopify, Amazon and wholesale are sales channels. Meta and Google are ad platforms, and they belong in an ad spend analysis instead.
Trade, wholesale and physical-store sales can be added through a custom source, which Luca's team builds on request. Luca reports net revenue on every connected sales channel, so a wholesale order and a Shopify order are counted the same way.
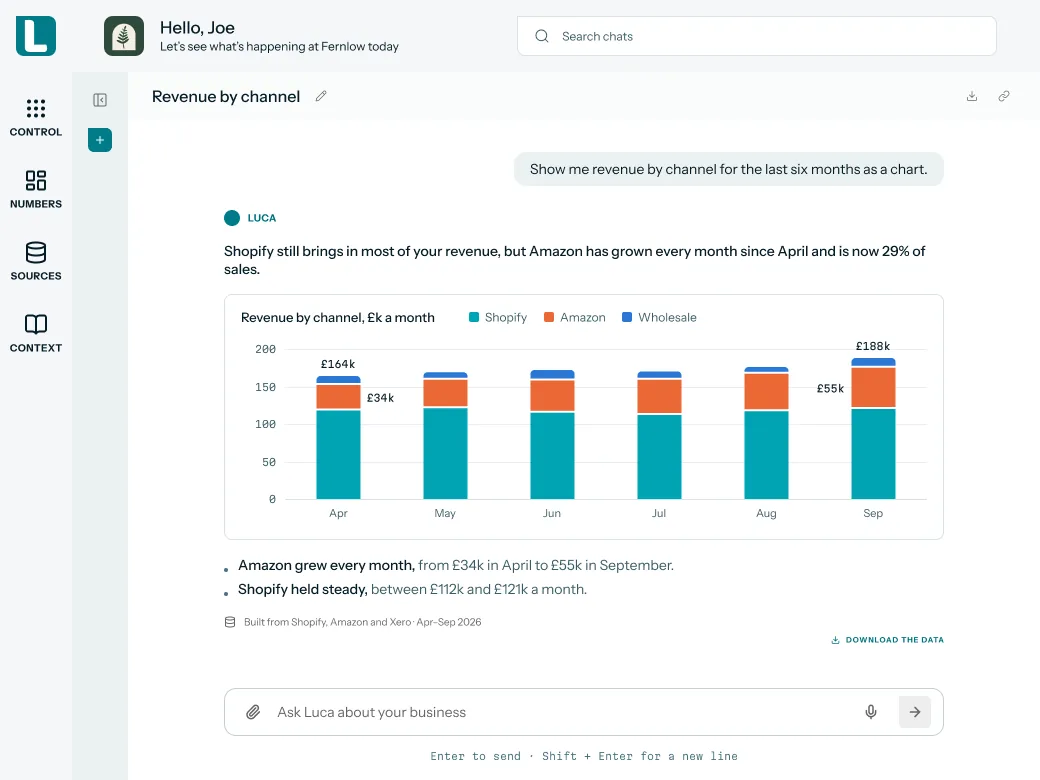 Illustrative example · demo brand
Asking for a chart is the quickest way to see whether one sales channel carried the quarter or all of them grew. The figures are sample data for a demo brand.
New and returning customers
Luca shows new and returning customers every week, along with the economics of each group. That split tells you whether growth came from people buying for the first time or from your existing base buying more. To follow those new buyers over the months that come next, use a customer retention analysis.
Revenue by period
Every split runs against a period. Set a date range and a comparison period in the filter bar, or ask in chat: "Compare net revenue this quarter with last quarter, by channel." Weekly, monthly and quarterly views all use the same net revenue definition.
What a sales analysis is not
It isn't B2B sales-team analysis. Luca doesn't track a sales pipeline, reps, quotas or deal stages. It also doesn't tell you which ad, creative or campaign drove a given order. To set ad spend and platform-reported results beside store revenue, run a ROAS analysis.
How a change in revenue gets explained
There are six common ways to explain why revenue moved. Each catches something and misses something, which is why a good sales analysis uses several of them in order.
Period-over-period comparison
The starting point is this period against the last one, or against the same period a year ago. A sales growth measure compares historical data with current sales to show how much sales grew or fell. It catches the size and direction of the change. It misses the reason, and a short period can be distorted by one big week.
Orders and average order value
Revenue is orders multiplied by average order value. Average order value is total revenue divided by the number of orders in the period. This split catches whether you sold to more people or sold bigger baskets. It misses which products or channels did it.
Product mix
A product split shows whether revenue is spread across the range or carried by one product while the rest lag behind. It catches a hero product, and a product that quietly fell away. It misses who bought, and whether a discount pulled the sales forward.
Sales channel mix
A sales channel split shows whether Shopify, Amazon or wholesale grew. It catches a wholesale quarter that rests on one or two large orders, and sales moving from your store to Amazon. It misses the reason inside each channel. Data from each platform also tends to disagree, which ecommerce omnichannel analytics has to settle before any split is fair.
New and returning customers
Acquisition brings in new customers, while retention earns more from the ones you already reached. This split catches whether a rise came from first-time buyers or repeat buyers. It misses whether those new buyers will come back, which only shows over the next few months in your retention cohorts.
Gross to net: discounts and returns
Net sales are gross revenue minus returns and discounts. Splitting the walk from gross to net catches a quarter that grew because prices were cut. It misses margin: a discounted sale can still be profitable or not, which is a question for contribution margin.
What Luca is confirmed to do
Luca reports net revenue on every connected sales channel, with discounts and returns kept separate. It splits revenue by product, variant and SKU, shows new and returning customers every week, and sets any date range against a comparison period. It reports discount depth, discount-code usage and the profit impact of each promotion. Asked why a number moved, it investigates what drove the change.
Run a sales analysis on last quarter
Work from the top down. Start with the total, then split by the thing that changed most, and keep going until each part of the rise has a name.
- Ask for the total: "How did net revenue this quarter compare with last quarter?"
- Split it by sales channel and ask for a chart, so you can see which channel carried the change.
- Take the channel that grew most and split it by product.
- Split the same channel by new and returning customers.
- Ask about discounts: "What was our discount depth this quarter against last, and which codes were used most?"
- Ask "Why did net revenue move this quarter?" and check Luca's answer against the splits you already have.
- Download the data behind the answer as CSV or Excel if you want to keep a copy with your plan.
Luca keeps the thread of the conversation, so each step can be a short follow-up. When a question is ambiguous, it asks what you meant before answering.
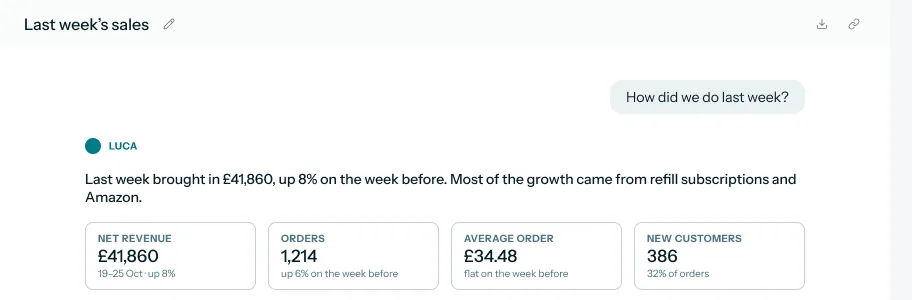 Illustrative example · demo brand
A plain-English question returns net revenue, orders, average order and new customers together, which are the first four splits of any sales analysis. The figures are sample data for a demo brand.
What to watch for as you split
Two splits can point at the same sale. A new customer who bought the hero serum during the sitewide discount counts in the product split, the customer split and the discount split. That's fine, as long as you add up shares within one split only.
A wholesale rise deserves a second look. Ask how many orders it came from. One large stockist order can lift a quarter without changing your baseline.
Take the answer into next quarter's plan
Once each part of the rise has a name, plan from the parts that will repeat. Feed them into your revenue forecast for next quarter's targets. If one product carried the quarter, check its stock with an inventory demand forecast before you plan another push.
How to check a sales analysis is right
Two measures matter here: each driver's share of the change, and the net revenue figure it is built on. Both are easy to get wrong.
Share of the change
Divide each driver's change in revenue by the total change. If revenue rose by 90,000 and wholesale rose by 30,000, wholesale explains a third of the rise. The weak spot is overlap: shares from different splits don't add up to 100%, because one order sits in several splits. Add shares only within one split, such as sales channels.
Net revenue, not gross
Compare periods on net revenue. Gross sales flatter a quarter with heavy discounts, and returns can land after the period closes, so a strong month can shrink later. The weak spot is timing: check the same period again a few weeks later to see whether returns changed the picture.
Where Luca shows them
Luca keeps gross sales, discounts, returns, shipping and tax as separate figures, so you can read net revenue and the walk to it together. Every figure links to the data table it came from. Missing values are treated as unknown rather than zero, and Luca says when it doesn't have the data or the confidence to answer, rather than guessing.
How to break down a rise in revenue
The manual method
- Export orders for both periods from each sales channel: Shopify, Amazon and your wholesale records.
- Convert each export to the same net revenue basis: gross sales minus discounts and returns, with shipping and tax taken out.
- Total each channel for both periods and work out each channel's change and share of the total change.
- For the channel that grew most, total net revenue by product for both periods.
- Tag each order as new or returning by checking whether the customer ordered before, then total both groups.
- Total discounts for both periods and work out discount depth as discounts divided by gross sales.
- Write up which drivers will repeat next quarter and which won't. Teams that do this every week often keep it in a standing ecommerce reporting pack.
The same job in Luca
Steps 1 and 2 are done for you: Luca imports orders, refunds and fees from Shopify and Amazon, and reports net revenue on the same basis for every connected channel. Steps 3 to 6 are questions in chat, each answered with figures and a chart if you ask for one. Step 7 stays with you, because the decision about next quarter is yours.
A worked example: what produced an 18% rise
This is an illustrative calculation with sample figures, not a Luca output. A Shopify skincare brand's net revenue rose by 90,000 pounds in a quarter, from a base of 500,000. That is a rise of 18% (90,000 ÷ 500,000).
First, split the rise by sales channel:
| Sales channel | Last quarter | This quarter | Change | Share of the £90,000 rise |
|---|---|---|---|---|
| Shopify | £380,000 | £430,000 | +£50,000 | 50,000 ÷ 90,000 = 56% |
| Amazon | £90,000 | £100,000 | +£10,000 | 10,000 ÷ 90,000 = 11% |
| Wholesale | £30,000 | £60,000 | +£30,000 | 30,000 ÷ 90,000 = 33% |
| Total | £500,000 | £590,000 | +£90,000 | 100% |
Then split Shopify, the channel that grew most, three ways:
| Shopify split | Last quarter | This quarter | Change |
|---|---|---|---|
| Hero serum | £100,000 | £140,000 | +£40,000 |
| Rest of the range | £280,000 | £290,000 | +£10,000 |
| New customers | £120,000 | £160,000 | +£40,000 |
| Returning customers | £260,000 | £270,000 | +£10,000 |
| Gross sales | £410,000 | £500,000 | +£90,000 |
| Discounts | £20,000 (4.9% of gross) | £55,000 (11.0% of gross) | +£35,000 |
| Returns | £10,000 | £15,000 | +£5,000 |
| Net revenue (gross − discounts − returns) | £380,000 | £430,000 | +£50,000 |
The rise had two sources. A third came from wholesale, and most of the Shopify growth came from new customers buying the hero serum while discount depth more than doubled. Before planning next quarter, check how serum sales held up in the weeks after the discount ended, and ask how many wholesale orders made up the wholesale rise.
Set up sales analysis in Luca
- Connect Shopify with one-click OAuth. Luca imports orders, products, customers, inventory, refunds, payouts and fees. The set-up guide walks through it.
- Connect Amazon Seller Central by OAuth, one marketplace at a time, for orders, fees and settlements.
- Ask your Luca contact to add wholesale or trade sales through a custom source.
- Connect Xero or QuickBooks if you want sales and accounting figures in the same answer.
- Ask your first question in chat: "Compare net revenue this quarter with last quarter, by sales channel."
Every connection is read-only, which the page on read-only access explains in full.
How sales analysis works with the rest of Luca
Shopify and Amazon
Shopify brings orders, products, customers, refunds and fees. Amazon brings orders, fees, settlements and FBA inventory per marketplace, and Luca includes Amazon referral and FBA fees in SKU economics. Both feed the same net revenue figure.
Wholesale, trade and physical stores
Physical-store sales are not a standard connection. They come in only through a custom source that Luca's team builds on request, and trade and wholesale data joins the same way, so stockist orders sit beside your store and marketplace sales in every split.
Xero and QuickBooks
Xero and QuickBooks Online connect by OAuth. Luca can combine ad, sales and accounting data in one answer, which helps when a sales figure has to match the books. The guide to answers across sources shows how.
Chat, charts and exports
You ask in plain English across every connected source, ask for a chart, and download any answer's data as CSV or Excel. For the wider picture of what an AI agent for ecommerce handles in a week, start there.
Who runs sales analysis, and how
Founders and CEOs
A founder runs a sales analysis at quarter end, before setting the next plan. The four splits tell them which products and sales channels to back. They often follow it with a daily view of the whole business to watch the plan play out.
CFOs and finance leads
A finance lead uses it to explain growth to the board in figures that match the books. They read net revenue beside discounts and returns, then check margins against ecommerce profit margin benchmarks. The same definitions carry into their KPI reporting.
Growth and marketing leads
A growth lead uses the new and returning split to see whether acquisition is working, and the discount split to see what a promotion really cost. For ad spend against store revenue, they move on to a ROAS analysis.
Operations and inventory leads
An operations lead uses the product split to spot a product that is taking off. They then plan stock with a demand forecast for each product before it runs out.
How Luca AI compares for e-commerce sales analysis
Luca puts net revenue from Shopify, Amazon and wholesale on one definition, splits it by new and returning customers, and answers in plain English with charts. It can also set those figures beside your Xero or QuickBooks books in the same answer.
E-commerce sales analysis features, from each platform's public documentation:
| Platform | Luca AI | Shopify reports and Sidekick | Lifetimely | Triple Whale | Saras Analytics |
|---|---|---|---|---|---|
| Net revenue by sales channel | Yes | Yes (Net sales by channel report) | Partly (Shopify or Amazon store context) | Yes (revenue by platform and product) | Yes (sales grouped by channel) |
| New and returning customers | Yes | Yes (returning customers metric) | Yes (new and returning customer cohorts) | Yes (new and returning customer revenue) | Yes (new vs returning customer orders) |
| Plain-English questions | Yes | Yes (Sidekick investigates sales changes) | Partly (through Microsoft Copilot Studio) | Partly (Moby drafts SQL queries) | Partly (ask Claude through the iQ MCP) |
| Accounting ledger in the same answer | Yes | Not in docs | Partly (QuickBooks supplies selected costs) | Not in docs | Partly (QuickBooks v2 data pipeline) |
Yes: documented and built in. Partly: documented with a limit, shown in brackets. Not in docs: not found in the vendor's public documentation.
Why Luca AI is the stronger choice for e-commerce sales analysis
- Plain-English answers, not SQL. Triple Whale documents asking Moby for a starting point before writing SQL. Luca answers the question itself, with figures and a chart. More on the field is in Triple Whale alternatives.
- Every sales channel in one split. Lifetimely's Products and Orders reports run in a Shopify or Amazon store context. Luca reports net revenue on every connected sales channel, wholesale included, in one view. See Lifetimely alternatives.
- Sales and books together. Shopify's reports track returning customers inside the store. Luca sets Shopify, Amazon and wholesale sales beside Xero or QuickBooks in the same answer.
Competitor details checked against each vendor's public documentation on 7 November 2026. Features and plans change, so confirm with the vendor before you decide.
Limits and things to know
- Ecommerce sales only. Luca analyses store, marketplace and wholesale orders. It doesn't track a B2B sales pipeline, reps or deal stages.
- No attribution model. Luca compares ad spend and platform-reported results with store revenue. It never says which ad, creative or campaign drove a given order, sale or customer.
- Connected channels only. A sales channel that isn't connected isn't in the split. Walmart, TikTok Shop and eBay are not connected sources.
- Read-only. Luca never changes prices, discount codes or anything else in your store, ads, email or books. Every decision stays with you.
Common questions
What is sales analysis in ecommerce?
Ecommerce sales analysis breaks net revenue and orders down by product, sales channel, new or returning customer and period. It shows which of those moved the total, so you can plan from the parts that will repeat.
Is this B2B sales-team or pipeline analysis?
No. Luca analyses ecommerce orders from Shopify, Amazon and wholesale. It doesn't track a sales pipeline, reps, quotas or deal stages, so it isn't a tool for B2B sales-team analysis.
What does "channel" mean in a Luca sales analysis?
Channel means a sales channel: where an order was placed, such as Shopify, Amazon or wholesale. Ad platforms such as Meta and Google aren't sales channels in this analysis.
Can Luca tell me which ad or campaign drove a sale?
No. Luca has no attribution model. It compares ad spend and platform-reported results with store revenue, but it never says which ad, creative or campaign drove a given order or customer.
How do I compare this quarter with last quarter?
Set a date range and a comparison period in the filter bar on the Profit tab, or ask in chat: "Compare net revenue this quarter with last quarter, by sales channel." Both use the same net revenue figure.
Does Luca separate new and returning customers?
Yes. Luca shows new and returning customers every week, along with the economics of each group. That tells you whether growth came from first-time buyers or from your existing customers buying more.
Can I see sales by product and SKU?
Yes. Luca breaks revenue and profit down by product, variant and SKU, including Amazon SKU economics after marketplace fees. It also shows return and refund rates for each product.
How does Luca handle discounts in revenue?
Luca keeps discounts as a separate figure between gross sales and net revenue. It also reports discount depth, discount-code usage and the profit impact of each promotion, so a discount-led quarter is easy to spot.
Can wholesale sales sit beside Shopify and Amazon?
Yes. Trade and wholesale data joins through a custom source, and Luca reports net revenue on every connected sales channel. Ask your Luca contact to add the custom source for your stockist orders.
Can I get a sales analysis as a chart?
Yes. Ask for a chart in chat, for example "Show revenue by channel for the last six months as a chart", and Luca draws it from your connected data.
Can I export the numbers behind an answer?
Yes. You can download any answer's data as CSV or Excel. That is useful when you want to keep the figures with your quarterly plan.
What happens if a sales channel isn't connected?
Luca treats missing values as unknown rather than zero. If a question needs data from a channel that isn't connected, it says so instead of estimating from your other channels.
Can Luca explain why revenue moved?
Yes. Ask "Why did net revenue move this quarter?" and Luca investigates what drove the change. Check its answer against your sales channel, product and customer splits before you plan from it.
Does running a sales analysis change anything in my store?
No. Luca is read-only: it never changes your store, ads, email or books. The page on how read-only access works explains what Luca can and can't see.
Updated 7 November 2026: first version, with the four sales splits, how a change in revenue gets explained, how to check a sales analysis, the manual method, a worked example and the comparison with other tools.