
Demand forecasting software should tell you two things for every product: how many units you will sell, and when you will run out. Without it, sizing the next orders with your supplier means a spreadsheet of run rates that rarely allows for Black Friday. Luca AI forecasts orders and units for every SKU from your Shopify sales, allows for seasonality and holidays, and shows the days of stock you have left. It checks each forecast against actual sales every night, and Luca's team switches forecasting on per client.
At a glance
| What it is | A forecast of orders and units for every SKU, with days of stock remaining |
|---|---|
| What it's built from | Your full Shopify sales history, plus Amazon FBA stock if you sell there |
| What it allows for | Seasonality and holidays such as Black Friday |
| What you can read | Stock cover, forecast units per day, run-out dates and order-by dates |
| How it's checked | Against your actual sales every night, then corrected |
| Where you see it | In chat, or on Numbers › Stock |
| Warnings | Stock-out alerts sent to Slack, email or the app |
| Who places the order | You do. Luca sets reorder points and order-by dates, and you choose the quantity |
| Who switches it on | Luca's team, per client. It is not tied to a plan |
| What it never does | Change your store or contact your supplier. Luca only reads your data |
What the demand forecast is
The demand forecast is Luca's estimate of how many orders and units each SKU will sell in the weeks ahead. It sits beside your current stock, so it can tell you how many days of stock remain and on which date each product is likely to run out.
Luca builds it from your Shopify history, which it imports in full and refreshes once a day, overnight. Forecasts account for seasonality and holidays such as Black Friday. Your supplier lead times sit in Luca as business context, so stock cover is measured against the time a reorder takes to arrive.
You can reach the forecast two ways. Ask in chat, for example "What's going to run out before Black Friday?", or open Numbers and the Stock tab.
What you see on the Stock tab
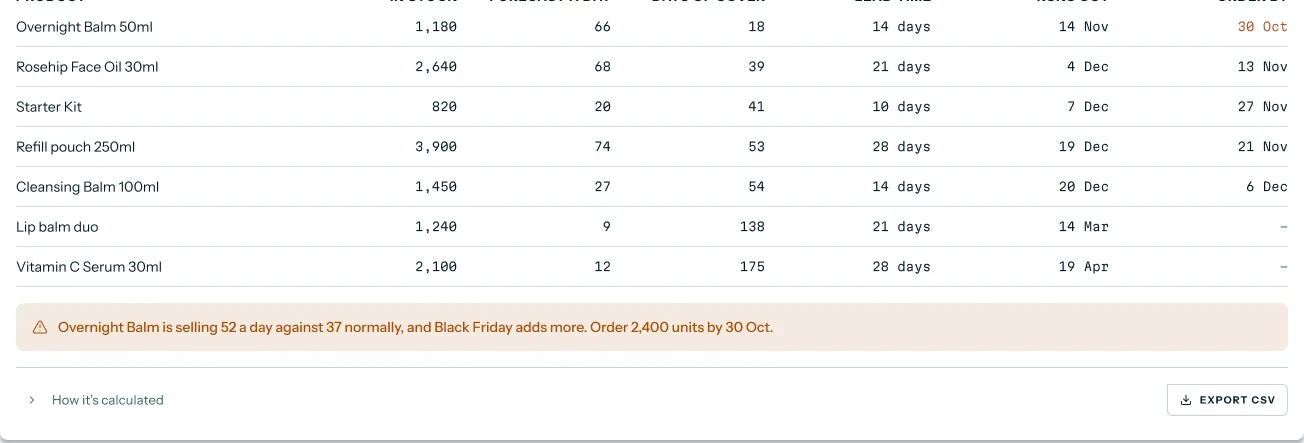
The Stock tab shows stock cover, run-out dates and order-by dates for each product. Each row gives units in stock, forecast units per day, days of cover, supplier lead time, the run-out date and the date to order by. A warning line under the table names the product that needs attention first.
 Illustrative example · demo brand
Read the order-by column first, because it shows which product needs a reorder soonest. The figures are sample data for a demo brand.
Expand How it's calculated under the table to see the assumptions behind the forecast. Every forecast in Luca shows them. Use Export CSV to take the table into your own planning sheet.
What it is not
It is not an ordering system. Luca reads from the systems you connect and writes to none of them, so you place every reorder with your supplier yourself. It gives you the run-out date, the order-by date and a reorder point per product. The quantity and the order stay your decision.
Why demand forecasting matters
What it's for
Demand forecasting tells you how many units of each product you will sell before the next delivery can land. That number decides how much you order, and when. Get it wrong on a bestseller and you either sell out in peak week or sit on stock into spring.
How it helps
- Order dates you can act on: each SKU gets a run-out date and an order-by date that already allow for its lead time.
- Peak weeks in the numbers: Black Friday and gifting weeks are part of the forecast, not a guess added afterwards.
- One list for the whole range: forty products are ranked by urgency instead of checked one by one.
- A forecast you can trust more each week: the nightly check against actual sales shows how far off the forecast has been.
What happens without it
Without a forecast, reorders follow last month's sales. A product that sells three times as fast in late November runs out days before the busiest weekend of the year. Meanwhile, slow lines get reordered at the same pace and tie up cash for months.
Why buyers care
It matters most to operations and inventory leads in the eight weeks before Black Friday. Supplier lead times then leave one chance to get quantities right. Founders and finance leads care too, because stock is usually the largest call on cash.
The Luca AI approach to demand forecasting
Picture the operations lead at a home-fragrance brand on Shopify. It is late October, and she has 40 candle SKUs to size before Black Friday. Her wax and glass supplier needs about four weeks from order to delivery.
The usual route is a spreadsheet. She exports units sold, takes a recent weekly average for each candle, and adds a mark-up for the peak. That takes most of a day for 40 products, and it tends to miss which scents lift most in November.
What changed is the size of the gap between an average week and a peak week. A flat run rate can be close in September and badly short in late November. The error lands on the bestsellers, exactly where running out costs the most.
Luca AI forecasts orders and units for every SKU from her store's own history, with seasonality and Black Friday built in. It sets each product's run-out date against its lead time and shows the date she has to order by. Every night it checks the forecast against what actually sold and corrects it.
The nightly check against actual sales, and the stock cover table with run-out and order-by dates, are both shown on this page. How other analytics platforms handle the same job is covered in How Luca AI compares for product demand forecasting, below.
How product demand forecasts are built
There are several ways to forecast units for a product. Each catches some patterns and misses others, and the misses matter more for single SKUs than for a whole store.
Run rate and moving averages
The simplest forecast takes recent sales and assumes they continue. A moving average helps because the average removes some of the randomness and leaves the underlying trend. It works well for steady lines. It misses peaks entirely, because it only knows the recent past, so it under-forecasts every product heading into Black Friday.
Seasonal naive
A seasonal naive forecast sets each week equal to the same week last season. It catches Black Friday and the gifting fortnight because it copies last year's shape. It misses growth, new scents and any change in promotion dates. It is still a useful benchmark: a forecast that cannot beat it is not earning its place.
Exponential smoothing
Exponential smoothing uses weighted averages of past sales, with older weeks counting less. Seasonal versions add a repeating pattern on top. It reacts quickly when a candle starts selling faster. It can overreact to a single viral week, and it needs a full season or more of history to learn the pattern.
Intermittent demand methods
Many SKUs sell a few units a day, with zero-sales days in between. Forecasters call this intermittent demand, and the M5 study notes it is typical when forecasting unit sales at product level. Croston's method splits such a series into two parts: the size of each sale and the gap between sales. It suits slow lines and limited editions. It does not handle a seasonal peak on its own.
Machine learning across many products
Machine learning models learn from many SKUs at once, so a new scent can borrow patterns from similar candles. They catch promotions, price changes and shared seasonal shapes. They need more data and are harder to explain. In the M5 competition on Walmart unit sales, only 415 teams, 7.5%, beat the top exponential smoothing benchmark. The authors also found that small accuracy gains lead to considerable inventory reductions.
What this means for your SKU forecast
For a catalogue with a big fourth quarter, the method has to know about seasonality and holidays, or it will be short where it matters. What Luca is confirmed to do is this: forecast orders and units per SKU, allow for seasonality and holidays such as Black Friday, show days of stock remaining, and check every forecast against actuals each night. Every forecast lists the assumptions it was built on, so you can see what it took into account.
Read your demand forecast
Start with the products that need action soonest, then work out quantities, then check the season. This order keeps the urgent reorders from waiting behind the routine ones.
Find the products that run out first
Open Numbers › Stock and sort your attention by the order-by column. A date that has already passed, or falls this week, comes first. Then look at days of cover beside lead time: a product with 18 days of cover and a 14-day lead time is close to the line.
If you would rather ask, type the question into chat. Luca answers with figures, a chart where useful and next steps, with each figure linked to the table it came from. You can ask the same question across Shopify, Amazon and your books in one go.
Size the next reorder
Luca sets a reorder point for each product and gives the date you need to order by. The quantity is yours to decide. A simple way to size it is to add up forecast units from today until the following delivery could land, add a safety buffer, and take away the stock you hold. The reorder point formula Shopify publishes uses the same building blocks: daily sales velocity, lead time and safety stock.
Check two things before you send the order. First, that the lead time Luca holds for that supplier is still right. Second, that the assumptions under How it's calculated match your promotion plan.
Plan stock for Black Friday
Seasonality is built into stock planning, so the forecast for late November already reflects how your products sold in past peaks. Read the forecast units per day for Black Friday week against a normal week. The products with the largest lift are the ones a flat reorder would leave short.
Pair this page with the revenue forecast for the same weeks. Revenue tells you how big the peak will be, and the demand forecast tells you which products have to carry it.
Black Friday 2026 dates and supplier lead times
Black Friday falls on Friday 27 November 2026, and Cyber Monday on 30 November. Count back from those dates by each supplier's lead time, and allow for slower supplier weeks in November. With a four-week lead time, stock for Black Friday week has to be ordered by late October.
The peak keeps growing. Over Black Friday Cyber Monday 2025, Shopify merchants sold 14.6 billion US dollars, up 27% on the year. Shopify notes that the figures are unaudited and subject to adjustment.
Get warned before a product runs out
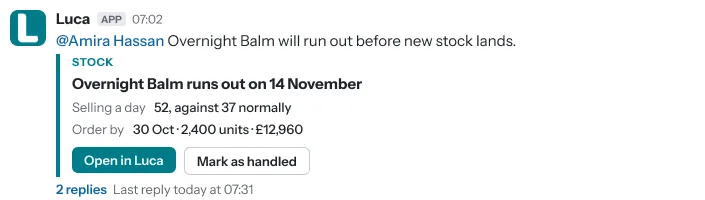
Luca sends stock-out alerts early enough to act. You choose where alerts go: Slack, email or the app. Each alert names the product, its run-out date, how fast it is selling against normal and the date to order by.
 Illustrative example · demo brand
A stock alert reaches the person who owns stock, with the run-out date and the date to order by. The figures are sample data for a demo brand.
Spot overstock and slow movers
The same forecast shows where you hold too much. Luca flags slow-moving and aged stock, and the cash tied up in it. Use this before Black Friday to decide which lines to promote, and which reorders to shrink or skip.
How the demand forecast is checked every night
Forecasts run on a daily schedule. Each night Luca compares the forecast with what actually sold and corrects it. Daily data-quality audits also compare Luca's data with Shopify and Amazon, and catch gaps, duplicates and stale tables.
How demand forecast accuracy is measured
For unit forecasts, two measures matter most. Mean absolute error (MAE) is the average gap between forecast and actual units. It is popular because it is easy to understand and compute, and for a single SKU it reads directly as "we were 12 units a week out". Its weak spot is that you cannot compare it across a 5-unit candle and a 500-unit candle.
Percentage error fixes that, but it breaks on slow sellers. A week with zero sales makes the percentage infinite or undefined, which is common at SKU level. For a slow line, judge the forecast in units, or against a seasonal naive benchmark.
Also watch for bias. A forecast that is always a little low on bestsellers costs more than one that is randomly off, because the shortfall lands in the busiest week.
Forecast accuracy in Luca
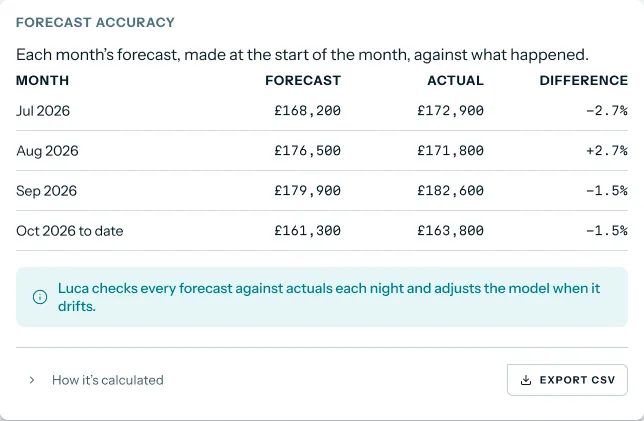
Forecast accuracy is measured against actuals every night. The Forecast accuracy card shows each month's forecast, made at the start of the month, beside what happened and the difference.
 Illustrative example · demo brand
The card shows how far each month's forecast landed from the actual figure, so you can judge how much buffer to keep. The figures are sample data for a demo brand.
Use the record to set your safety buffer. If the forecast has been close for months, you can hold less spare stock. If it has missed, hold more until it settles.
How to forecast demand for each SKU
Here is the job done by hand, then the same job in Luca, then a worked example on one candle.
The manual method
- Export units sold by SKU and by week from Shopify, for at least the last two years.
- Work out a base rate for each SKU from the last six to eight normal weeks.
- For each coming week, multiply the base rate by last year's lift for the same week.
- Adjust for this year's growth, new products and promotion dates.
- Add up forecast units week by week and find the week your current stock runs out.
- Subtract the supplier lead time from that date to get the date you must order by.
- Size the order: forecast units until the following delivery, plus safety stock, minus stock on hand.
- Repeat for every SKU each week, and compare last month's forecast with actual sales.
Two cautions apply. The basic safety stock formula works for average scenarios but not for seasonal changes in demand, so a flat buffer is too thin for November. And with 40 SKUs, step 8 is the one that usually gets skipped.
The same job in Luca
Steps 1 to 6 and the accuracy check in step 8 are done for you. Ask in chat which products run out before Black Friday, or open Numbers › Stock. Read the run-out and order-by dates, check the assumptions, and get an alert if a product slips. Step 7 stays with you: choose the quantity and place the reorder with your supplier.
A worked example: one candle before Black Friday
This is an illustrative calculation with sample figures, not a Luca output. A 300g candle has 1,200 units in stock on Monday 26 October. Its normal rate is 30 units a day and the supplier lead time is 28 days.
| Week starting | Forecast units per day | Forecast units for the week | Cumulative units | Stock left at week end |
|---|---|---|---|---|
| 26 Oct | 30 | 30 × 7 = 210 | 210 | 1,200 − 210 = 990 |
| 2 Nov | 30 | 30 × 7 = 210 | 420 | 780 |
| 9 Nov | 35 | 35 × 7 = 245 | 665 | 535 |
| 16 Nov | 40 | 40 × 7 = 280 | 945 | 255 |
| 23 Nov (Black Friday week) | 75 | 75 × 7 = 525 | 1,470 | Runs out on 26 Nov |
| 30 Nov (Cyber week) | 50 | 50 × 7 = 350 | 1,820 | 0 |
| 7 Dec | 45 | 45 × 7 = 315 | 2,135 | 0 |
| 14 Dec | 40 | 40 × 7 = 280 | 2,415 | 0 |
| 21 Dec | 25 | 25 × 7 = 175 | 2,590 | 0 |
With 255 units left on 22 November and 75 a day from 23 November, stock lasts until 26 November. That is the day before Black Friday. With a 28-day lead time, the order-by date is 29 October.
Now size the order. Demand to 27 December is 2,590 units. Add a week of safety stock at 45 a day, 315 units, and take away the 1,200 on hand: 2,590 + 315 − 1,200 = 1,705 units.
A flat run rate gives a very different answer. At 30 a day, 1,200 units last 40 days, to 5 December, so the order could wait until 7 November. Nine weeks at 30 a day is 1,890 units, so the order would be 1,890 + 315 − 1,200 = 1,005 units. That is 700 units short, and it arrives after the candle has sold out.
Get forecasting switched on
Forecasting is switched on per client by Luca's team, and it is not gated by plan. Ask your Luca contact, or get in touch with the team, to have it switched on for your brand. Plans and what each includes are on the pricing page.
Before that, connect Shopify so Luca has your sales history. Then give the Luca team your supplier lead times and minimum order quantities, which Luca holds as business context for stock planning.
How the demand forecast works with the rest of Luca
Shopify
Shopify is the record of what sold. Luca reads products and variants, inventory by location, transfers, refunds and returns, with full history refreshed daily. From these it builds stock cover, stock-out risk and weekly product-demand forecasts. The connection is read-only, so Luca never changes your store.
Amazon Seller Central
If you sell on Amazon, Seller Central brings in marketplace sales, fees and FBA stock, with up to two years of history. Amazon FBA inventory sits beside your own warehouse in the stock view, and Amazon-specific alerts cover the Buy Box and stock.
Stock by location
Luca shows stock by location using your Shopify locations, so you can see units in the warehouse, at Amazon FBA and anywhere else you hold them. Bundles and kits are handled too, which matters when a gift set uses the same candle as a single.
Xero and QuickBooks
With Xero or QuickBooks connected, Luca adds a free-cash-flow forecast. It treats inventory as working capital and shows the cash tied up in stock, so a large peak reorder can be read against cash. Compare contribution margin with gross margin before you decide which lines deserve the deepest stock.
Chat and alerts
Every demand question can go to chat, and answers can be downloaded as CSV or Excel. "What if" questions can be asked in chat too, where Luca reasons from your data. Alerts go to Slack, email or the app, so the person who places reorders hears about a run-out first.
Who uses the demand forecast, and how
Operations and inventory leads
They open the Stock tab each Monday, work down the order-by column, and place the week's reorders. Before peak season they compare forecast units per day for Black Friday week against normal weeks, and resize the bestseller orders. For a wider view of reorder planning across channels, see inventory demand forecasting.
Founders and CEOs
They ask chat which products will run out before Black Friday, and which lines are tying up cash. That turns a stock decision into a two-minute check before the trading meeting. The daily view of sales, ads, profit and cash puts the answer in context.
CFOs and finance leads
They read the demand forecast beside the cash forecast to see when a peak reorder will hit the bank. Slow-moving and aged stock shows where cash can be released. The same figures can feed the monthly KPI pack.
How Luca AI compares for product demand forecasting
Luca forecasts units for every SKU from your own store history, with seasonality and holidays built in. It turns that forecast into run-out and order-by dates, and checks itself against actual sales every night. Luca AI is the only platform in this table that does all four.
Product demand forecasting features, from each platform's public documentation:
| Platform | Luca AI | Shopify Sidekick | Lifetimely by AMP | Triple Whale | Daasity |
|---|---|---|---|---|---|
| Orders and units forecast per SKU | Yes | Partly (forecasts on request, with code) | Not in docs | Not in docs | Partly (projected units you input) |
| Run-out and order-by dates | Yes | Partly (days of inventory remaining) | Partly (predicted stockout date and velocity) | Partly (Days of Stock, Out of Stock Date) | Partly (weeks of cover you calculate) |
| Seasonality and holidays built in | Yes | Not in docs | Not applied (no seasonality matching) | Not in docs | Partly (daily plan around events) |
| Checked against actuals every night | Yes | Not in docs | Not in docs | Not in docs | Partly (daily plan against actuals) |
Yes: documented and built in. Partly: documented with a limit, shown in brackets. Not in docs: not found in the vendor's public documentation.
Why Luca AI is the stronger choice for product demand forecasting
- Seasonality in every SKU forecast: Luca's forecasts account for seasonality and holidays such as Black Friday, while Lifetimely's forecasting does not apply seasonality. Read more in Lifetimely alternatives.
- A forecast, not a snapshot: Luca builds days of stock from forecast demand, while Triple Whale's Days of Stock and Out of Stock Date work from today's inventory. See Triple Whale alternatives.
- No units to type in: Luca forecasts units from your sales history, while Daasity's revenue plan asks you to input your projected units. Compare in Daasity alternatives.
Competitor details checked against each vendor's public documentation on 7 November 2026. Features and plans change, so confirm with the vendor before you decide.
Limits of the demand forecast
- Forecasting is switched on per client by Luca's team. Until it is, the Stock tab and chat answers have no forecast to draw on.
- Luca is read-only. It sets reorder points and order-by dates, and you choose quantities and place every reorder with your supplier.
- Supplier lead times and minimum order quantities come from you. Luca holds them as business context, so order-by dates are only as current as the lead times you give.
- Data refreshes once a day, overnight. A sudden spike today shows up in the forecast tomorrow.
Common questions
What is demand forecasting software?
Demand forecasting software estimates how many units of each product you will sell in the coming weeks. Good tools turn that estimate into a run-out date and a date to reorder by, allowing for seasonality and holidays.
What does Luca's demand forecast show for each SKU?
It shows forecast orders and units, units in stock, days of stock remaining, supplier lead time, the likely run-out date and the date to order by. It also lists the assumptions behind each forecast.
Does the forecast allow for Black Friday?
Yes. Luca's forecasts account for seasonality and holidays such as Black Friday, and seasonality is built into stock planning. Expand How it's calculated to see which assumptions the forecast used.
How does Luca work out a run-out date?
It compares the stock you hold with forecast demand per day to get days of stock remaining. That gives the likely run-out date. Taking away the supplier lead time gives the date you need to order by.
Does Luca place orders with my supplier?
No. Luca only reads your data and writes to none of your systems. It shows reorder points, run-out dates and order-by dates, and you choose the quantity and place the reorder yourself.
How accurate is the demand forecast?
Luca checks every forecast against actual sales each night and corrects it. The Forecast accuracy card shows each month's forecast beside what happened, so you can see how close it has been for your brand.
Which accuracy measure suits slow-selling SKUs?
Use the error in units, such as mean absolute error. Percentage errors break when a product has zero-sales days, which is common for slow lines. A seasonal naive forecast is a fair benchmark to compare against.
Does the forecast include Amazon FBA stock?
Yes, if you connect Amazon Seller Central. Luca reads marketplace sales, fees and FBA stock, with up to two years of history, and shows FBA inventory beside your other locations.
Can I see stock by location?
Yes. Luca shows stock by location using your Shopify locations, so units in your warehouse, at Amazon FBA and at other sites appear side by side in one view.
Can I get an alert before a product runs out?
Yes. Luca sends stock-out alerts early enough to act, with the run-out date and order-by date. You choose whether alerts go to Slack, email or the app.
Where do supplier lead times come from?
You give them to Luca's team. Lead times and minimum order quantities are held as business context, and stock cover is measured against each supplier's lead time.
Does Luca set reorder points?
Yes. Luca sets a reorder point for each product. The reorder quantity and the order itself stay with you, so every decision about what to buy remains your call.
Can I download the forecast?
Yes. The stock cover table has an Export CSV control, and chat answers can be downloaded as CSV or Excel for your own planning sheet.
How do I get demand forecasting switched on?
Ask your Luca contact or the Luca team. Forecasting is switched on per client and is not tied to a plan. Connect Shopify first so Luca has your sales history.
Updated 7 November 2026: first published with how product demand forecasts are built, how accuracy is measured, the manual method with a worked example, the 2026 peak dates and further reading.