
Omnichannel analytics, or multichannel e-commerce analytics, answers one question for a brand on Shopify and Amazon: which channel actually makes money once fees and returns are paid? Each platform reports its own sales on its own terms, so the numbers never line up. Luca AI, an e-commerce analytics tool with AI agents, joins Shopify, Amazon and your other online channels into one P&L. You see revenue, Amazon referral and FBA fees, returns, CAC and margin for each channel side by side.
At a glance
| What it is | Shopify and Amazon sales, fees and profit in one P&L, compared channel by channel |
|---|---|
| Amazon costs included | Referral fees, FBA fees and settlements, from Amazon Seller Central |
| Returns | Taken out of revenue and margin, down to product level |
| Per channel | Net revenue, CAC and margin for each sales channel |
| Per product | Each SKU's sales, fees and profit on your own store and on Amazon |
| Per country | A P&L by country, with local currency beside your reporting currency |
| Ads | Amazon Sponsored Ads, as Amazon reports them, beside each channel's profit |
| Cash check | Marketplace payouts reconciled to your Xero or QuickBooks ledger |
| Online channels | Shopify, Amazon Seller Central and Amazon Ads connect self-serve |
| Physical stores | Only through a custom connector that Luca's team builds on request |
| What it never does | Change your store, listings, ads or books. Luca only reads your data |
So if Amazon revenue is growing faster than your own store, you can see whether it still earns more after fees and returns before you move budget toward it.
What omnichannel analytics is in Luca
Omnichannel analytics in Luca means one set of numbers for every online channel you sell through. Luca connects Shopify by one-click OAuth and imports orders, products, customers, inventory, refunds, payouts and fees. It connects Amazon Seller Central and Amazon Ads by OAuth, per marketplace. That covers orders, fees, settlements, FBA inventory and ad performance.
Luca then puts both channels in the same P&L. Net revenue is shown on every connected sales channel, with gross sales, discounts, returns, shipping and tax kept as separate figures. Contribution margin comes after product costs, fees and advertising. That is the figure that tells you which channel earns more.
What you see on the Profit tab
Your dashboards sit under Numbers in the left rail, built for your brand by Luca's team. The Profit tab is headed What each product, channel and month actually made. A filter bar lets you pick brand, store, country, date range and comparison period.
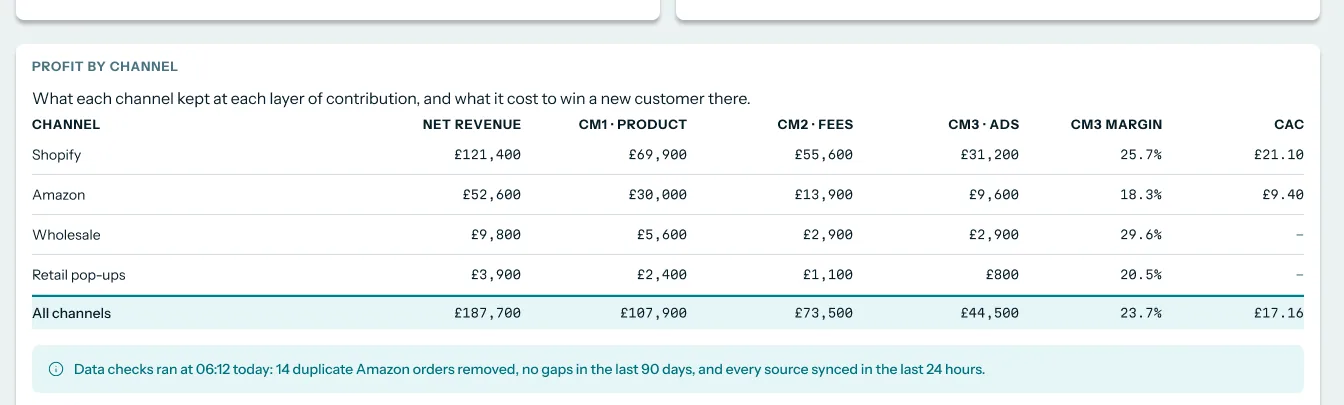 Illustrative example · demo brand
Each channel's revenue sits beside what it keeps after product costs, fees and ads, so Amazon's share of sales and its share of profit read together. The figures are sample data for a demo brand.
What it is not
It is not an attribution tool. Luca compares ad spend and the results each ad platform reports with the revenue each channel records. It does not say which ad, campaign or creative drove a given order on Shopify or Amazon. It is also not a store manager: it never changes a listing, a price or an ad.
Where multichannel e-commerce analytics fits
What it's for
It shows what each sales channel keeps after its own costs. For a brand on Shopify and Amazon, that means one comparison you can trust before you shift stock, ad budget or time between the two.
How it helps
- One P&L, two channels. Shopify and Amazon sit in the same profit view, on the same definitions.
- Fees in the right place. Amazon referral and FBA fees come off Amazon revenue, not off the business as a whole.
- Returns counted. Refunds come out of revenue and margin by product, so a high-return channel shows up.
- Countries kept apart. Sales in euros are converted to your reporting currency, with the local amount still visible.
What happens without it
You judge channels on revenue. Amazon looks like the growth engine because its top line climbs fastest. Its fees, returns and ad costs land in different reports, weeks apart, so nobody sees them against the sale. Budget follows the bigger number, and margin quietly falls.
Why buyers care
Founders feel this when a marketplace starts to outgrow the brand's own store. Finance leads feel it at month end, when Amazon settlements and Shopify payouts have to agree with the books. Both need the same answer: what each channel earned, not what it sold.
The Luca AI approach to omnichannel analytics
Take the founder of a kitchenware brand. She sells pans, knives and utensils on Shopify in the UK, and on Amazon in the UK and Germany. Amazon revenue has grown faster than her own store for three quarters. Her marketing lead wants to move ad budget toward Amazon. She wants to know whether Amazon still earns more after referral fees, FBA fees and returns.
The usual answer is a spreadsheet. Someone exports Shopify orders, downloads Amazon settlements for each marketplace and converts the German sales from euros by hand. It can take a day or two each month. Fees and returns often arrive after the sale they belong to, so the sheet may be out of date before it is finished.
The question itself has changed. When one channel was small, a rough split was good enough. Now Amazon carries a large share of sales. A few points of margin on each order decide whether growth there adds profit or just adds work.
Luca AI reads Shopify, Amazon Seller Central and Amazon Ads directly and builds one P&L across them. It takes Amazon referral fees, FBA fees and returns off the channel they belong to. It converts euro sales into pounds at the daily rate and keeps a P&L by country. You can then ask in plain English whether Amazon Germany made money last month.
The country table further down puts each country's local currency amount beside its net revenue in pounds. How that compares with other tools is covered in How Luca AI compares for multichannel e-commerce analytics, below.
How Shopify and Amazon sales get compared
There are five common ways to compare the two channels. Each one catches something and misses something else.
Each platform's own reports
You read Shopify Analytics and Amazon Seller Central side by side. This catches the sales trend on each channel quickly. It misses comparability: each platform counts returns, fees and dates its own way, so the two totals don't measure the same thing.
Revenue in one spreadsheet
You paste both channels' sales into one sheet. This catches growth and channel share. It misses everything below revenue. A channel can grow its sales while its profit stays flat or falls.
Blended marketing efficiency
Marketing efficiency ratio compares total revenue with total marketing spend across every channel. It catches whether marketing as a whole is paying off. It misses which channel is doing the work, because Shopify and Amazon spend are added together.
Platform-reported ad results
Each ad platform credits sales by its own rules. The most common rule is last-click attribution, the default for most marketing platforms. This catches how a campaign looks to the platform that ran it. It misses overlap: two platforms can each claim the same customer.
Contribution margin per channel
Contribution margin measures what you keep after variable costs, worked out per line of business. Per channel, that means product costs, fees, fulfilment, returns and ad spend for that channel only. It catches the answer the founder needs. It misses fixed costs such as rent and salaries, which you still cover from the total.
What this means for your Shopify and Amazon numbers
Luca is confirmed to do three of these at once. It builds one P&L across Shopify and Amazon. It shows contribution margin and CAC per channel. It shows ROAS per platform and blended MER, with Amazon Ads results as Amazon reports them. It does not assign orders to ads.
Compare Shopify and Amazon after fees and returns
Start on Numbers › Profit with the date range set to the last full quarter. Then work through the channel view in this order.
- Read revenue by channel. This is the share each channel sells.
- Read contribution by channel. This is the share each channel keeps.
- Check returns by product. Luca shows return and refund rates by product, so a SKU that comes back more often on Amazon stands out.
- Open SKU profit. Luca shows profit by product, variant and SKU, including Amazon SKU economics after marketplace fees.
What usually goes wrong is the time window. Amazon fees and refunds settle after the sale, so a single week can flatter Amazon. Use a full month or quarter before you decide anything. For a wider view of margin levels, our guide to ecommerce profit margins gives the background.
Ask the same question in chat
You can ask Luca directly: "Did Amazon earn more than Shopify last quarter after fees and returns?" The answer draws on Shopify, Amazon and your books together, as described in answers across Shopify, ads and Xero. Follow up with the SKU or the country you want to check.
Read your P&L by country
Selling on Amazon in Germany adds a currency to your numbers. Luca converts sales in any currency into your reporting currency at the daily rate. It then shows a P&L by country, so Germany stands on its own rather than hiding inside "Amazon".
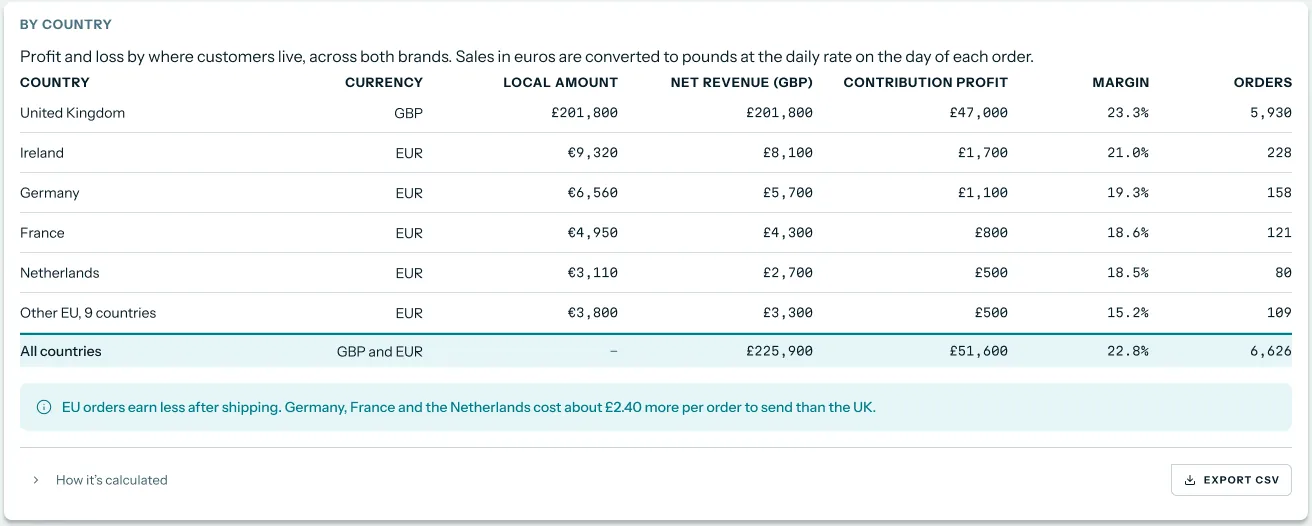 Illustrative example · demo brand
Germany's local euro amount sits beside its net revenue in pounds, so a weak euro month is visible rather than mistaken for a sales drop. The figures are sample data for a demo brand.
Read the margin column, not the revenue column. Orders sent abroad often cost more to ship, so a country can sell well and still earn less per order. If Germany's margin trails the UK by several points, check fulfilment costs before you add ad spend there.
Put Amazon Ads beside channel profit
Amazon Sponsored Ads come into Luca down to keyword, search term and placement. You see spend and the results Amazon reports next to Amazon's revenue and contribution. That lets you ask whether Amazon is still profitable once its own advertising is paid for.
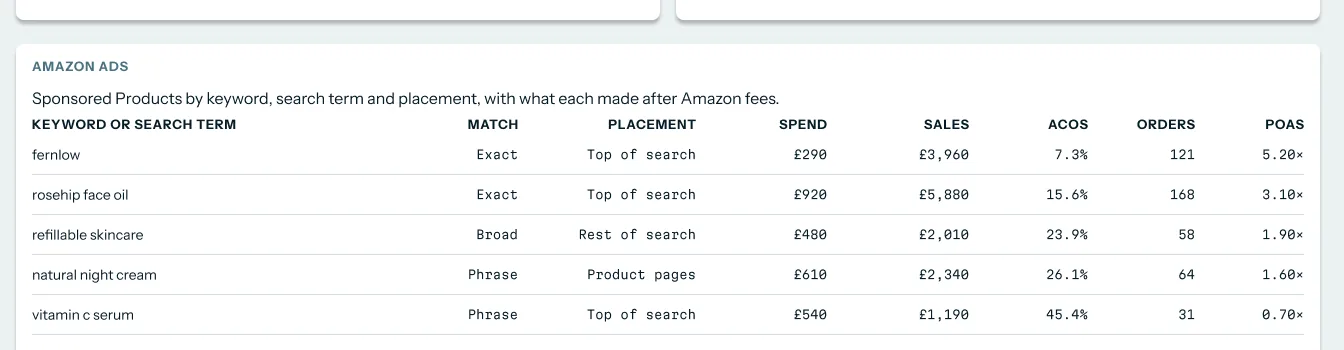 Illustrative example · demo brand
Amazon ad spend comes in down to keyword and placement, so Amazon's profit can be read after its own advertising. Sales and orders here are Amazon's own count. The figures are sample data for a demo brand.
Keep two caveats in mind. Amazon's reported sales are Amazon's own credit, not a count Luca makes. Luca does not say which campaign drove a given order on either channel. For the platform-by-platform view, our page on ROAS analysis by channel and campaign goes further, and our post on why platform ROAS can mislead explains the gap.
How to measure profit per channel
Two measures decide whether to move budget between Shopify and Amazon.
Contribution margin per channel
This is net revenue minus product costs, fees, fulfilment and ad spend for one channel, divided by that channel's net revenue. Its weak spot is shared cost. If one team runs both channels, its cost is not in either figure. A second weak spot is timing, because late Amazon fees can shift a month.
CAC per channel
Customer acquisition cost per channel is ad spend on that channel divided by the new customers it brings. Its weak spot is that one shopper can buy on both channels and count as new on each. So compare CAC trends within a channel more than across channels. Our page on customer retention analysis covers what happens after the first order.
Where Luca shows them
Luca shows CAC and margin per channel on Numbers, alongside contribution margin by layer (CM1, CM2 and CM3). It also reconciles marketplace payouts, so the fees in your margin match the cash Amazon paid.
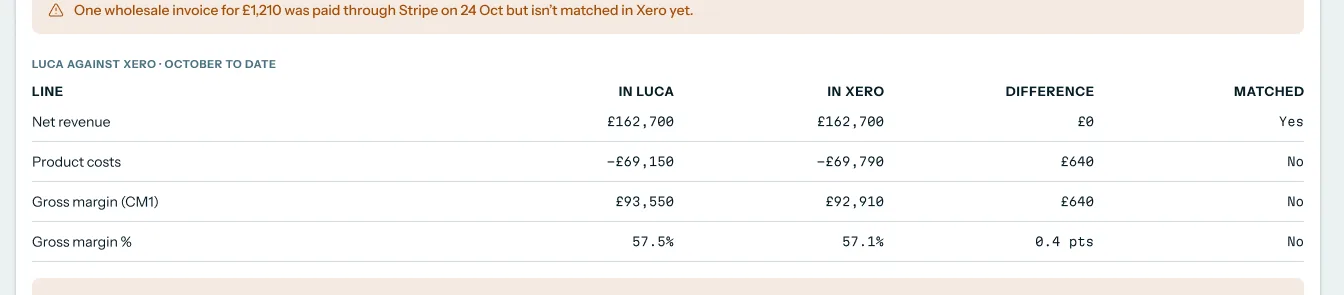 Illustrative example · demo brand
Luca's figures are checked line by line against your books, so a gap such as an uncoded supplier bill shows up before month end. The figures are sample data for a demo brand.
How to compare Shopify and Amazon profit
The manual method
- Export last month's Shopify orders, refunds and payouts.
- Download the settlement data for each Amazon marketplace you sell in.
- Convert euro sales and fees to pounds at each day's rate.
- Put gross sales, returns and net revenue in one column per channel and country.
- Subtract product costs for the units each channel sold.
- Subtract payment fees for Shopify, and referral and FBA fees for Amazon.
- Subtract the ad spend run for each channel.
- Divide what is left by net revenue to get contribution margin per channel.
- Tie the Shopify and Amazon payouts to your bank and your books.
Steps 2, 3 and 9 are where most errors creep in. A missed settlement or a wrong rate can move a channel's margin by several points.
The same job in Luca
Connect Shopify, Amazon Seller Central and Amazon Ads once. Luca refreshes them every night, takes fees and returns off the right channel and converts euros at the daily rate. Open Numbers › Profit and read revenue and contribution by channel. Or ask in chat for the same comparison by country. For a monthly pack, our page on KPI reporting shows how the same figures export.
A worked example: one month across three marketplaces
This is an illustrative calculation with sample figures, not a Luca output. It follows the kitchenware founder's month in pounds, with Amazon Germany already converted from euros.
| Line | Shopify UK | Amazon UK | Amazon DE |
|---|---|---|---|
| Gross sales | £43,000 | £33,000 | £13,500 |
| Returns and refunds | (£3,000) | (£3,000) | (£1,500) |
| Net revenue | £40,000 | £30,000 | £12,000 |
| Return rate (returns ÷ gross sales) | 7.0% | 9.1% | 11.1% |
| Product costs (35% of net revenue) | (£14,000) | (£10,500) | (£4,200) |
| Payment fees, or Amazon referral fees | (£800) | (£4,500) | (£1,800) |
| Shipping, or FBA fees | (£3,200) | (£4,800) | (£2,040) |
| Contribution before ads | £22,000 | £10,200 | £3,960 |
| Ad spend for the channel | (£9,000) | (£3,000) | (£1,500) |
| Contribution after ads | £13,000 | £7,200 | £2,460 |
| Contribution margin | 32.5% | 24.0% | 20.5% |
Amazon UK and Germany together sell 42,000 pounds against Shopify's 40,000. But they keep 9,660 pounds against Shopify's 13,000. Each extra pound of Amazon sales earns about 24p in the UK and 20.5p in Germany, against 32.5p on Shopify. Moving budget to Amazon can still add profit. It adds less per pound than the revenue chart suggests, and Germany's higher return rate is the first thing to fix.
Get Shopify and Amazon connected
- Connect Shopify from Sources. It is self-serve and read-only.
- Connect Amazon Seller Central. It is self-serve and connects per region, so add each region you sell in.
- Connect Amazon Ads, which is also self-serve.
- Connect Xero or QuickBooks Online if you want payouts tied to your books.
- Let the history load. Luca brings in your full Shopify history and up to two years of Amazon history.
Luca's team then sets up your Numbers dashboards for your brand. Our guide to setting up Luca walks through the first connections, and the page on read-only access explains what Luca can and cannot touch.
Bring in physical-store or wholesale sales
Physical-store sales are not a standard connection. They come in only through a custom connector that Luca's team builds. The same applies to trade and wholesale orders, which are added through a custom source. To ask for one, open Sources and click Contact us next to "Can't find the source you're looking for?". Describe the system and send the message. The form notes that Luca usually replies within one working day.
How omnichannel analytics works with the rest of Luca
Shopify
Shopify supplies orders, products, customers, inventory, refunds, payouts and fees for your own store. That is the first column in every channel comparison.
Amazon Seller Central and Amazon Ads
Seller Central supplies Amazon orders, fees, settlements and FBA inventory. Amazon Ads supplies Sponsored Ads spend and Amazon's reported results. Amazon FBA stock levels also feed demand forecasting by product.
Xero and QuickBooks
Your ledger lets Luca match orders to payouts and to the books, so revenue, cash and the books agree. Our post on cash flow, revenue and profit explains why those three often differ.
Forecasts
Once both channels are in one place, the revenue forecast works from the same history. That helps when you plan Amazon's share of next year's sales.
Chat
Every figure on this page can be asked for in plain English. Our page on AI agents for ecommerce shows what else you can ask.
Who uses omnichannel analytics, and how
Founders and CEOs
A founder deciding where to grow reads contribution by channel each month. If Amazon's share of profit lags its share of sales, she slows the budget shift and fixes fees or returns first. Our page on seeing the whole business covers the wider morning view.
CFOs and finance leads
A finance lead closing the month uses the payout reconciliation. Amazon settlements and Shopify payouts are matched to the ledger, so variances surface before the books are signed off. Our post on ecommerce reporting covers the weekly rhythm.
Growth and marketing leads
A growth lead planning Amazon Ads reads Amazon's spend and reported results beside Amazon's contribution. That keeps the budget conversation on profit, not on platform ROAS alone.
Operations and inventory leads
An operations lead watching FBA stock checks SKU profit on each channel. A product that sells on Amazon but loses money after fees is a candidate to move back to the brand's own store.
How Luca AI compares for multichannel e-commerce analytics
Luca AI puts Shopify and Amazon in one P&L, takes Amazon referral and FBA fees off the right channel and shows a P&L by country in local and reporting currency. It also reconciles marketplace payouts to your Xero or QuickBooks ledger. Luca AI is the only platform in this table that does all four.
Multichannel e-commerce analytics features, from each platform's public documentation:
| Platform | Luca AI | Lifetimely | Daasity | Northbeam | Triple Whale | Saras Analytics |
|---|---|---|---|---|---|---|
| Shopify and Amazon in one P&L | Yes | Yes (Consolidated Income Statement across stores) | Not in docs | Partly (Amazon revenue and ad spend) | Partly (sales by shop, platform and day) | Not in docs |
| Amazon referral and FBA fees | Yes | Yes (FBA fees in Amazon cost settings) | Yes (Amazon Settlement Report of costs to sell) | Not in docs | Not in docs | Partly (estimated referral fees per SKU) |
| Country P&L in local and reporting currency | Yes | Not in docs | Not in docs | Partly (one reporting currency, USD by default) | Partly (converted to the shop's currency) | Partly (preferred reporting currency) |
| Payouts matched to Xero or QuickBooks | Yes | Partly (QuickBooks syncs expenses) | Not in docs | Not in docs | Not in docs | Partly (Xero tables for reconciliation) |
Yes: documented and built in. Partly: documented with a limit, shown in brackets. Not in docs: not found in the vendor's public documentation.
Why Luca AI is the stronger choice for multichannel e-commerce analytics
- One answer across both channels. Luca answers across Shopify and Amazon in one chat, while Lifetimely's Profit Agent answers about one store at a time. See our Lifetimely alternatives.
- Fees inside the same P&L. Luca takes Amazon fees off Amazon inside the P&L it shares with Shopify, while Daasity documents an Amazon Settlement Report for Amazon's costs. See our Daasity alternatives.
- Local currency kept in view. Luca shows each country's local amount beside pounds, while Triple Whale documents revenue converted to the shop's currency for display. See our Triple Whale alternatives.
Competitor details checked against each vendor's public documentation on 29 October 2026. Features and plans change, so confirm with the vendor before you decide.
Limits of omnichannel analytics in Luca
- Physical stores need a custom connector. In-store sales come in only through a connector that Luca's team builds on request, not as a standard connection.
- No order-level attribution. Luca compares spend and platform-reported results with channel revenue. It does not say which ad, campaign or creative drove an order.
- Read-only by design. Luca never changes your store, Amazon listings, ad accounts or ledger. Every decision and every change stays with you.
- Amazon history has a ceiling. Luca brings in up to two years of Amazon history, against your full Shopify history.
- Overnight, not live. Data refreshes every night, so today's sales show up tomorrow morning.
- Dashboards are set up for you. Luca's team builds your Numbers dashboards with your brand. You don't assemble them yourself.
Common questions
What is omnichannel analytics for a Shopify and Amazon brand?
It is one set of numbers covering every channel you sell through. For a Shopify and Amazon brand, it puts both channels' sales, fees, returns and profit side by side on the same definitions, so you can see which channel earns more.
Does Luca put Shopify and Amazon in one P&L?
Yes. Luca joins Shopify and Amazon into one P&L, with net revenue and contribution margin shown for each channel. Luca's team sets up the dashboards for your brand.
Are Amazon referral and FBA fees included?
Yes. Luca reads Amazon referral fees, FBA fees and settlements from Amazon Seller Central and takes them off Amazon's revenue. Payment and marketplace fees are reconciled to payouts.
How are returns handled?
Returns and refunds are taken out of revenue and margin, down to product level. Luca also shows return and refund rates by product, so a SKU that comes back more often on Amazon stands out.
Can I see profit for each SKU on Shopify and on Amazon?
Yes. Luca shows profit by product, variant and SKU, including Amazon SKU economics after marketplace fees. It gives one view of each SKU's sales, fees and profit across your own store and Amazon.
How does Luca handle euro sales from Amazon Germany?
Luca converts sales in any currency into your reporting currency at the daily rate. The country table keeps the local euro amount beside the converted figure in pounds.
Can I see a P&L by country?
Yes. Luca shows a country-level P&L with currency, local amount, net revenue in your reporting currency, contribution profit, margin and orders for each country.
Can Luca tell me which ad drove an Amazon sale?
No. Luca has no attribution model. It shows Amazon Ads spend and the results Amazon reports beside each channel's revenue and profit, but it does not tie an order to an ad, campaign or creative.
Do sales from my physical shop come in?
Only through a custom connector. Physical-store sales are not a standard connection. Luca's team builds a connector to your point-of-sale system on request, through Contact us on the Sources page.
Can wholesale orders sit in the same P&L?
Yes, through a custom source. Trade and wholesale data is added by Luca's team, and wholesale and B2B orders then sit beside your online channels.
Are Amazon payouts reconciled to my books?
Yes. Luca matches orders to payouts and to the ledger in Xero or QuickBooks, so revenue, cash and the books agree. Marketplace payouts are part of that reconciliation.
How much Amazon history does Luca bring in?
Up to two years of Amazon history, and your full Shopify history. That is usually enough to compare the same months across two years on both channels.
How often does the data refresh?
Every night. Luca refreshes your connected sources overnight, so you see yesterday's sales, fees and refunds when you start work.
Can Luca change my Amazon listings, prices or ads?
No. Luca is read-only. It never writes to a store, an ad account, an email platform or a ledger, and every change stays with you.
Updated 7 November 2026: added the worked example across three marketplaces, the country P&L, payout reconciliation and the comparison grid.