
Cohort retention analysis answers one question for a subscription brand: are the customers you won in a given month still buying, month after month? Luca AI is an e-commerce analytics tool and AI agent that groups your Shopify customers by the month of their first order. It then shows how many come back in each month that follows, out to three years, with each cohort's revenue and orders beside the rates. You read the table, spot the cohorts that fade early, and ask which first products those customers bought.
At a glance
| What it is | Monthly acquisition cohorts: every customer grouped by the month of their first order |
|---|---|
| How far it runs | Retention from month 1 to month 35, so roughly three years per cohort |
| What sits beside the rates | Each cohort's lifetime revenue and transactions, and historical lifetime value by cohort |
| What you can drill into | Repeat-purchase rate by cohort and by first product bought |
| Where you see it | On Numbers › Customers, and in chat |
| Where the data comes from | Your Shopify order history, read overnight; Amazon Seller Central adds its own customer cohorts |
| Who sets it up | You connect Shopify yourself; cohort retention is standard for every brand that connects it |
| What it never does | Change your store, your discount codes or your email flows. Luca only reads your data |
What cohort retention shows
A cohort is every customer whose first order fell in the same calendar month. Luca defines cohort retention as the share of each month's new customers who come back, from month 1 to month 35. So the January cohort is everyone who first bought in January, and its month 3 figure tells you how many of them came back by their third month.
This is different from a store-wide returning customer rate. A store-wide rate mixes customers who joined last week with customers who joined two years ago. A cohort table keeps each intake separate, so a weak month can't hide behind a strong one.
What you see on the Customers tab
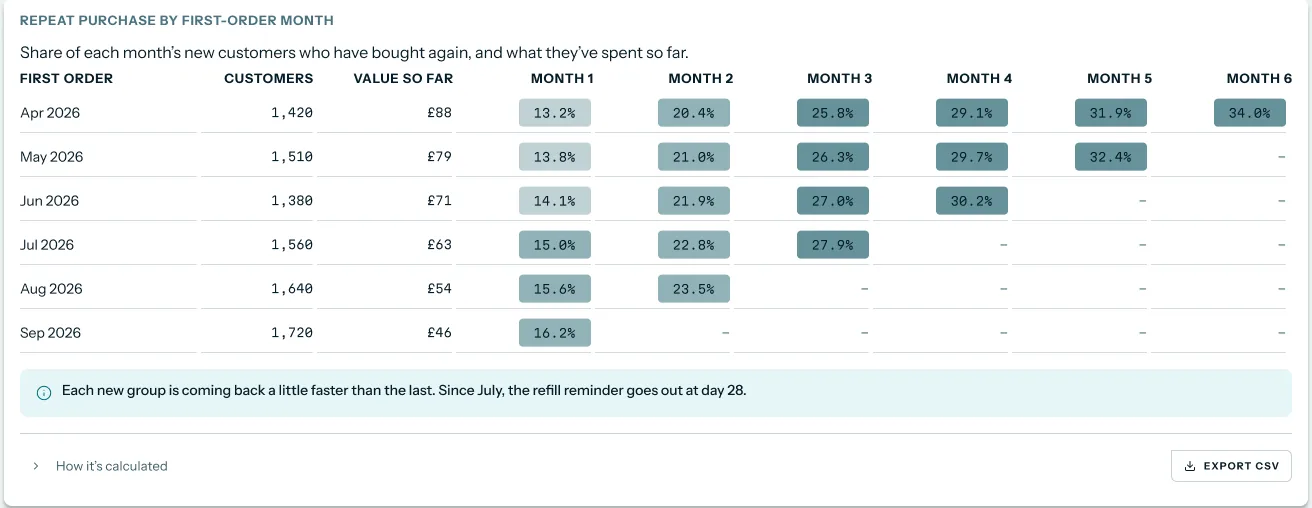
Open Numbers › Customers. The Repeat purchase by first-order month card lists one row per cohort. Each row shows the first-order month, the number of customers in it, their value so far, and a shaded cell for each month since they first bought.
 Illustrative example · demo brand
The cohort table for Fernlow, a demo brand. All figures are sample data. The note about a day-28 refill reminder describes the demo brand's own email flow, which Luca reads but never sends.
Younger cohorts have fewer cells filled in, because they haven't lived long enough to have a month 4 or a month 6. The darker the cell, the higher the share of that cohort who have bought again.
What it is not
A cohort here is defined by the month of the first order, not by the ad or campaign that brought a customer in. Luca doesn't assign a cohort to an ad, a creative or a campaign. If you want spend set against store revenue, the page on ROAS analysis for ecommerce covers that job. For retention more broadly, including segments and win-back, read customer retention analysis.
Why cohort retention matters
What it's for
Cohort retention analysis tells you whether each month's new customers keep buying. It lets you compare one intake with another at the same age. So you judge a month by how it holds up, not by how big it was.
How it helps
- Judges a promotion by its second order. A discount month that brings many first orders but few reorders shows up as a pale row.
- Shows when customers drop away. You can see whether a cohort falls off after the first box or slowly over a year.
- Points to the first product. Repeat-purchase rate by first product bought shows which entry products lead to a second order.
- Puts money beside the rate. Cohort revenue and orders show what each intake has been worth so far.
What happens without it
Without cohort retention, a big acquisition month looks like a success for as long as total orders stay high. A cohort that stops reordering after month 1 stays hidden inside the store's overall numbers. By the time revenue dips, several months of spend on that kind of customer have already gone out.
Why buyers care
Founders of subscription brands care most, because their growth depends on the second and third order, not the first. It matters most just after a big promotion. It matters again when you plan the next one and need to know whether the last one paid back.
The Luca AI approach to cohort retention
Picture the founder of a Shopify brand that sells protein snacks on subscription. Last January she ran a new-year discount and took in more new customers than in any month before. Her autumn customers had paid full price. Now she is planning next January, and she wants to know whether the discount customers kept buying as well as the autumn ones.
The usual answer is a spreadsheet. Someone exports every order, works out each customer's first order month, and builds a pivot table by month since first purchase. That often takes an afternoon, it tends to break on refunds and duplicate customers, and it is out of date by the next month.
Her question has a simple shape, though. She doesn't need a model or a forecast. She needs every January customer followed month by month, and the same for the autumn months, laid side by side at the same age.
Luca does that from her Shopify history. It groups every customer by the month of their first order and shows retention from month 1 to month 35. Each cohort's revenue and orders sit beside the rates. She can open the table on the Customers tab, or ask in chat how January compares with October at month 6.
The checkable fact is the length. Luca shows monthly acquisition cohorts with retention out to three years, which you can match against what other tools document. That comparison is covered in How Luca AI compares for cohort retention analysis, below.
How cohort retention gets measured
There are several ways to measure whether new customers come back. They answer slightly different questions, so it helps to know which one a table uses before you act on it.
Repeat purchase by month since first order
This counts the share of a cohort who have placed another order by month 1, month 2 and so on. It catches the moment a cohort stops reordering, which is what a subscription brand needs most. It misses how much those customers spend, so pair it with revenue.
Active in a given month
This counts only the customers who ordered in that exact month. It catches lapses: a customer who skips March shows as gone in March, even if they return in April. It can look noisy for products bought every six or eight weeks.
Fixed repurchase windows
This asks how many new customers bought again within 60 or 90 days of their first order. It gives one clean number per cohort, which is easy to track over time. It misses the shape: two cohorts can share a 90-day rate and fade very differently after that.
Value so far per customer
This divides a cohort's total revenue by the number of customers in it. It catches whether a cohort is worth more or less, even when repeat rates look alike. Shopify's guide to lifetime value warns you to compare cohorts over equal periods, so an older cohort doesn't look better just because it has had longer to buy.
Store-wide returning customer rates
Calendar-period measures such as the repeat customer rate and churn rate count all customers in a period at once. They are quick to read and good for a weekly pulse. They miss which intake is slipping, because every cohort is blended together.
What this means for your cohort table
Luca is confirmed to show monthly cohort retention from month 1 to month 35, a 60 and 90 day repeat-purchase rate, repeat-purchase rate by cohort and by first product bought, and each cohort's lifetime revenue and transactions. It also shows new against returning customers. Read the month columns for the shape, and the revenue for the money.
Read your cohort retention table
Start with the newest complete months and work back. The aim is to find the rows that sit lower than their neighbours at the same age.
Read down a column, then along a row
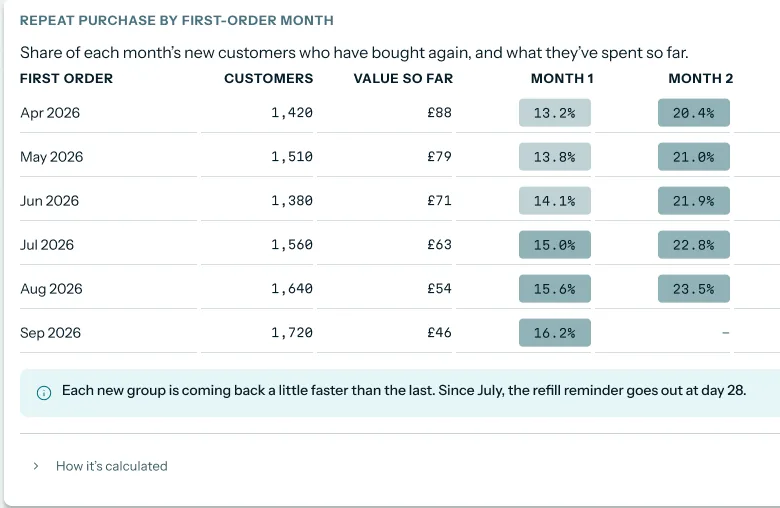
Read down a single column first. Month 1 for every cohort tells you which intakes came back fastest, at the same age. Then read along one row to see how that cohort keeps buying over time.
 Illustrative example · demo brand
A close-up of month 1 and month 2 for Fernlow, a demo brand, with sample figures. Reading down one column compares every cohort at the same age.
If a row is pale in month 1 but catches up by month 4, those customers come back late rather than never. If a row is pale in month 1 and stays pale, the problem sits in the first order.
Compare a discount cohort with a full-price cohort
Find the row for the month of your promotion and a full-price month with a similar number of customers. Compare them only in the columns both have reached. Then check value so far, because a discount cohort often starts with a smaller first basket.
Luca reads discounts and codes from Shopify and reports discount depth and discount-code usage. So you can ask in chat how many of January's first orders used the code before you blame the whole month on it. For a step-by-step method, the blog guide to customer cohort analysis walks through segmenting cohorts.
Find the cohorts that fade early
Look for a cohort whose month 1 rate sits several points below its neighbours. Then check month 3. If the gap stays the same size, the drop happened at the first reorder and held. If the gap widens, customers are leaving steadily, and the first box isn't the only issue.
Ask which first products they bought
Once you have a weak cohort, ask Luca for its repeat-purchase rate by first product bought. A snack brand might find that customers who started on a variety pack reorder far more often than those who started on one flavour. Shopify's own guide notes that some products don't lend themselves to repeat purchases, and this is how you find yours.
How to measure whether a cohort is holding up
Two measures carry most of the weight here: the repeat rate at a fixed age, and value so far per customer.
The two measures
The repeat rate at a fixed age, such as month 3, tells you how many of a cohort's customers came back. Value so far per customer tells you what they were worth. A cohort can do well on one and badly on the other, so read both.
Their weak spots
Young cohorts haven't reached later months yet, so you can only compare them in early columns. Small cohorts swing more, because a handful of customers moves the rate. And a cohort that took a large discount has a smaller first order, which pulls its value down before the first reorder. Shopify's guide adds that its own cohort projections need 24 months of store data, a reminder that forecasting a cohort needs long history.
Where Luca shows them
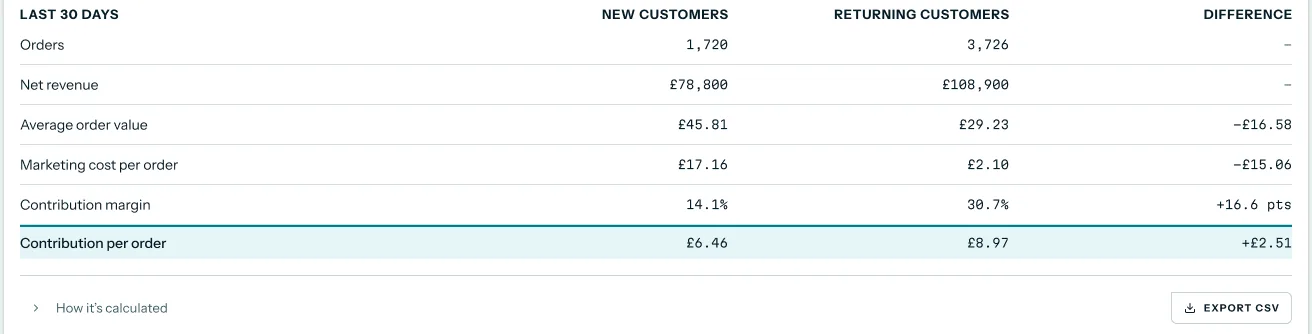
The month columns on the cohort table give the repeat rate at each age, and the Value so far column gives the money. Above it, a table compares new and returning customers on orders, net revenue, average order value, marketing cost per order and contribution margin.
 Illustrative example · demo brand
New against returning customer economics for Fernlow, a demo brand. All figures are sample data. It shows why a returning customer can be worth more per order than a new one.
Luca also reports average order value for first orders, days between orders and days since last order. Those help you tell a cohort that buys less often from one that has stopped.
How to build a cohort retention table for Shopify
You can build this by hand. It is worth doing once, so you know what the numbers mean.
The manual method
- Export every order from Shopify with the customer ID, the order date and the order total.
- Remove test orders and fully refunded orders, and merge duplicate records for the same customer.
- For each customer, find the date of their first order and label them with that month.
- For each later order, work out how many months it came after that customer's first order.
- Count, for each cohort and each month, how many customers have ordered again by then.
- Divide each count by the number of customers in the cohort to get the rate.
- Add up each cohort's revenue to date and divide by its customer count for value so far.
- Repeat the whole export next month, because the table goes stale as soon as new orders land.
The steps that go wrong most often are 2 and 3. A customer who checked out with two email addresses becomes two customers, and both look like one-time buyers.
The same job in Luca
Connect Shopify, and Luca builds the cohort table from your full order history. It refreshes once a day, overnight. Open Numbers › Customers to read it, or ask in chat, for example: "Compare the January cohort with October at month 6, with value so far." Each answer comes with figures, a chart where useful and next steps, and you can download the answer's data as CSV or Excel. The page on answers that join several sources explains how chat builds a reply.
A worked example: January discount against October full price
This is an illustrative calculation with sample figures, not a Luca output. It compares the October 2025 cohort, who paid full price, with the January 2026 cohort, who joined on a new-year discount. Both are old enough to have reached month 6.
| Measure | January 2026 cohort (discount) | October 2025 cohort (full price) |
|---|---|---|
| New customers | 2,000 | 800 |
| Bought again by month 1 | 500 ÷ 2,000 = 25% | 280 ÷ 800 = 35% |
| Bought again by month 3 | 700 ÷ 2,000 = 35% | 360 ÷ 800 = 45% |
| Bought again by month 6 | 800 ÷ 2,000 = 40% | 400 ÷ 800 = 50% |
| Revenue to month 6 | £100,000 | £56,000 |
| Value so far per customer | £100,000 ÷ 2,000 = £50 | £56,000 ÷ 800 = £70 |
The January cohort trails by 10 points in month 1, and the gap stays at 10 points through month 6. So the loss happens at the first reorder, not later. By month 6, each January customer is worth less than each October customer, as the last row shows. Yet January still gave the founder 800 repeat customers against October's 400. The next step is to ask which first products the January customers bought, and whether a different entry pack would lift that first reorder.
Get cohort retention running
- Connect Shopify from the Sources screen. It connects self-serve and read-only, and Luca reads your full history. The guide to setting up an AI analyst for Shopify walks through each step.
- Wait for the first overnight sync. After that, every source refreshes once a day.
- Open Numbers › Customers and find the Repeat purchase by first-order month card.
- Ask your first question in chat, such as which cohort has the lowest month 1 rate this year.
Cohort retention is standard: it is calculated for every brand that connects the relevant source. If you are worried about access, the page on read-only access explains what Luca can and can't touch.
How cohort retention works with the rest of Luca
Shopify
Shopify gives Luca orders, customers, products, refunds, discounts and codes, and selling plans. From those it builds new against returning customers, monthly cohorts to three years, historical lifetime value and bought-together analysis.
Amazon Seller Central
Connect Amazon Seller Central and Luca shows customer cohorts for that channel too, beside SKU economics after marketplace fees.
Recharge
For a subscription brand, Recharge adds active subscribers, monthly and 90-day churn, skip rate and retention by plan. Luca's team sets Recharge up for you. It sits well beside cohort retention when a cohort's drop is really a wave of skips.
Klaviyo
Luca's team sets up Klaviyo, read-only. It brings in campaigns, flows and Klaviyo's own predicted customer value and churn risk, so you can compare a weak cohort with the flows it received.
Xero and QuickBooks
With your books connected, an answer can combine store orders and the accounting ledger in one reply. That helps when you want a cohort's revenue set against what the business actually earned. The guide to KPI reporting shows how the same definitions carry into reports.
Chat
Every cohort figure can be asked about in plain English. Ratios such as LTV to CAC can be asked for directly, and Luca shows CAC by cohort. For a wider view of chat, read how an AI agent analyses your store.
Who uses cohort retention, and how
Founders and CEOs
A founder checks whether last quarter's biggest intake is still buying before approving the next promotion. One look down month 1 tells her whether the discount bought customers or just orders.
Subscription DTC brands
A subscription brand watches month 1 and month 2 most closely, because that is where first-box drop-off shows. Paired with Recharge churn and skip rates, it shows whether customers cancelled or simply paused.
Growth and marketing leads
A growth lead compares cohorts from different months to see which periods brought customers who stayed. They then ask for repeat rate by first product bought, to shape the next offer around an entry product that leads to a second order.
CFOs and finance leads
A finance lead uses value so far per customer and LTV to CAC by cohort to judge payback. The business overview each morning puts those figures next to sales and cash.
How Luca AI compares for cohort retention analysis
Luca groups customers by first-order month and follows each cohort for three years, with repeat rates by first product bought. It sets those cohorts beside new against returning economics and your Xero or QuickBooks ledger in the same answer. Luca AI is the only platform in this table that does all four.
Cohort retention analysis features, from each platform's public documentation:
| Platform | Luca AI | Lifetimely by AMP | Triple Whale | Shopify Sidekick | Daasity |
|---|---|---|---|---|---|
| Cohorts by first-order month | Yes | Yes (grouped by first order) | Yes (week, month or year of first order) | Yes (Customer cohort analysis report) | Yes (tracks cohorts and repurchase) |
| Repeat rate by first product bought | Yes | Yes (breakdown by product) | Partly (SQL example for second product) | Not in docs | Partly (first-order SKU table) |
| New against returning customers | Yes | Yes (new and returning cohorts) | Yes (Returning Customers %) | Yes (returning customer rate) | Yes (revenue from new customers) |
| Xero or QuickBooks in the same answer | Yes | Partly (QuickBooks cost and expense sync) | Not in docs | Not in docs | Not in docs |
Yes: documented and built in. Partly: documented with a limit, shown in brackets. Not in docs: not found in the vendor's public documentation.
Why Luca AI is the stronger choice for cohort retention analysis
- Your books sit beside your cohorts. Lifetimely groups customers by when they placed their first order, and its QuickBooks link syncs cost and expense data. Luca puts Xero or QuickBooks figures in the same answer as your cohorts. Compare more in Lifetimely alternatives.
- The first product is a built-in view. Triple Whale offers an SQL example for the most common second product. Luca shows repeat-purchase rate by first product bought without writing a query. See Triple Whale alternatives.
- Cohorts reach three years. Shopify's Customer cohort analysis groups customers by first order date. Luca follows each monthly cohort from month 1 to month 35 and adds repeat rate by first product. Read the Shopify reporting apps review.
- First-order products come ready to read. Daasity documents a first-order SKU lookup table for segmenting data. Luca shows the repeat rate by first product in the product and in chat. See Daasity alternatives.
Competitor details checked against each vendor's public documentation on 7 November 2026. Features and plans change, so confirm with the vendor before you decide.
Limits of cohort retention
- Cohorts are monthly and are set by the month of each customer's first order. Retention runs from month 1 to month 35.
- A cohort is defined by when a customer first bought, not by the ad, creative or campaign behind that order.
- Luca is read-only by design. It shows which cohorts fade but never changes your discount codes, store or email flows; you act on what you find.
- Recharge and Klaviyo are set up by Luca's team rather than connected self-serve.
- Sources refresh once a day, overnight, so today's orders appear in the table tomorrow.
Common questions
What is cohort retention?
Cohort retention is the share of a group of new customers who come back to buy again. In Luca, the group is everyone whose first order fell in the same month. Retention is then shown for each month after, from month 1 to month 35.
How far back does Luca's cohort retention go?
Luca shows retention from month 1 to month 35 for each monthly cohort, so roughly three years. It reads your full Shopify order history, so older cohorts appear as soon as the first sync finishes.
How do I compare a discount month with a full-price month?
Pick the two cohort rows and compare them only in the months both have reached. Then check value so far per customer, because a discount cohort usually starts with a smaller first order. You can ask chat to set the two side by side.
Can Luca tell me which ad brought a cohort in?
No. A cohort is grouped by the month of the first order, not by the ad or campaign behind it. To weigh ad spend against store revenue, use the ROAS and marketing views, which compare spend and platform-reported results with what your store recorded.
What does a pale month 1 cell mean?
A pale month 1 cell means few of that month's new customers bought again in their first month. If the row stays pale in later months, the problem is the first reorder. If it catches up by month 3 or 4, those customers simply buy less often.
Why do newer cohorts have empty cells?
A cohort that started in September can't have a month 6 yet in November. The empty cells fill in as the cohort ages. Always compare cohorts only in the columns they have all reached.
Can I see which first products bring customers back?
Yes. Luca shows repeat-purchase rate by cohort and by first product bought. Ask it for the products behind a weak cohort and compare their repeat rates with the products behind a strong one.
Does cohort retention show revenue as well as rates?
Yes. Luca shows each cohort's lifetime revenue and transactions, and historical customer lifetime value by acquisition cohort. Value so far per customer tells you whether a cohort is worth more, not just whether it returns.
Does it work for Amazon as well as Shopify?
Yes. When Amazon Seller Central is connected, Luca shows customer cohorts for that channel too. Shopify cohorts come from your Shopify order history.
How often does the cohort table update?
Every connected source refreshes once a day, overnight. A new order placed today appears in the cohort table after the next overnight refresh.
Do I need to set anything up for cohort retention?
No. Cohort retention is standard, so it is calculated for every brand that connects Shopify. Connecting Shopify is self-serve and read-only. Subscription data from Recharge and email data from Klaviyo are set up by Luca's team.
Can Luca change my discounts or send win-back emails?
No. Luca is read-only. It reads your store, discounts and email data but never writes to them. You decide what to change after reading the cohort table.
How is this different from Shopify's returning customer rate?
A returning customer rate counts all customers in a period together, whatever month they joined. Cohort retention keeps each month's new customers separate, so you can see which intake is slipping rather than one blended figure.
Updated 7 November 2026: first published, with how cohort retention gets measured, a manual method, a worked example comparing a discount cohort with a full-price cohort, and further reading.