
ROAS and marketing efficiency stop agreeing the month Meta reports a better return while the marketing efficiency ratio for the whole store falls. Someone then has to explain to the founder which number to trust. Luca AI is an ecommerce analytics platform with AI agents. It calculates the marketing efficiency ratio (MER), also called blended ROAS, as all revenue divided by all ad spend, and shows it beside the ROAS each platform reports for itself.
At a glance
| MER (blended ROAS) | All revenue ÷ all ad spend, for the whole business |
|---|---|
| Platform ROAS | The ROAS that Meta, Google Ads and Amazon Ads each report, per platform and per campaign. It is the platform's own count |
| Ad spend share | Ad spend as a share of revenue, the same two figures turned the other way up |
| Break-even ROAS | 1 ÷ gross margin, so you know the floor a return has to clear |
| Where the revenue comes from | Your store. Shopify is the record of what sold |
| Where the spend comes from | Your connected ad accounts: Meta, Google Ads and Amazon Ads |
| Where you see it | On Numbers › Marketing, and in chat when you ask |
| How fresh it is | Every source refreshes once a day, overnight |
| What it never does | Assign an order to an ad, or change your ad accounts. Luca only reads your data |
The short answer to the founder's question is this. Platform ROAS divides the revenue a platform claims by that platform's spend. MER divides the revenue your store actually took by everything you spent on ads. When the two move in opposite directions, MER is the one that matches your bank balance.
What ROAS and MER are in Luca
Luca reports ROAS per platform and campaign, plus blended marketing efficiency, which its feature sheet defines as "all revenue ÷ all ad spend". Both figures are part of the released product. They sit in the acquisition KPIs that Luca calculates as standard for every brand that connects the relevant sources.
The two numbers answer different questions. ROAS, in Luca's glossary, is attributed revenue divided by ad spend. The attribution behind it is the ad platform's own, so Meta's ROAS is Meta's count of the sales it believes its ads produced. MER ignores that question entirely. It asks only how much revenue the business took for each pound of ad spend.
What you see on the Marketing tab
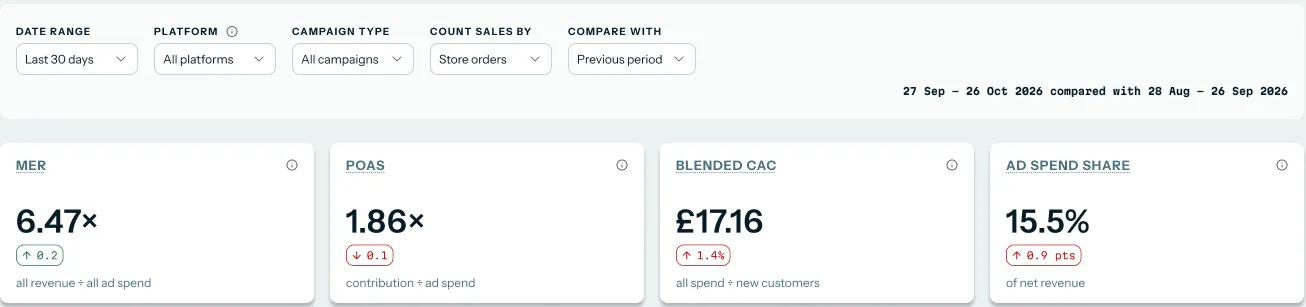
The Marketing tab sits under Numbers › Marketing, headed Which ad spend made money, after product costs and returns. Its top row of cards puts MER first, then POAS (profit on ad spend), blended CAC and ad spend share. Each card carries its formula underneath, so you can read how the figure is built without opening a definitions page.
 Illustrative example · demo brand
MER leads the row, with its formula printed under the figure and the change against the previous period beside it. The figures are sample data for a demo brand.
What it is not
MER is not an attribution model, and neither is anything else on this page. Luca does not decide which ad, campaign or platform produced a given order. When you see a ROAS figure for Meta or Google, it is what that platform reported. For the broader job of reading ROAS by channel and campaign against a break-even line, the ROAS analysis use case covers it.
Why ROAS and marketing efficiency matter
What it's for
ROAS and marketing efficiency tell you whether your ad spend is earning its keep. The marketing efficiency ratio answers that for the whole business, while platform ROAS answers it inside each ad account. You need both, and you need to know which revenue and spend sit inside each one.
How it helps
- One number the founder can check. MER uses store revenue, so it reconciles with the sales figure the founder already watches.
- Platform numbers kept in their place. Each platform's ROAS stays labelled as that platform's own count, so nobody mistakes it for banked revenue.
- Spend held against margin. Break-even ROAS turns your gross margin into the lowest return worth paying for.
- A budget ratio finance understands. Ad spend as a share of revenue reads like any other cost line.
What happens without it
Budget follows whichever dashboard looks best that week. Each platform can report a rising return while the store's revenue stays flat, and spend keeps growing on the strength of it. By the time margin shows the problem, the month is already spent.
Why buyers care
Heads of growth care most at month end, when the founder or the CFO asks why the ad numbers and the sales numbers disagree. Founders care when they set next quarter's ad budget, because that budget should rest on revenue the store actually banked.
The Luca AI approach to ROAS and marketing efficiency
Picture the head of growth at a Shopify footwear brand selling trainers and walking boots. Last month Meta Ads Manager showed ROAS up on the month before. The founder's own view showed the marketing efficiency ratio down. She now has to explain, in one meeting, how both can be true.
The usual answer is a spreadsheet. Someone exports spend from each ad account and revenue from Shopify, then lines up the dates by hand. That can take an afternoon each month, and a mismatched date range or a forgotten account can quietly skew the result.
The gap itself is not a mystery. Each platform counts a sale under its own rules, including its own window after a click or a view. Two platforms can count the same order, while MER counts each order once. So platform ROAS can rise because the platform is claiming more, even when the store is taking less.
Luca does that arithmetic every night from your connected sources. It calculates MER from all revenue and all ad spend, and shows ROAS per platform and campaign beside it. It reads Shopify as the record of what sold and reads spend from Meta, Google Ads and Amazon Ads. It changes nothing in any of those accounts.
On the Marketing tab, the MER card prints its formula, all revenue ÷ all ad spend, under the figure. How that compares with other analytics tools is covered in How Luca AI compares for ROAS and marketing efficiency, below.
How ROAS and MER are calculated
There are four common ways to measure whether ad spend pays. Each one puts a different revenue figure over a different spend figure, which is why they disagree.
Platform-reported ROAS
ROAS is revenue attributable to ads divided by what the ads cost. The platform decides what counts as attributable. By default, Meta credits a sale within 24 hours of a view or 28 days of a click, while Google Ads counts actions within 30 days of a click. It catches how one campaign performs against another inside the same account. It misses overlap: two platforms can both claim one order, and neither knows about the other.
Marketing efficiency ratio, or blended ROAS
MER puts total revenue over total marketing spend. Every order counts once, whatever the customer clicked, so platforms cannot inflate it. It catches whether the whole ad budget is paying for itself. It misses which campaign is responsible, and it includes revenue from repeat and organic buyers who would have bought anyway.
Ad spend as a share of revenue
This is MER turned the other way up: ad spend divided by revenue, shown as a percentage. An MER of 5.0 is the same as ad spend at 20% of revenue. It catches budget creep in the language of a cost line, which suits a finance review. It misses the same things MER misses.
Multi-touch attribution
Multi-touch models split credit for one sale across several touchpoints. They need volume: Google Ads suggests at least 200 conversions and 2,000 ad interactions in a 30-day period for its data-driven model. They also rely on tracking that privacy law makes subject to consent. They catch the path a buyer took, when the data holds up.
What Luca calculates
Luca calculates MER, ad spend as a share of revenue and break-even ROAS from your own data. It shows each platform's ROAS per platform and campaign as the platform reports it. It does not run an attribution model of its own, so it never reassigns a sale between platforms.
Explain a rising platform ROAS and a falling MER
This is the conversation the page exists for. Work through it in this order, so the founder sees the store's numbers before any platform's.
Start from what the store took
Open Numbers › Marketing and set the date range to the month in question, compared with the month before. Read MER and ad spend share first. If MER fell, either revenue fell, spend rose, or both. Your Shopify revenue settles which, and the see-the-whole-business view puts that revenue next to profit and cash.
Read each platform's own ROAS
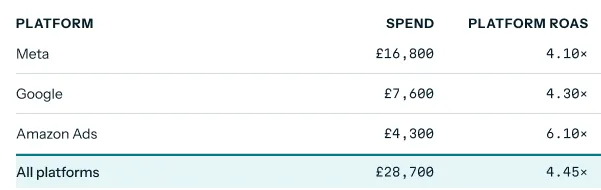
Then look at spend and ROAS per platform. Treat each ROAS as a claim made by that platform under its own rules. A platform whose spend rose and whose reported ROAS rose, while MER fell, is claiming revenue the store did not gain.
 Illustrative example · demo brand
Spend and the ROAS each platform reports for itself, side by side, so you can see whose spend moved. The figures are sample data for a demo brand.
Ask the follow-up in chat
Ask Luca the question the founder asked: "Why did MER fall last month when Meta ROAS went up?" Luca answers with figures, a chart where useful and next steps, with each figure linked to the table it came from. An answer can combine ad spend, store orders and the accounting ledger in one reply, as described in answers across your sources.
How to measure marketing efficiency month to month
Two measures do this job: MER and ad spend as a share of revenue. Both are only as good as the definitions you hold steady from month to month.
Where the measures go wrong
The revenue definition matters first. Shopify's own guide notes that total sales, net sales and attributed revenue can give different results, so pick one and keep it. The spend definition matters next, because some teams count only media while others add creative, agencies and salaries. Last, revenue and spend must cover the same dates. A month of spend over three weeks of revenue makes MER look worse than it is.
Where Luca shows them
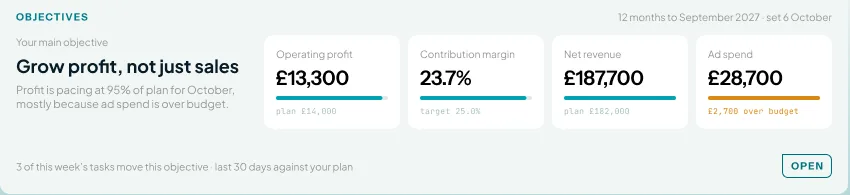
Luca uses its default metric definitions for every customer, or the brand's own definitions set with the Luca team. On Numbers › Definitions, headed How every number is worked out, you can read the formula behind each figure. Hovering a metric name elsewhere shows its definition. Net revenue and ad spend also appear on the Control home screen, as tiles beside your main objective.
 Illustrative example · demo brand
Net revenue and ad spend, the two inputs behind MER, sit together against your plan on the home screen. The figures are sample data for a demo brand.
If your KPI reporting pack already defines revenue one way, ask the Luca team to match it, so the board sees one MER rather than two.
How to calculate MER and compare it with platform ROAS
The manual method
- Pick the period, such as last month, and use the same dates for revenue and spend.
- Take revenue for that period from Shopify, using one definition (total sales or net sales) every time.
- Add up ad spend for the same dates from every ad account: Meta, Google Ads and Amazon Ads.
- Divide revenue by ad spend. That is MER. Divide spend by revenue for ad spend as a share of revenue.
- Pull each platform's reported revenue and spend, and divide one by the other for platform ROAS.
- Repeat for the month before, then compare the direction of each figure.
- Work out break-even ROAS as 1 ÷ gross margin, and check each figure against it.
The same job in Luca
Luca reads your store and ad accounts every night, so steps 2, 3 and 4 are done before you open Numbers › Marketing. Choose the date range and the comparison period, then read MER, ad spend share and each platform's ROAS together. If you want the raw figures, you can download an answer's data as CSV or Excel and check the arithmetic yourself.
A worked example: Meta ROAS up, MER down
This is an illustrative calculation with sample figures, not a Luca output. A footwear brand compares September with October.
| Line | September | October | How it's worked out |
|---|---|---|---|
| Store revenue (Shopify) | £300,000 | £290,000 | What the store took |
| Meta spend | £40,000 | £50,000 | From Meta |
| Google Ads spend | £20,000 | £20,000 | From Google Ads |
| Total ad spend | £60,000 | £70,000 | Meta + Google |
| Revenue Meta reports | £120,000 | £175,000 | Meta's own count |
| Meta ROAS | 3.0x | 3.5x | £120,000 ÷ £40,000; £175,000 ÷ £50,000 |
| MER (blended ROAS) | 5.0x | 4.1x | £300,000 ÷ £60,000; £290,000 ÷ £70,000 |
| Ad spend share | 20% | 24% | £60,000 ÷ £300,000; £70,000 ÷ £290,000 |
| Change in store revenue per extra £1 of spend | -£1.00 | -£10,000 ÷ +£10,000 | |
| Break-even ROAS at 50% gross margin | 2.0x | 2.0x | 1 ÷ 0.50 |
Meta's spend rose by a quarter, and the revenue it reports rose by almost half. The store, meanwhile, took less than it did in September. Both MER and Meta's ROAS still clear break-even, so the brand is not losing money on ads. But the extra Meta spend bought no extra revenue, and that is the line to show the founder.
Get your ROAS and MER figures
- Connect Shopify. It is self-serve and read-only, and it supplies the revenue side.
- Connect Google Ads and Amazon Ads. Both are self-serve.
- Connect Meta. Some accounts connect by OAuth, and others through a guided partner-access setup with the Luca team.
- Agree your metric definitions with the Luca team if you don't want Luca's defaults.
- Open Numbers › Marketing after the first overnight refresh.
The set-up guide walks through connecting each source, and read-only access explains what Luca can and can't see. Your Numbers dashboard is built for your brand by the Luca team and refreshed every morning.
How ROAS and MER work with the rest of Luca
Shopify
Shopify is the record of what sold. Luca reads orders, line items, customers, products and refunds from it, and store revenue on the MER card comes from here.
Amazon Seller Central
Luca reads SKU economics after marketplace fees from Seller Central. That gives you gross margin by product, which feeds break-even ROAS for brands that also sell on Amazon.
Meta, Google Ads and Amazon Ads
Luca reads spend, clicks, conversions and conversion value from Meta. From Google Ads it reads campaign, keyword and Shopping results split by campaign type. From Amazon Ads it reads Sponsored Ads by campaign, keyword and placement. The ROAS on each comes from the platform's own conversion value.
Xero and QuickBooks
With an accounting ledger connected, Luca adds gross and operating margin. That lets you set MER against the margin your accountant reports, not only the store's figure. The revenue forecast uses the same store history when you plan next quarter's spend.
Chat
Any ratio between these figures can be asked for in chat, calculated from the same data. That includes MER for one week, or ad spend share for a single product range.
Who uses ROAS and MER, and how
Growth and marketing leads
A head of growth reads MER before each platform's ROAS at month end. She brings both to the founder, with the gap explained in pounds rather than in platform jargon. The AI agents for ecommerce page shows how the same questions run in chat.
Founders and CEOs
A founder sets next quarter's ad budget from MER and ad spend share, because both rest on revenue the store banked. Platform ROAS then guides where inside that budget the money goes.
CFOs and finance leads
A finance lead treats ad spend share like any other cost line in the monthly pack. With Xero or QuickBooks connected, the same review shows gross and operating margin beside it.
How Luca AI compares for ROAS and marketing efficiency
Luca works out MER from store revenue and all ad spend, and keeps each platform's ROAS beside it as the platform's own figure. It adds break-even ROAS from your gross margin and your accounting ledger in the same place. Luca AI is the only platform in this table that does all four.
ROAS and marketing efficiency features, from each platform's public documentation:
| Platform | Luca AI | Triple Whale | Northbeam | Lifetimely by AMP | Daasity | Shopify Sidekick |
|---|---|---|---|---|---|---|
| MER (all revenue ÷ all ad spend) | Yes | Yes (MER and Blended ROAS) | Yes (blended MER) | Partly (combined platform values) | Yes (total revenue to total marketing spend) | Not in docs |
| ROAS per platform | Yes | Partly (pixel-attributed by channel) | Partly (from its own attributed revenue) | Yes (across connected platforms) | Yes (rolled up to channel and vendor) | Yes (ROAS in marketing reports) |
| Break-even ROAS | Yes | Not in docs | Not in docs | Not in docs | Not in docs | Not in docs |
| Xero or QuickBooks ledger | Yes | Not in docs | Not in docs | Yes (QuickBooks cost sync) | Not in docs | Not in docs |
Yes: documented and built in. Partly: documented with a limit, shown in brackets. Not in docs: not found in the vendor's public documentation.
Why Luca AI is the stronger choice for ROAS and marketing efficiency
- Each platform's ROAS stays the platform's own. Luca shows ROAS per platform as each one reports it, beside MER. Triple Whale's channel ROAS comes from its own pixel attribution. See Luca AI and other Triple Whale alternatives.
- A floor for every return. Luca works out break-even ROAS as 1 ÷ gross margin. Daasity's metric glossary defines MER but documents no break-even ROAS. See Luca AI and other Daasity alternatives.
- MER from store revenue, not combined claims. Luca divides all revenue by all ad spend. Lifetimely's blended figures combine values across the selected platforms. See Luca AI and other Lifetimely alternatives.
Competitor details checked against each vendor's public documentation on 29 October 2026. Features and plans change, so confirm with the vendor before you decide.
Limits of ROAS and MER in Luca
- No attribution model. Luca does not assign an order, sale or customer to an ad, campaign or platform. Each platform's ROAS is that platform's own count.
- MER covers the whole business. By design it cannot tell you which campaign is responsible for a change. Use platform ROAS for that, read as each platform's claim.
- Figures run a day behind. Every source refreshes once a day, overnight, so today's spend shows tomorrow.
- Read-only. Luca reads your ad accounts and store and writes to none of them. You change budgets in each ad platform yourself.
- Definitions are set with the team. Changing which revenue or spend counts is agreed with the Luca team rather than edited on the card.
Common questions
What is the marketing efficiency ratio?
The marketing efficiency ratio (MER) is total revenue divided by total ad or marketing spend for a period. It tells you how much revenue the whole business took for each pound spent on advertising.
How do you calculate MER?
Take revenue for a period, then divide it by ad spend for the same dates. Revenue of five times your ad spend gives an MER of 5.0. Keep the same revenue and spend definitions every month.
Is MER the same as blended ROAS?
Yes, in practice the two names describe the same calculation: all revenue over all ad spend. Luca labels it MER on the Marketing tab and calls it blended marketing efficiency in its feature list.
What is the difference between ROAS and MER?
ROAS divides the revenue an ad platform attributes to its ads by that platform's spend. MER divides all revenue by all ad spend. ROAS compares campaigns inside one account, while MER judges the whole ad budget.
Why can Meta ROAS rise while MER falls?
Meta counts sales under its own rules, including a window after a view or a click. It can claim more revenue while the store takes less. MER counts each store order once, so it shows the drop.
Which revenue goes into MER in Luca?
Luca uses all revenue, with Shopify as the record of what sold. Your exact revenue definition is either Luca's default or your own, agreed with the Luca team. The Definitions tab shows the formula.
Which spend goes into MER in Luca?
MER uses the ad spend Luca reads from your connected ad accounts: Meta, Google Ads and Amazon Ads. If you want other marketing costs counted, agree the definition with the Luca team.
What is ad spend as a share of revenue?
It is ad spend divided by revenue, shown as a percentage. It is MER turned the other way up, so an MER of 4.0 equals ad spend at 25% of revenue.
What is a good MER for an ecommerce brand?
It depends on your margins and on what you count as spend. A brand with a 60% gross margin can live with a lower MER than one at 30%. Your own break-even ROAS is the more useful floor.
How is break-even ROAS worked out?
Break-even ROAS is 1 divided by your gross margin. At a 50% gross margin, ads must bring in twice what they cost just to cover product costs.
Does Luca have an attribution model?
No. Luca has no attribution model and never assigns an order to an ad, campaign or platform. It shows each platform's ROAS as that platform reports it, beside MER from your store revenue.
How often do ROAS and MER update?
Every source refreshes once a day, overnight. Your Numbers dashboard is refreshed every morning, so the figures you read cover data up to the previous day.
Can Luca change my ad budgets?
No. Every connector is read-only. Luca reads from each connected system and writes to none of them, so budget changes stay in each ad platform, made by you.
Can I ask about MER in chat?
Yes. Any ratio between these figures can be asked for in chat and is calculated from the same data. Each figure in the answer links to the table it came from.
Updated 7 November 2026: first published, with how ROAS and MER are calculated, how to measure marketing efficiency month to month, the manual method with a worked example and further reading.