
Profitable ad spend is the question behind every healthy-looking ROAS report: does the money you spend on ads come back once product costs are paid? The first answer is break-even ROAS, which is one divided by your gross margin. Luca AI, an e-commerce analytics platform with AI agents, works that figure out from your Shopify and cost data. It then sets your ad spend against contribution margin after fees and returns, so you see which spend makes money.
At a glance
| The formula | Break-even ROAS = 1 ÷ gross margin. A 40% gross margin needs a ROAS of 2.5 just to break even |
|---|---|
| What Luca calculates | Break-even ROAS, ROAS by platform and campaign, MER and ad spend as a share of revenue |
| The stricter test | Ad spend set against contribution margin, after product costs, fees and returns |
| Margins it uses | Gross margin by product, variant and SKU, with returns and refunds taken out |
| Ad results | Each platform's own reported results from Meta, Google Ads and Amazon Ads |
| Where you see it | In chat, and on Numbers › Marketing and Numbers › Profit |
| Cost data | Your own cost rules for product cost, shipping and fees, set during onboarding |
| Who sets up contribution views | Luca's team, with your brand |
| What it never does | Change your ad budgets, campaigns or store. Luca only reads your data |
If your ROAS sits below your break-even ROAS, every pound of ad spend loses money before fees and returns are even counted. If it sits just above, fees and returns can still tip it into a loss. The rest of this page shows how to check both.
What profitable ad spend means here
Ad spend is profitable when the margin it brings back is larger than the spend itself. Platforms report ROAS as revenue over spend, and revenue is not profit. A brand on thin margins can show a healthy ROAS and still lose money on every order the ads bring in.
Luca answers the question in two steps. It works out break-even ROAS as 1 ÷ gross margin, a standard KPI for every brand that connects its store. It then compares ROAS with contribution margin, the money left after product costs, fees and returns, so you see which spend actually makes money.
What you see
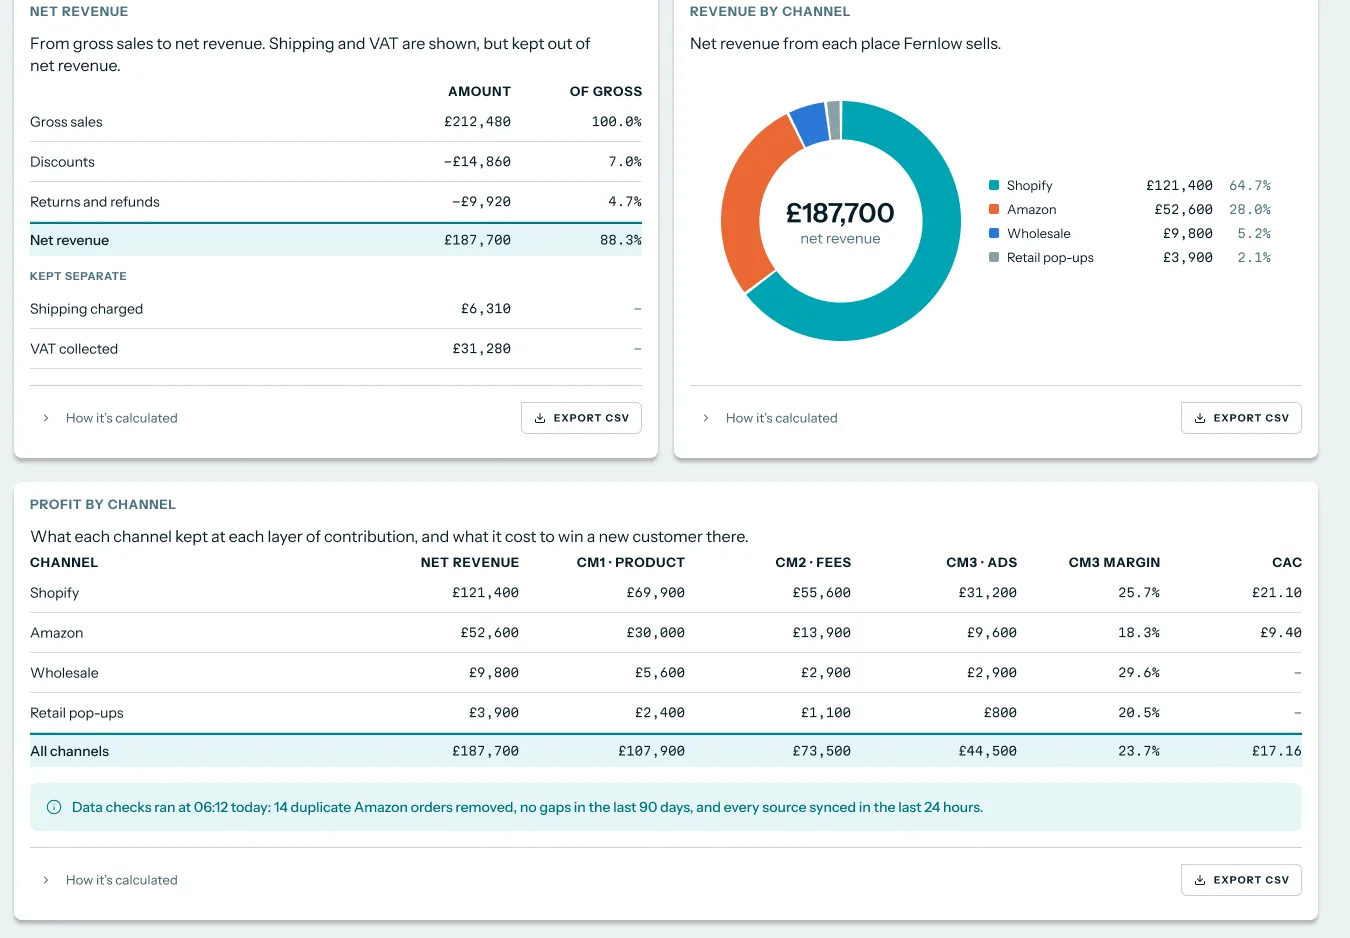
The Marketing tab is headed Which ad spend made money, after product costs and returns. The Profit tab is headed What each product, channel and month actually made. Between them they show your ad spend, the ROAS each platform reports, and the margin each sales channel keeps at each layer of cost.
 Illustrative example · demo brand
The Profit by channel card shows margin after product costs, then fees, then ad spend, which is where thin-margin ad spend gets caught. The figures are sample data for a demo brand.
What it is not
It is not an attribution model. Luca reads the results each ad platform reports and does not decide which ad earned which order. Break-even by product range means setting a range's gross margin against the ROAS the platform reports, not reassigning sales.
Why profitable ad spend matters
What it's for
It tells you whether your ads pay for themselves once product costs, fees and returns come out. It turns a ROAS figure into a yes or no on profit.
How it helps
- A floor for every range. Break-even ROAS shows the lowest return each margin can live with.
- Fees and returns counted. Contribution margin takes out the costs a gross margin leaves in.
- One set of definitions. The same margin and ROAS definitions sit behind chat, dashboards and exports.
- Answers in plain English. You ask about ad profit in chat and get figures with links to their source tables.
What happens without it
You judge ads on revenue. Spend keeps flowing to campaigns that sell low-margin products, and the loss shows up weeks later as a thinner bank balance. By then the stock is sold and the spend is gone.
Why buyers care
Founders of thin-margin brands care most, because a small gap between ROAS and break-even decides whether growth makes or costs money. It matters most before a budget increase, and whenever an agency report and the bank balance tell different stories.
The Luca AI approach to profitable ad spend
Picture the founder of a Shopify brand that sells bike accessories: lights, locks and bags. Margins are thin, and an agency runs the Meta and Google ads. Every month the agency reports a healthy ROAS. Every month the bank balance says something else, and the founder wants to know where break-even sits for each range.
The usual workaround is a spreadsheet. The founder copies the agency's ROAS figures, exports orders and refunds from Shopify, and looks up product costs by hand. It can take an evening, and the margins in it may already be out of date by the time the next report lands.
What changed is that the gap is now the whole story. On thin margins, the difference between a ROAS of 3 and a break-even of 3.3 decides whether ads make or lose money. A revenue figure can't show that gap, and a monthly spreadsheet shows it too late.
Luca AI reads your store, your ad platforms and your cost rules every night. It works out break-even ROAS from your gross margin. It takes returns and refunds out of revenue and margin, down to product level. Then it sets ROAS against contribution margin. You ask "where is break-even for our bags?" and get the figure with a link to its source table.
Break-even ROAS is a standard KPI for every brand that connects its store. Which other platforms document it is covered in How Luca AI compares for profitable ad spend, below.
Find break-even ROAS for each product range
Your ranges rarely share a margin. Lights might carry a fair margin while bags, with heavy freight and frequent returns, carry much less. One blended break-even figure hides that.
Start by asking Luca for gross margin by product, then group the products into your ranges. Gross profit and gross margin by product, variant and SKU are standard KPIs, so the figures come from your own Shopify data and cost rules. Then ask for break-even ROAS for each range. Any ratio between Luca's figures can be asked for directly in chat, and the cross-source answer shows which tables it used.
Next, set each range's break-even beside the ROAS its platform reports. This only works when your campaigns are split by range, so check how your agency has built them first. If one campaign sells all three ranges, its ROAS can only be judged against your blended break-even.
Write your margin goal into business context
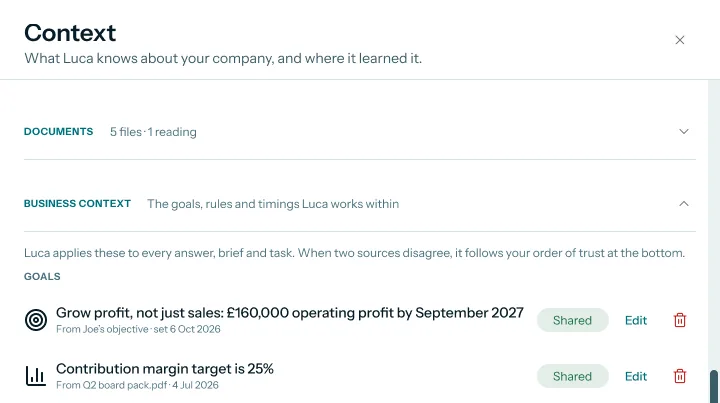
Luca holds goals, constraints and cost rules as business context, and applies them to every answer. A contribution margin target written there gives every answer about ad spend the same yardstick.
 Illustrative example · demo brand
A contribution margin target in business context lets Luca judge ad spend against your goal, not a generic benchmark. The figures are sample data for a demo brand.
Read ad spend against contribution margin
Break-even ROAS tells you the floor. Contribution margin tells you what is left after you clear it. Read it in this order.
- Open Numbers › Profit and find the channel table.
- Read margin after product costs first. This is where gross margin and break-even ROAS come from.
- Read margin after fees. Payment and marketplace fees and shipping come out here, and thin ranges shrink fast.
- Read margin after ads. If it is close to zero, more spend at the same ROAS won't help.
- Check returns and refunds. Luca takes them out of revenue and margin down to product level, and shows return and refund rates by product.
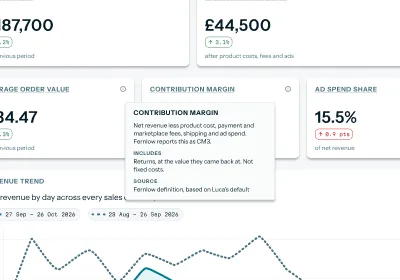
Hover over a metric to see how it is defined. Contribution margin, for example, is net revenue less product cost, payment and marketplace fees, shipping and ad spend.
 Illustrative example · demo brand
The definition shows exactly which costs come out before ad spend is judged, so the margin can't quietly leave fees out. The figures are sample data for a demo brand.
Check the definitions before you trust the figure
Most arguments about ad profit are really arguments about definitions. Luca uses its own default definitions for every customer, with your brand's definitions set on top with Luca's team. Our KPI reporting guide covers how one set of definitions carries through chat, dashboards and exports.
How to measure the gap to break-even
Two measures tell you whether ad spend is safe. They are the gap between ROAS and break-even ROAS, and contribution left after ad spend.
The break-even gap
Subtract break-even ROAS from the ROAS the platform reports. A positive gap means ads cover product cost. The weak spot is that the platform's ROAS uses its own attribution window, and gross margin ignores fees. Treat a small positive gap as a warning, not a pass.
Contribution after ad spend
Take contribution margin before ads, in pounds, and subtract ad spend. A negative figure means the ads cost more than the margin they brought back. The weak spot is the split of spend: unless your campaigns are split by range or channel, the spend can only be judged in total.
Where Luca shows them
Break-even ROAS and ROAS by platform and campaign sit with your other acquisition KPIs. Contribution margin, contribution per order and contribution by month and by channel come with the contribution views Luca's team sets up. Ask in chat for either measure and the answer links each figure to the table it came from.
How to work out break-even ROAS
The manual method
- Export net sales for each range from Shopify, after discounts, returns and refunds.
- Add up product cost for the units sold in each range.
- Work out gross margin: net sales minus product cost, divided by net sales.
- Divide 1 by that margin. That is the range's break-even ROAS.
- Subtract fees and shipping for the range and repeat steps 3 and 4. That gives a stricter break-even.
- Copy the ROAS each platform reports for the campaigns behind each range.
- Compare the two, and subtract ad spend from contribution to see what was left.
The hard part is steps 1 to 3. Shopify's net sales are gross revenue minus returns and discounts, but product cost and fees often live in other places. They go stale between exports.
The same job in Luca
You connect Shopify, your ad platforms and your accounting system once. Luca reads them every night and works out gross margin by product, break-even ROAS and ROAS by platform and campaign. With contribution views set up, it also sets ad spend against contribution margin after fees and returns. You ask the question in chat, or read the Marketing and Profit tabs. Every answer comes with figures, a chart where useful, next steps and a link to each source table.
A worked example: three ranges, one healthy ROAS
This is an illustrative calculation with sample figures, not a Luca output. The bike-accessories brand spends a month on ads, with a separate campaign for each range.
| Lights | Locks | Bags | All ranges | |
|---|---|---|---|---|
| Net sales after returns | £10,000 | £8,000 | £6,000 | £24,000 |
| Product cost | £5,000 | £4,800 | £4,200 | £14,000 |
| Gross margin | 50% | 40% | 30% | 41.7% |
| Break-even ROAS (1 ÷ gross margin) | 2.0 | 2.5 | 3.3 | 2.4 |
| Fees and shipping | £1,000 | £800 | £600 | £2,400 |
| Margin after fees | 40% | 30% | 20% | 31.7% |
| Stricter break-even (1 ÷ margin after fees) | 2.5 | 3.3 | 5.0 | 3.2 |
| ROAS the platform reports | 3.2 | 2.8 | 3.0 | 3.0 |
| Ad spend | £3,000 | £2,800 | £2,000 | £7,800 |
| Contribution after ad spend | £1,000 | -£400 | -£800 | -£200 |
The agency's blended ROAS of 3.0 clears the blended gross break-even of 2.4, so the report looks healthy. After fees, only lights clear their break-even. Locks pass the gross test but fail the stricter one, and bags fail both. Together the three ranges lose money, which is what the bank balance was saying.
The next step is a decision, not a formula. You might move bag spend to lights, raise bag prices, or ask the agency to target a ROAS of 5 on bags.
Get break-even ROAS and contribution views set up
- Connect Shopify. It connects self-serve and read-only, and it is the record of what sold, including refunds and returns.
- Connect your ad platforms. Google Ads and Amazon Ads connect self-serve. Meta connects through guided partner access with Luca's team.
- Connect Xero or QuickBooks if you use them. Both connect self-serve.
- Agree your cost rules with Luca's team during onboarding: product cost, shipping, fees and overheads.
- Ask Luca's team to set up contribution views, including contribution margin by channel and by month.
Our set-up guide walks through connecting sources and inviting your team.
How profitable ad spend works with the rest of Luca
Shopify
Shopify supplies orders, products, refunds and returns, and payments, payouts and fees. That is the base for net sales and gross margin by product. Luca reads it read-only.
Meta, Google Ads and Amazon Ads
Meta supplies spend, clicks, conversions and conversion value down to campaign and ad. Google Ads, including YouTube, supplies results by campaign type. Amazon Ads supplies Sponsored Ads by campaign, keyword and search term. Each platform's results arrive as that platform reports them.
Amazon Seller Central
If you sell on Amazon, Seller Central adds SKU economics after marketplace fees. Amazon net proceeds per unit after fees is a standard KPI, so marketplace margin feeds the same break-even sums.
Xero and QuickBooks
With your ledger connected, gross, operating and net margin come from your accounts. An answer can combine ad spend, store orders and the ledger in one reply, which helps when you want sales, ads, profit and cash in one place.
Chat and forecasts
Ask a what-if such as "ad spend +20%" to see the effect of a bigger budget. The revenue forecast shows what that spend is working towards. For the wider set of numbers to watch alongside ad profit, read our list of ecommerce KPIs that determine profitability.
Who uses profitable ad spend checks, and how
Founders and CEOs
A founder checks break-even by range before agreeing a bigger budget with the agency. The question is simple: which ranges can take more spend without losing money? Our page on AI agents for ecommerce shows the other questions founders hand to Luca.
CFOs and finance leads
A finance lead reconciles ad spend with the ledger at month end. Contribution margin after fees and returns gives them a profit figure for marketing they can stand behind. The KPI reporting guide covers the monthly pack.
Growth and marketing leads
A growth lead sets ROAS targets per campaign from each range's break-even, not from a blanket target. When a range's margin falls, its target rises. Retention matters too, since repeat buyers lower the cost of each sale; our retention analysis guide covers which products bring buyers back.
Operations and inventory leads
An operations lead watches which ranges ads are pushing, so stock keeps up with profitable demand. The demand forecasting guide covers forecasting each product before you reorder.
How Luca AI compares for profitable ad spend
Luca works out break-even ROAS from your gross margin and sets ad spend against contribution margin after fees and returns. It reads your accounting ledger alongside your store and ad platforms. Luca AI is the only platform in this table that does all four.
Profitable ad spend features, from each platform's public documentation:
| Platform | Luca AI | Triple Whale | Daasity | Lifetimely by AMP | Shopify |
|---|---|---|---|---|---|
| Break-even ROAS from gross margin | Yes | Not in docs | Not in docs | Not in docs | Not in docs |
| Contribution margin after fees and returns | Yes | Partly (revenue less fulfilment and ad spend) | Yes (shipping, payment processing and platform fees) | Partly (net sales less COGS and marketing) | Not in docs |
| Ad spend set against contribution margin | Yes | Yes (POAS on blended ad spend) | Not in docs | Not in docs | Not in docs |
| Accounting ledger in the same place | Yes | Not in docs | Not in docs | Partly (QuickBooks expense categories) | Not in docs |
Yes: documented and built in. Partly: documented with a limit, shown in brackets. Not in docs: not found in the vendor's public documentation.
Why Luca AI is the stronger choice for profitable ad spend
- Break-even sits next to ROAS. Luca calculates break-even ROAS from your gross margin as a standard KPI. Triple Whale documents POAS as total sales less total costs over blended ad spend, a profit ratio with no break-even line. See Triple Whale alternatives.
- Fees come out before ads are judged. Luca's contribution margin is after product costs, fees and refunds. Triple Whale's product table defines contribution margin as order revenue less fulfilment costs and ad spend. See Triple Whale alternatives.
- Your cost data comes from your systems. Luca reads Xero or QuickBooks beside Shopify and your ad platforms. Daasity's contribution margin uses a Google Sheet workbook for cost inputs. See Daasity alternatives.
Competitor details checked against each vendor's public documentation on 8 November 2026. Features and plans change, so confirm with the vendor before you decide.
Limits of profitable ad spend checks
- No attribution model. Ad results are each platform's own reported figures. Luca does not assign orders, sales or customers to a campaign, ad, product or creative.
- Break-even by range depends on your campaigns. Comparing a range's break-even with platform ROAS needs campaigns split by range.
- Contribution views are set up with Luca's team. Cost rules are agreed during onboarding, and contribution views are built per client.
- Read-only. Luca reads your store, ad accounts and ledger, and writes to none of them. Budget changes stay with you or your agency.
- Daily data. Every source refreshes once a day, overnight, so figures reflect yesterday.
Common questions
What is break-even ROAS?
Break-even ROAS is the return on ad spend at which ad revenue just covers the product cost of what sold. Below it, ads lose money before fees and returns are counted. Luca calculates it as a standard KPI for brands that connect their store.
How do I calculate break-even ROAS?
Divide 1 by your gross margin as a decimal. A 40% margin gives 1 ÷ 0.4 = 2.5, so you need 2.5 in revenue for every 1 of ad spend. Use margin after returns and discounts, not list-price margin.
Is there a break-even ROAS calculator in Luca?
You don't type figures in. Luca works out break-even ROAS from your gross margin, using your Shopify data and cost rules. For a quick check by hand, divide 1 by your gross margin.
Why does my agency report a healthy ROAS while my bank balance falls?
ROAS counts revenue, not profit. If your margin is thin, a ROAS that looks healthy can sit below break-even. Fees, shipping and returns then take more. Compare ROAS with break-even ROAS, and set ad spend against contribution margin.
What is the difference between gross margin and contribution margin?
Gross margin takes out product cost only. Contribution margin also takes out payment and marketplace fees, shipping and returns. Break-even ROAS uses gross margin; contribution margin is the stricter test of whether ads leave money behind.
Can I see break-even ROAS for each product range?
Yes. Gross margin by product, variant and SKU is a standard KPI, so you can ask Luca for each range's margin and break-even. Compare it with the ROAS the platform reports for that range's campaigns.
Is this an attribution tool?
No. Luca has no attribution model. It reads each platform's own reported results, such as spend, conversions and ROAS, and sets them beside your store revenue and margins.
What is POAS?
POAS stands for profit on ad spend. Luca uses it for ROAS compared with contribution margin, so you see which spend actually makes money after product costs, fees and returns.
Which ad platforms does Luca read?
Luca reads Meta, Google Ads including YouTube, and Amazon Ads. Google Ads and Amazon Ads connect self-serve. Meta connects through guided partner access with Luca's team. Every connection is read-only.
Does Luca count returns and refunds?
Yes. Returns and refunds are taken out of revenue and margin, down to product level. Luca also shows return and refund rates by product, which helps explain why a range's break-even is higher than it looks.
Where do product costs come from?
From your own cost rules for product cost, shipping, fees and overheads. They are set with Luca's team during onboarding, so every margin uses the same costs.
Does Luca change my ad budgets?
No. Every connector is read-only. Luca reads your ad accounts, store and ledger and writes to none of them. You or your agency make any budget change.
How often do the figures update?
Every source refreshes automatically once a day, overnight. Break-even ROAS and contribution margin reflect data up to yesterday.
What ROAS should a thin-margin brand aim for?
Aim above your break-even ROAS, with room for fees and returns. At a 25% gross margin, break-even is 4. Your margin after fees will be lower still, which raises the target again.
Updated 8 November 2026: first published, with the break-even ROAS formula, the ways to judge ad profit, a manual method, a worked example for three product ranges and further reading.