
Budget versus actual tells you whether the year is going to plan, but the spreadsheet version usually lands a month late, after the books close. By then the overspend has already happened. Luca AI, the AI analyst for ecommerce brands, tracks your revenue, ad spend and profit against your budget or annual plan, with pacing and the revenue forecast beside them. It reads Shopify, your ad accounts and Xero or QuickBooks, refreshes overnight, and lets you correct course mid-month.
At a glance
| Question | Answer |
|---|---|
| What it tracks | Your budget and annual plan, with pacing, and budget against actual for the lines of your plan |
| Where the numbers come from | Shopify for sales, your ad accounts for spend, and Xero or QuickBooks for costs and profit |
| How fresh | Refreshed once a day, overnight, so this morning's view includes yesterday |
| What sits beside the plan | A daily revenue forecast up to a year ahead, where Luca's team has switched forecasting on |
| What Luca does with it | Turns its findings into tasks tied to your goal, and answers questions about any gap in chat |
| What it never does | Change your ad budgets, your store or your books. Every connection is read-only |
The short answer to "are we on plan?" is the pacing figure: actual to date as a share of plan to date. The rest of this page shows how to read it, line by line, early enough to act.
What budget against actual is in Luca
Budget against actual in Luca puts each line of your plan next to what has actually happened. Revenue comes from your store, ad spend from your ad accounts, and costs and profit from your accounting ledger. The product catalogue describes it in two parts: a budget and annual plan with pacing, and budget against actual.
The plan connects to the rest of your numbers. Goals and pacing to plan run through forecasting and the home screen, where Luca turns its findings into tasks. So the question changes from "how far off are we?" to "what moves it back?".
What you see
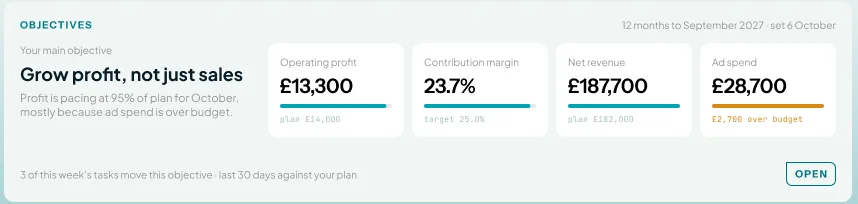
The Objectives card sits on the home screen. It names your main objective and shows the headline lines of your plan as tiles, each with its actual figure and the plan or target beneath it. A short line underneath explains what is driving the pace.
 Illustrative example · demo brand
The Objectives card says profit is pacing at 95% of plan because ad spend is over budget, so the cause sits next to the gap. The figures are sample data for a demo brand.
What it is not
It is not your ledger, and it is not a budgeting tool that changes anything. Luca only reads from the systems you connect and writes to none of them. It never posts a journal, moves an ad budget or edits a supplier bill. It is also not an attribution model: it compares spend and platform-reported results with store revenue, and does not tie a sale to a particular ad.
Why budget versus actual tracking matters
What it's for
Budget versus actual answers one question for a finance lead: is the year on plan, and if not, which line is off? Tracked during the month rather than after close, it gives you time to fix the line before the quarter ends.
How it helps
- You see the overspend while it is still small. Pacing shows when ad spend runs ahead of plan in week two, not in the month-end pack.
- You see the line, not just the total. A revenue line on plan can hide a margin line that is slipping.
- You see where the year lands. The forecast beside the plan shows whether today's pace closes the gap or widens it.
- You walk into the founder's meeting with a cause. Luca links the gap to the tasks that would close it.
What happens without it
Without budget versus actual, you learn about a miss once it has happened. Ad spend overruns for weeks before anyone sees the total. Margin erodes quietly behind a healthy revenue line. By the time the quarter closes, the only thing left to do is explain it.
Why buyers care
Finance leads care at every monthly close and every board update, because they own the plan. Founders care most early in the financial year, when correcting one line is still cheap. Growth leads care when their ad budget is the line under review.
The Luca AI approach to budget versus actual
Take the finance lead at a Shopify furniture and lighting brand, two months into the financial year. Revenue is on plan. Ad spend is pacing well over budget, and gross margin has slipped. Before the quarter closes, she has to tell the founder which line to correct first.
The usual route is a spreadsheet. She exports sales from Shopify, spend from each ad platform and costs from the ledger, then lines them up against the budget tab. That often takes days, and it tends to happen after month end. By the time it is done, another month of spend may already be committed.
Two things make this harder than it used to be. Ad spend now moves daily, so a month-end view arrives too late to act on. And a revenue line on plan can hide a cost line that is not, because the two sit in different systems.
Luca AI brings those systems together and holds them against your budget and annual plan. It shows budget against actual for each line of the plan and pacing against plan through the year. It refreshes overnight, so each morning's figures include yesterday. Where forecasting is switched on, it puts the forecast beside the plan. It then turns its findings into tasks that move the goal, and you decide which to act on.
One difference is easy to spot. Few tools put a forecast beside the plan and also read Xero or QuickBooks in the same view. That is covered in How Luca AI compares for budget versus actual, below.
How budget against actual gets tracked
There are five common ways to track a budget against what happened. Each catches some problems and misses others.
Month-end variance from the ledger
You compare the closed month in Xero or QuickBooks with the budget. This catches everything the books hold, with costs matched to the month they belong to, which is how accrual accounting records income when earned and expenses when incurred. It misses timing: the answer arrives after the month you could have corrected.
Straight-line pacing
You divide each monthly budget by the days in the month and compare spend to date with that share. This catches an early overspend within days. It misses seasonality: a month that is meant to be front-loaded looks overspent when it is not.
Pacing against a phased plan
You shape the plan to the year, often from last year's pattern, which mirrors a seasonal naive forecast that repeats the value from the same season. Pacing then compares actuals with the plan's own monthly profile. This catches real overspend in a busy month. It misses anything that last year's shape got wrong.
A forecast to year end beside the plan
You add a forecast of the rest of the year and compare the total with the plan. This catches where the year will land at today's pace, not just where it stands. It is only as good as the forecast, so check how the forecast has tracked against actuals.
Ratio guardrails
You watch ratios alongside the pounds: ad spend as a share of revenue, marketing efficiency (MER) and gross margin. This catches spend that a strong revenue month hides. It misses absolute size: a healthy ratio on a small month can still leave the year short.
What this means in Luca
Luca is confirmed to do four of these. It shows budget against actual and pacing against your plan. It forecasts daily revenue up to a year ahead where forecasting is on, and it checks that forecast against actuals every night. MER, ad spend as a share of revenue and gross margin are standard measures. Month-end figures come from the ledger you already close in, read once a day.
Read your budget against actual
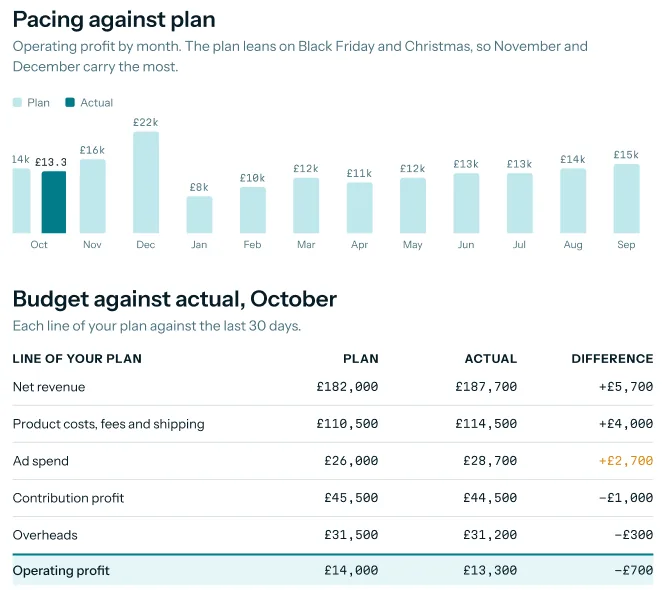
Start with the pacing chart, then read the table line by line. The chart tells you whether the year is on track. The table tells you which line to look at.
 Illustrative example · demo brand
Each line of the plan sits against the last 30 days, so ad spend over plan stands out beside revenue that is ahead. The figures are sample data for a demo brand.
Find the line that is off
Read the Difference column from the top. Revenue ahead of plan is good news only if costs moved by less. In the sample above, net revenue is ahead of plan, but product costs and ad spend together rose by more, so profit is behind. That pattern is the one to explain to a founder. The KPI reporting guide covers how the same definitions carry into your board pack.
Check ad spend against revenue
When ad spend runs over budget, check what the extra spend bought. Compare the overspend with the revenue variance, then look at MER, which is total revenue divided by total ad spend. Shopify's guide shows how MER helps forecast the revenue a planned budget should generate. If MER fell while spend rose, the extra spend bought little.
Then break the spend down by platform and campaign. Luca shows spend and platform-reported ROAS by platform and campaign beside store revenue. It does not say which ad produced which order. Our ROAS analysis guide shows how to read platform ROAS against break-even ROAS.
When gross margin slips
Gross margin is revenue minus cost of goods sold, divided by revenue. A slip usually comes from one of three places: deeper discounts, a shift in product mix, or higher costs landing from a stock buy or a supplier bill. Luca reports gross profit and gross margin by product, variant and SKU, so you can see which products moved. Our explainer on contribution margin vs gross margin covers which margin to watch for which decision.
Margin also changes your ad maths. Break-even ROAS is 1 divided by gross margin, so a lower margin means every ad has to earn more to pay for itself.
Decide what to correct before the quarter closes
Rank the lines by how much each costs the year and how quickly you can change it. Ad spend can usually be reset within days. Margin usually needs a diagnosis first. Luca turns its findings into tasks tied to your goal, and you can ask it in chat where budget might be better spent. You make every change yourself, in your own ad accounts and your own books.
Ask follow-ups in plain English, such as "why is ad spend over plan this month?". Cross-source answers combine Shopify, your ad accounts and Xero in one reply.
How budget variance and pacing are measured
Two measures matter for this job. Both are simple, and both mislead in predictable ways.
Variance and percentage of plan
Variance is actual minus plan, in pounds. Percentage of plan is actual divided by plan. Watch three weak spots:
- Direction. A cost over plan is unfavourable, but revenue over plan is favourable. Read each sign in context.
- Small lines. A 40% miss on a two-thousand-pound line matters less than a 5% miss on a line a hundred times bigger. Rank by pounds, then by percentage.
- Timing. A supplier bill posted late makes one month look cheap and the next look expensive. Compare two months together before you act.
Pacing to date
Pacing is actual to date divided by plan to date. At 100%, the line is on plan. Its weak spot is the plan to date itself: a straight-line share ignores seasonality, so a busy fortnight can look like an overspend. Pace against a phased plan where you have one.
Where Luca shows them
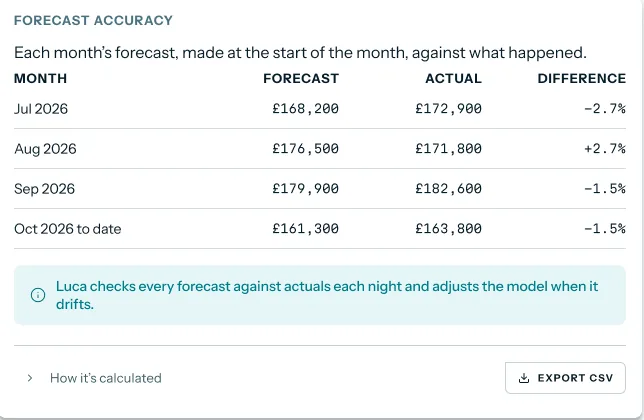
The budget against actual table shows plan, actual and difference for each line. The Objectives card shows pacing as a share of plan and names the line driving it. Beside the plan, the revenue forecast is checked against actual sales every night, so you can see how far to trust it.
 Illustrative example · demo brand
Before you lean on the forecast in a budget review, check how close past months came. The figures are sample data for a demo brand.
How to track budget vs actual for an ecommerce brand
The manual method
- Export last month's sales from Shopify, net of refunds and discounts.
- Export spend from each ad platform for the same dates.
- Export the profit and loss from Xero or QuickBooks once the month is closed.
- Paste all three into the budget workbook, one column per month.
- Work out the difference and the percentage of plan for each line.
- Add MER, ad spend as a share of revenue and gross margin as ratio checks.
- Write a line on each big variance, then send the pack to the founder.
This works, but it runs on closed months. Each refresh takes the same exports again, so mid-month pacing rarely gets done.
The same job in Luca
Connect Shopify, your ad accounts and Xero or QuickBooks once. Luca then refreshes them overnight and holds them against your budget and annual plan. Open the Objectives card each morning for pacing, then the budget against actual table for the line. Ask in chat about any variance, and download the answer as PDF, Excel or PowerPoint for the founder.
A worked example: ad spend and margin in month two
This is an illustrative calculation with sample figures, not a Luca output. A furniture and lighting brand closes month two of its financial year:
| Line | Plan | Actual | Difference | How it is worked out |
|---|---|---|---|---|
| Net revenue | £240,000 | £242,000 | +£2,000 | 242,000 - 240,000 |
| Product costs | £120,000 | £133,100 | +£13,100 | 133,100 - 120,000 |
| Gross profit | £120,000 | £108,900 | -£11,100 | revenue - product costs |
| Gross margin | 50% | 45% | -5 points | 108,900 ÷ 242,000 |
| Ad spend | £36,000 | £48,400 | +£12,400 | 48,400 - 36,000 |
| Ad spend as a share of revenue | 15% | 20% | +5 points | 48,400 ÷ 242,000 |
| MER | 6.7 | 5.0 | -1.7 | 242,000 ÷ 48,400 |
| Gross profit after ad spend | £84,000 | £60,500 | -£23,500 | gross profit - ad spend |
Now split the gap in gross profit after ad spend into its causes:
| Cause | Working | Effect |
|---|---|---|
| Extra revenue at plan margin | £2,000 × 50% | +£1,000 |
| Margin slip on actual revenue | (50% - 45%) × £242,000 | -£12,100 |
| Ad spend over budget | £48,400 - £36,000 | -£12,400 |
| Total | 1,000 - 12,100 - 12,400 | -£23,500 |
Ten days into month three, the same check on pacing shows the overspend is still running:
| Pacing check, day 10 of 30 | Working | Result |
|---|---|---|
| Monthly ad spend plan | From the budget | £36,000 |
| Plan to date, straight line | £36,000 × 10 ÷ 30 | £12,000 |
| Actual ad spend to date | From the ad accounts | £16,000 |
| Pacing | £16,000 ÷ £12,000 | 133% |
| Month end at this pace | £16,000 × 30 ÷ 10 | £48,000, or £12,000 over plan |
So the answer for the founder is ad spend first. It costs as much as the margin slip, and it can be reset this week. Margin comes second, because it needs a look at discounts, product mix and cost per unit before anyone can fix it.
Get your plan tracked
- Connect Shopify with read-only access.
- Connect your Meta and Google ad accounts, approving read-only access on each platform's own consent screen.
- Connect Xero or QuickBooks. Both connect self-serve, and Luca reads your books without writing to them.
- Agree your cost rules (product costs, shipping, fees and overheads) with Luca's team during onboarding.
- Have your budget or annual plan ready by month and by line, and agree with your Luca contact how it is loaded.
- Ask Luca's team to switch forecasting on, so the forecast sits beside the plan.
How budget against actual works with the rest of Luca
Shopify
Shopify supplies the revenue lines, from your full order history. That history also lets you compare this year's pace with the same months last year.
Ad accounts
Meta and Google supply the spend lines. Luca shows spend and platform-reported ROAS by platform and campaign, so you can see where an overspend sits.
Xero and QuickBooks
The ledger supplies costs, overheads and profit. With Xero or QuickBooks connected, gross, operating and net margin are standard measures. Our explainer on cash flow vs revenue vs profit sets out why the three move differently against a plan.
Revenue forecast
The revenue forecast runs daily up to a year ahead and shows where the year will land at today's pace. Read it next to the plan before you agree a correction.
Chat
Chat answers questions about any variance in plain English, with figures and charts. It can also suggest where ad budget might move, as advice you act on yourself.
Who uses budget against actual, and how
CFOs and finance leads
A finance lead checks pacing each morning and the budget against actual table each week. At month end, the ledger lines confirm the picture, and the variance commentary is already half written.
Founders and CEOs
A founder reads the Objectives card for the one line that needs a decision. The whole-business morning view puts that line next to sales, ads and cash.
Growth and marketing leads
A growth lead watches ad spend pacing against budget, MER and break-even ROAS. When spend runs ahead, the decision is which channel to trim, and that stays with them.
How Luca AI compares for budget versus actual
Luca AI puts your plan, your actuals from store, ads and ledger, and a daily forecast in one view, refreshed overnight. Most tools in this table do one or two of those. Luca AI is the only platform in this table that does all four.
Budget versus actual features, from each platform's public documentation:
| Platform | Luca AI | Daasity | Shopify Analytics | Lifetimely | Triple Whale |
|---|---|---|---|---|---|
| Budget or annual plan with pacing | Yes | Yes (revenue plan you input) | Partly (fixed-amount targets only) | Not in docs | Not in docs |
| Budget against actual | Yes | Yes (daily performance against budget projections) | Yes (actual performance against a target) | Not in docs | Not in docs |
| Forecast beside the plan | Yes | Partly (forecast is the plan you load) | Partly (Sidekick forecasts on request) | Partly (a scenario, not a prediction) | Partly (subscriber trends to project income) |
| Xero or QuickBooks in the same view | Yes | Not in docs | Not in docs | Yes (QuickBooks Online cost sync) | Not in docs |
Yes: documented and built in. Partly: documented with a limit, shown in brackets. Not in docs: not found in the vendor's public documentation.
Why Luca AI is the stronger choice for budget versus actual
- A forecast, not only a plan. Daasity compares actuals with a revenue plan you input. Luca also forecasts daily revenue up to a year ahead, so you see where the year lands. Compare the options in our Daasity alternatives guide.
- The ledger and the plan together. Lifetimely syncs QuickBooks Online cost data into its reports. Luca reads Xero or QuickBooks and holds each line against your budget, with pacing. More in our Lifetimely alternatives guide.
- Pacing for the whole plan. Triple Whale suggests using subscriber trends to project income. Luca tracks revenue, ad spend and profit against your annual plan in one place. See our Triple Whale alternatives guide.
Competitor details checked against each vendor's public documentation on 7 November 2026. Features and plans change, so confirm with the vendor before you decide.
Limits of budget against actual
- Overnight, not live. Data refreshes once a day, overnight. Spend booked this afternoon shows up tomorrow morning.
- Read-only by design. Luca never changes your ad budgets, store or books. It recommends, and you make the change.
- No attribution model. Spend and platform-reported results sit beside store revenue. Luca does not tie a sale to a particular ad, creative or campaign.
- Forecast on request. The forecast beside the plan appears once Luca's team has switched forecasting on for your brand.
- Profit lines need the ledger. Operating and net margin come from Xero or QuickBooks, so connect one to track profit lines.
Common questions
What is budget versus actual?
Budget versus actual compares what you planned for each line, such as revenue, ad spend and profit, with what happened. The difference shows which line is off and by how much, so you can correct it.
How often does budget against actual update in Luca?
Luca refreshes every connected source once a day, overnight. Each morning's budget against actual and pacing include the previous day's sales, ad spend and ledger entries. It is not a real-time view.
Does Luca change my ad budgets or post to Xero?
No. Every connection is read-only, and Luca writes to none of your systems. It never posts to Xero or QuickBooks or moves an ad budget. It can recommend a change, and you make it yourself.
What does pacing mean?
Pacing is actual to date divided by plan to date. A line at 100% is on plan, below 100% is behind, and a cost line above 100% is overspending. Luca shows pacing against your plan through the year.
What is the difference between my plan and the forecast?
The plan is what you intend the year to be. The forecast is what your data says the year will be at the current pace. Luca shows both, so the gap between them is the work still to do.
Do I need Xero or QuickBooks?
Revenue comes from Shopify and ad spend from your ad accounts. Costs, overheads and profit lines come from Xero or QuickBooks. Connect one of them to track gross, operating and net margin against plan.
Will Luca tell me which campaign caused the overspend?
Luca shows ad spend and platform-reported ROAS by platform and campaign next to store revenue, so you can see where the spend went. It does not tie individual orders to individual ads.
Can Luca suggest where to move ad budget?
Yes. You can ask in chat where budget might work harder, and Luca answers from your own numbers. It gives advice only. Any change to a campaign budget is one you make in the ad platform.
Is the forecast switched on for every brand?
No. Luca's team switches forecasting on per client. Once it is on, the daily revenue forecast sits beside your plan and is checked against actual sales every night.
Does Luca use my own cost rules?
Yes. Your own rules for product costs, shipping, fees and overheads are set with Luca's team during onboarding. Profit and margin lines then follow your definitions rather than a generic default.
Can I share budget against actual with the founder?
Yes. You can download an answer as CSV, Excel, Word, PDF or PowerPoint, and send it on. That suits a short variance note before the founder's meeting.
Why do my month-end figures differ from the mid-month view?
Bills and costs often reach the ledger after the month they belong to. Mid-month, those lines are incomplete. Once the month is closed in Xero or QuickBooks, the next overnight refresh brings in the final figures.
Which lines should I correct first?
Rank each line by its effect on profit in pounds, then by how quickly you can change it. Ad spend usually moves within days, while margin needs a diagnosis first. The worked example above shows the arithmetic.
Updated 7 November 2026: first published, with how budget tracking works, how variance and pacing are measured, the manual method, a worked example, further reading and thirteen questions.