
Contribution margin analysis answers the question a healthy revenue line hides: what is left from each order, each sales channel and each month after product costs, fees, refunds and ad spend. Luca AI, an ecommerce analytics platform with AI agents, works that out from your store, payment, ad and accounting data. It shows contribution in three layers, CM1 to CM3, so you can see which cost takes the margin. Luca's team sets it up with your brand, using your own cost rules.
At a glance
| Question | Answer |
|---|---|
| What does it show? | Contribution margin and contribution profit after product costs, fees and advertising, by month, by sales channel and per order |
| What are the layers? | CM1 after product costs, CM2 after fulfilment and fees, CM3 after ad spend |
| Where do the numbers come from? | Your store (Shopify, Amazon Seller Central), payments (Stripe), ad platforms (Meta, Google Ads, Amazon Ads) and books (Xero or QuickBooks) |
| How is per order worked out? | An average: each layer for the period divided by the period's orders |
| How is ad spend handled? | It comes off as each ad platform reports it. No ad cost is assigned to single orders |
| How fresh is it? | The dashboard refreshes every morning |
| Who sets it up? | Luca's team, per client, with your cost rules |
| Does it change your systems? | No. Every connector is read-only |
What a contribution margin analysis shows
A contribution margin analysis takes net revenue and removes, one layer at a time, the costs that rise and fall with each sale. What remains is the money each order, channel and month contributes towards your fixed costs and profit. Luca shows it as contribution margin (a percentage of net revenue) and as contribution profit (an amount), after fees and after refunds.
The layers follow the order costs hit a sale. CM1 is what remains after product costs. CM2 is what remains after fulfilment, shipping, and payment and marketplace fees. CM3 is what remains after ad spend. If you want the difference from gross margin spelled out, the post on contribution margin vs gross margin walks through it.
What you see on the Profit tab
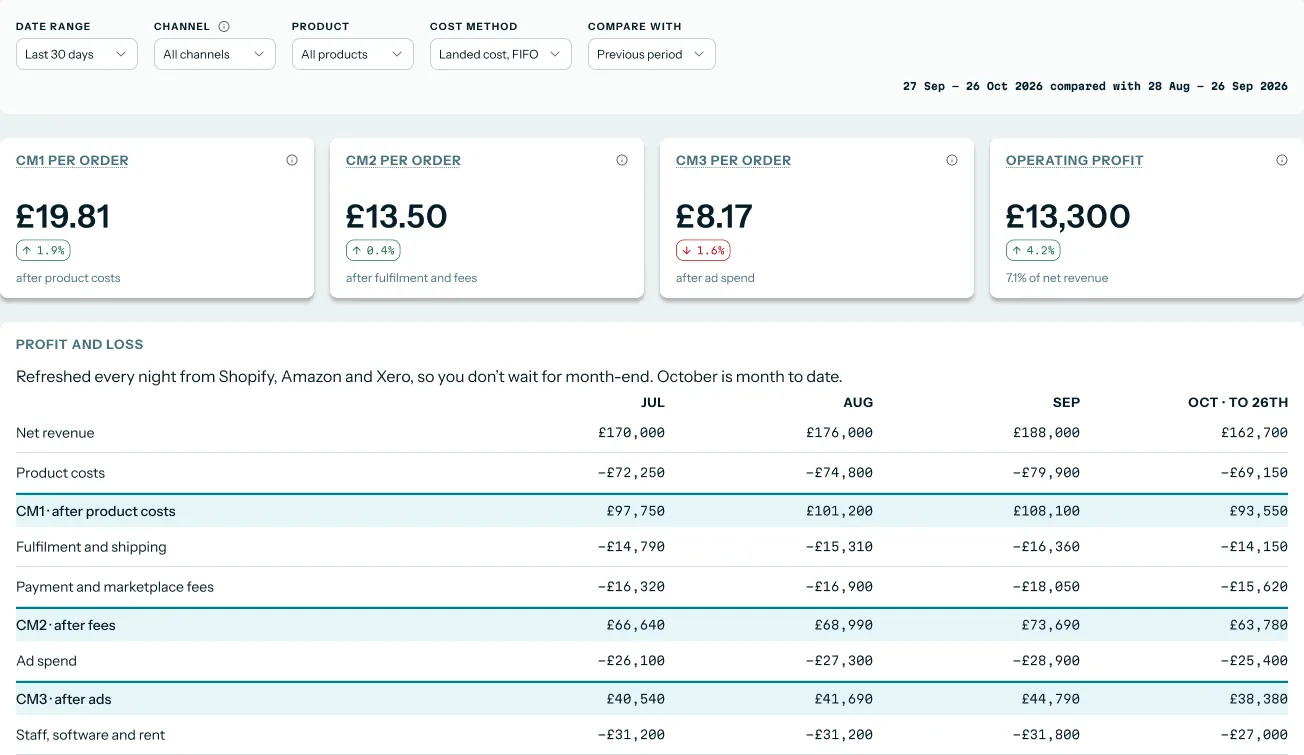
Open Numbers and choose Profit. The tab is headed What each product, channel and month actually made. Across the top, cards show CM1, CM2 and CM3 per order. Below them, a Profit and loss table runs month by month from net revenue down through each layer, so you read the trend and the per-order figure together.
 Illustrative example · demo brand
Contribution per order at each layer sits above the monthly profit and loss, so the trend and the per-order view share one screen. The figures are sample data for a demo brand.
What it is not
It is not an attribution model. Luca doesn't tie an order, a sale or a customer to a campaign, an ad or a creative. Ad spend comes off at the level each ad platform reports it, and contribution per order is an average across the period, not ad cost charged to individual orders. It is also not a cash view: contribution tells you what sales earn, not when the money reaches the bank.
Why contribution margin analysis matters
What it's for
Contribution margin analysis tells you what each order, channel and month really earns once the costs of selling come off. It turns a revenue figure into a number you can plan fixed costs, hiring and ad budgets against.
How it helps
- Shows where margin leaks. Each layer isolates one kind of cost, so a fall in CM2 points to fees or shipping, not product cost.
- Separates your sales channels. Shopify and Amazon carry different fees, so each gets its own contribution.
- Puts profit in order terms. Contribution per order says what an average order leaves after every variable cost.
- Tracks the trend. Monthly figures show whether rising revenue brought rising contribution.
What happens without it
Revenue grows, the bank balance doesn't, and nobody can say why. Discounts, refunds, marketplace fees and ad spend pile up in different systems. The quarterly review turns into a debate about whose number is right.
Why buyers care
It matters most to finance leads and founders before a quarterly review, a budget round or a change in ad spend. It also matters to growth leads, who are asked to grow sales without shrinking what each sale contributes.
The Luca AI approach to contribution margin analysis
Picture the finance lead at a premium cookware brand that sells pans and knives on Shopify and Amazon. Revenue looks healthy, yet the bank balance stays thin. The quarterly review is three weeks away, and the founder wants contribution margin by month, by sales channel and per order.
The usual route is a spreadsheet. You export orders from Shopify, settlement reports from Amazon, spend from each ad platform and the ledger from Xero, then match them by hand. That can take days each quarter, and a single mismatched refund or fee line can quietly skew the result.
Selling in two places makes the job harder. Amazon takes marketplace fees on every sale, while Shopify orders carry payment fees and your own shipping. A blended margin hides which channel pays its way, and month-end figures arrive too late to change anything this quarter.
Luca AI does that matching for you. It reads your store, payment, ad and accounting data, applies your own cost rules and shows contribution in three layers. You see it by month, by sales channel and per order. The dashboard refreshes every morning, and you can ask why a figure moved.
The Profit tab shows CM1, CM2 and CM3 per order side by side, as in the screenshot above, with the monthly profit and loss underneath. How that compares with other analytics tools is covered in How Luca AI compares for contribution margin analysis, below.
How contribution margin gets worked out
There are a few common ways to measure what sales contribute. Each one catches some costs and misses others, which is why a brand with healthy revenue can still run short of cash.
Gross margin only
Gross margin takes product cost off revenue and stops. It shows whether your prices cover what the goods cost you. It misses fulfilment, payment and marketplace fees and ad spend, so a channel with heavy fees looks as good as one without them. That is why a margin can look fine while cash runs short.
A single contribution figure
The textbook version takes net sales less variable costs, divided by net sales. One figure catches every variable cost at once. It misses where the margin went: a fall could come from product cost, fees or ads, and the single number can't tell you which.
Layered contribution, CM1 to CM3
Layers take costs off in the order they hit a sale. CM1 removes product costs, CM2 removes fulfilment and fees, and CM3 removes ad spend. This catches which kind of cost is moving. It needs clean cost data at every layer, or one wrong input flows through every layer below it.
Contribution per order
Dividing a layer by the number of orders gives contribution per order. It puts the result in terms a team can act on, such as whether a free-shipping threshold still pays. It is an average, so it misses the spread between a single paring knife and a full knife block.
Contribution by sales channel
Splitting by sales channel shows what Shopify and Amazon each contribute. It catches channel costs, such as marketplace fees, that a blended figure hides. Ad spend only splits as cleanly as the ad platforms report it, so read CM3 by channel with that in mind.
What this means for your contribution margin analysis
Luca is confirmed to show contribution margin and contribution profit after fees and refunds, by layer from CM1 to CM3, per order, by month and by sales channel. It applies your own cost rules for product costs, shipping, fees and overheads, and it states the cost method, such as average, FIFO or landed cost.
Read contribution margin by month
Monthly contribution tells you whether growth is paying for itself. Open Numbers, choose Profit, then use the filter bar to set the date range and the comparison period. The Profit and loss table shows each month from net revenue down through CM1, CM2 and CM3.
Read it from the top. If net revenue rises and CM3 rises more slowly, a cost layer is growing faster than sales. Find the layer where the gap opens, then ask Luca in chat why that number moved. Chat investigates what drove the change, using the same data as the dashboard.
With Xero or QuickBooks connected, the table continues below CM3 into fixed costs and operating profit. That's where a thin bank balance often starts to make sense: CM3 has to cover staff, software and rent before anything is left.
Compare contribution by sales channel
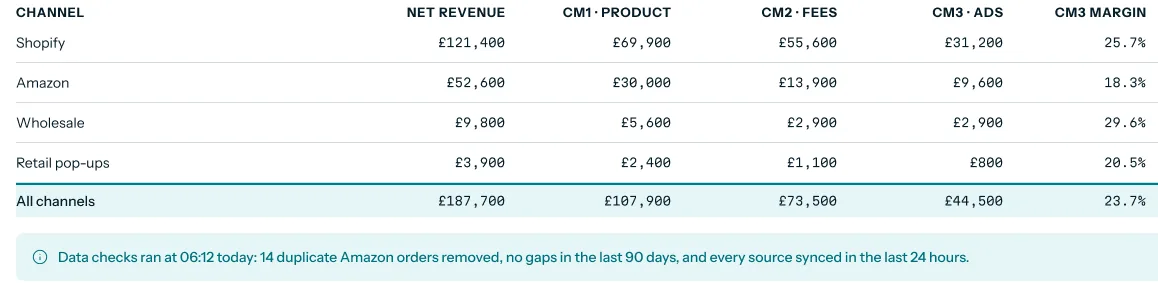
For the cookware brand, this is the view that answers the founder's question. The Profit by channel table lists each sales channel with its net revenue and what it kept at each layer, plus its CM3 margin.
 Illustrative example · demo brand
Each sales channel keeps a different share at each layer, which shows where fees or ad spend bite hardest. The figures are sample data for a demo brand.
Compare the step from CM1 to CM2 first. On Amazon, that step carries marketplace fees, so it is usually larger than on Shopify. Then compare CM2 to CM3, which is ad spend as each platform reports it. If one channel ends with a much lower CM3 margin, look at its fees and ad spend before you look at its revenue. The ROAS analysis page covers how ad returns compare with contribution margin, by channel.
Turn it into contribution per order
Contribution per order is the figure most teams remember after the review. The cards at the top of the Profit tab show CM1, CM2 and CM3 per order for the period you chose, each with its change against the comparison period.
Treat each card as an average. A month with more large knife-block orders will lift it, and a month of single-pan orders will pull it down, even if nothing else changed. Before you call a change a trend, check the Channel and Product filters to see whether the order mix moved.
Take it into the quarterly review
Bring three things: CM3 by month for the quarter, CM3 margin by sales channel, and CM3 per order against the last quarter. Hover over any metric name to show its definition, so the room argues about decisions rather than formulas. For the board's wider pack, the KPI reporting guide explains how the same definitions carry into exported reports.
How to measure contribution margin
Two measures do most of the work: contribution margin as a percentage of net revenue, and contribution per order. A higher contribution margin ratio leaves more to cover fixed costs, such as rent and staff.
Contribution margin ratio
The ratio compares channels and months of different sizes fairly. Its weak spot is that it hides scale: a small channel with a high ratio may still contribute less money than a large channel with a lower one. Read it next to contribution profit, the amount.
Contribution per order
Per order turns the result into a unit a marketing or operations lead can act on. Its weak spot is order mix, as above. Refunds also arrive after the sale, so a recent month can look better than it will once returns come back.
Where Luca shows them
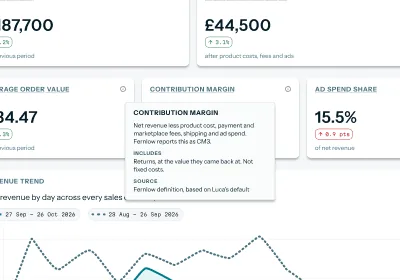
The CM3 margin column in Profit by channel gives the ratio for each channel, and the per-order cards give the unit view. Each metric carries its definition. Metric definitions are governed in one place, with Luca's defaults and your business's own definitions on top, so chat and the dashboard give the same number.
 Illustrative example · demo brand
Hovering a metric shows how it is calculated and whose definition it follows, which settles questions before the review starts. The figures are sample data for a demo brand.
How to calculate contribution margin for an ecommerce brand
You can build a contribution margin analysis by hand. It is worth doing once, because it shows exactly which inputs the result depends on.
The manual method
- Export orders for the month from Shopify and the settlement report from Amazon Seller Central.
- Work out net revenue for each channel: gross sales less discounts and refunds, with shipping charged and VAT kept separate.
- Take off product costs using one cost method, such as average or landed cost. That gives CM1.
- Take off fulfilment and shipping, then payment fees (Shopify) and marketplace fees (Amazon). That gives CM2.
- Export ad spend from Meta, Google Ads and Amazon Ads, and take it off. That gives CM3.
- Divide each layer by net revenue for the margin, and by the number of orders for the per-order average.
- Repeat for every month in the quarter, and check the totals against your ledger in Xero or QuickBooks.
The same job in Luca
Luca's team connects your sources and sets up your cost rules once. After that, the Profit tab shows every layer by month, by sales channel and per order, and it refreshes every morning. Daily data-quality checks compare Luca's data with your sources and catch gaps, duplicates and stale tables. You can trace each figure back, because every answer shows its working.
A worked example: one month for a cookware brand
This is an illustrative calculation with sample figures, not a Luca output. It follows the manual method for one month, split by sales channel. Ad spend in this example is Amazon Ads on Amazon, and Meta and Google Ads on Shopify.
| Line | Shopify | Amazon | Total | Arithmetic |
|---|---|---|---|---|
| Net revenue | £130,000 | £70,000 | £200,000 | After discounts and refunds |
| Product costs | £58,500 | £31,500 | £90,000 | 45% of net revenue |
| CM1 | £71,500 | £38,500 | £110,000 | Net revenue less product costs |
| Fulfilment and shipping | £12,000 | £4,000 | £16,000 | |
| Payment and marketplace fees | £3,900 | £16,100 | £20,000 | |
| CM2 | £55,600 | £18,400 | £74,000 | CM1 less fulfilment and fees |
| Ad spend | £24,000 | £6,000 | £30,000 | As each platform reports it |
| CM3 | £31,600 | £12,400 | £44,000 | CM2 less ad spend |
| CM3 margin | 24.3% | 17.7% | 22.0% | CM3 divided by net revenue |
Now put it in order terms and set it against fixed costs.
| Line | Figure | Arithmetic |
|---|---|---|
| Orders in the month | 2,000 | 1,300 on Shopify, 700 on Amazon |
| CM1 per order | £55 | £110,000 ÷ 2,000 |
| CM2 per order | £37 | £74,000 ÷ 2,000 |
| CM3 per order | £22 | £44,000 ÷ 2,000 |
| Staff, software and rent | £36,000 | From the ledger |
| Operating profit | £8,000 | £44,000 less £36,000 |
Two hundred thousand pounds of revenue leaves eight thousand pounds of operating profit. Amazon's CM1 margin matches Shopify's, but marketplace fees cut its CM2 margin to about 26%, against about 43% on Shopify. That is the finding to take into the review: the leak is in fees, not in pricing or ads.
Get contribution margin set up
Contribution margin is set up per client with Luca's team as part of a tailored finance view. Start by connecting your sources: Shopify, Amazon Seller Central, Amazon Ads, Google Ads, Xero, QuickBooks and Stripe connect self-serve, and Meta connects through guided partner access with Luca's team. The set-up guide walks through each connection.
Then ask your Luca contact to set up contribution margin. Your cost rules for product costs, shipping, fees and overheads are your own, and they are set during onboarding. Agree the cost method at the same time, so CM1 means the same thing every month.
How contribution margin works with the rest of Luca
Shopify
Shopify supplies orders, discounts and refunds, which give net revenue for your Shopify channel. It connects self-serve and read-only.
Amazon Seller Central and Amazon Ads
Amazon Seller Central adds SKU economics after marketplace fees, which is where Amazon's CM2 comes from. Amazon Ads supplies the spend that comes off at CM3.
Meta and Google Ads
Meta and Google Ads supply ad spend as each platform reports it. Luca compares that spend with contribution; it doesn't link a given order to a given ad.
Stripe
Stripe supplies payment data, including the fees that come off at CM2 for payments it handles.
Xero and QuickBooks
Your ledger carries the table below CM3 into gross, operating and net margin, and operating profit. The read-only access page explains how Luca reads your books without writing to them.
Chat
Ask a follow-up in plain English, such as why Amazon's CM2 fell in September. Chat, the dashboard and forecasts all draw on the same warehouse, so the answer uses the same definitions. The AI agents guide covers what else you can ask.
Who uses contribution margin analysis, and how
CFOs and finance leads
A finance lead uses the monthly table and the channel split to explain why revenue and cash disagree, and to set next quarter's cost targets. The ledger connection lets them reconcile CM3 with operating profit in one place.
Founders and CEOs
A founder reads CM3 per order and CM3 margin by channel to decide where to grow. If Amazon contributes less per order after fees, that shapes how hard to push it. The whole-business view puts contribution next to sales and cash each morning.
Growth and marketing leads
A growth lead watches the step from CM2 to CM3. When ad spend rises faster than CM2, the extra sales are costing more than they contribute. The ROAS guide puts ad returns against contribution margin for the same check. Marketing efficiency ratio measures total marketing efficiency over a set period, so it reads well next to CM3.
Operations and inventory leads
An operations lead watches fulfilment and shipping in CM2, since a carrier price change shows up there first. Demand plans sit on the demand forecasting page.
How Luca AI compares for contribution margin analysis
Luca shows contribution in three layers, per order, by sales channel and down to operating profit from your ledger, all in one place. Most analytics tools document one or two of these, often as a single contribution figure.
Contribution margin analysis features, from each platform's public documentation:
| Platform | Luca AI | Daasity | Lifetimely | Triple Whale | Shopify analytics |
|---|---|---|---|---|---|
| Contribution in layers (CM1 to CM3) | Yes | Partly (CM1 and CM2) | Not in docs | Partly (one figure after fulfilment and ads) | Not in docs |
| Contribution per order | Yes | Not in docs | Not tied to specific orders | Partly (per item, not per order) | Partly (payment fees per order) |
| Contribution by sales channel | Yes | Yes (by day, product, channel and location) | Partly (Shopify and Amazon store contexts) | Not in docs | Not in docs |
| P&L to operating profit from Xero or QuickBooks | Yes | Not in docs | Partly (QuickBooks supplies selected costs) | Not in docs | Not in docs |
Yes: documented and built in. Partly: documented with a limit, shown in brackets. Not in docs: not found in the vendor's public documentation.
Why Luca AI is the stronger choice for contribution margin analysis
- Set up with you, not in a workbook. Luca's team sets up contribution margin with your own cost rules, while Daasity documents a Google Sheet that maps your sales, marketing and cost data. See Luca AI vs Daasity.
- Contribution per order. Luca shows CM1, CM2 and CM3 per order, while Lifetimely notes that contribution margin cannot be filtered because it is not tied to specific orders. See Luca AI vs Lifetimely.
- Amazon as its own channel. Luca splits every layer by sales channel, so Amazon's fees show in its own CM2, while Triple Whale notes that Amazon handling fees directly affect contribution margin on Amazon orders. See Luca AI vs Triple Whale.
Competitor details checked against each vendor's public documentation on 8 November 2026. Features and plans change, so confirm with the vendor before you decide.
Limits of contribution margin analysis in Luca
- Contribution margin is set up per client by Luca's team, with your cost rules. It isn't switched on by connecting a store.
- Ad spend comes off at the level each ad platform reports it. Luca has no attribution model, so it doesn't tie orders, sales or customers to a campaign, ad or creative.
- Contribution per order is an average across the period's orders. It doesn't charge ad cost to individual orders.
- The result depends on your cost rules. If a product cost or fee rule is out of date, every layer below it carries the error.
- Luca reads from your connected sources and writes to none of them, so it never changes prices, fees or ad budgets for you.
Common questions
What is contribution margin analysis?
Contribution margin analysis measures what each order, channel or month leaves after variable costs: product costs, fulfilment, fees, refunds and ad spend. The result is the money available to cover fixed costs and profit.
How is contribution margin different from gross margin?
Gross margin takes only product cost off revenue. Contribution margin also takes off variable selling costs such as shipping, payment and marketplace fees and ad spend, so it shows what a sale really contributes.
What do CM1, CM2 and CM3 mean in Luca?
CM1 is what remains after product costs. CM2 is what remains after fulfilment and fees. CM3 is what remains after ad spend. Each layer isolates one kind of cost, so you can see which one moved.
How is contribution per order calculated?
Contribution per order divides a layer's total for the period by the number of orders in that period. It is an average, so changes in order mix move it even when costs don't change.
Does Luca assign ad spend to individual orders?
No. Luca has no attribution model. Ad spend comes off at the level each ad platform reports it, and contribution per order is an average across the period, not ad cost charged to single orders.
Can I see Shopify and Amazon separately?
Yes. Contribution is shown by sales channel, so Shopify and Amazon each have their own net revenue, CM1, CM2, CM3 and CM3 margin. Amazon's marketplace fees show in its own CM2.
Which data does Luca use for contribution margin?
Luca uses your store data from Shopify and Amazon Seller Central, payment data from Stripe, ad spend from Meta, Google Ads and Amazon Ads, and your ledger in Xero or QuickBooks, all read-only.
Is a higher contribution margin always better?
A higher ratio leaves more of each sale to cover fixed costs. It isn't the whole story, because a small channel with a high ratio can still contribute less money than a large one. Read the ratio next to the amount.
Why can revenue look healthy while the bank balance stays thin?
Revenue counts sales before costs. Once product costs, fees, refunds and ad spend come off, the contribution left may only just cover staff, software and rent. Cash timing, such as when stock is paid for, can widen the gap. A daily view of sales, profit and cash shows both.
Who sets up contribution margin in Luca?
Luca's team sets it up per client, as part of a tailored finance view, once your sources are connected. Your cost rules for product costs, shipping, fees and overheads are set during onboarding. Ask your Luca contact to start.
Which cost method does Luca use for product costs?
Luca applies your own cost rules and states the cost method, such as average, FIFO or landed cost. Agree the method at set-up so CM1 is calculated the same way every month.
How often do the figures update?
The dashboard refreshes every morning. Daily data-quality checks compare Luca's data with your sources and flag gaps, duplicates and stale tables before you read the numbers.
Can I ask why contribution margin moved?
Yes. Ask in chat, for example why Amazon's CM2 fell last month. Chat investigates what drove the change, using the same data and definitions as the dashboard.
Does Luca change anything in Shopify, Amazon or Xero?
No. Every connector is read-only. Luca reads from each connected system and writes to none of them, so prices, fees, ad budgets and your ledger stay as they are.
Updated 8 November 2026: first published with the CM1 to CM3 layers, the views by month, sales channel and order, how contribution is measured, the manual method with a worked example, and a comparison with other analytics tools.