
Cash runway is the number of months your cash lasts at today's burn, and your bank balance can't tell you that on its own. You need the cash forecast, the burn behind it and a view of the months that won't look like the last three. Luca AI, an ecommerce analytics platform with AI agents, works out runway from the cash-flow forecast and your burn, reading Xero or QuickBooks beside Shopify. Free cash flow and burn multiple sit next to it, so you see the month cash gets tight while you can still act.
At a glance
| What it is | Cash runway in months: how long your cash lasts at the current burn |
|---|---|
| What it's built from | The cash-flow forecast and your burn, from Xero or QuickBooks beside Shopify |
| Where you see it | On Numbers › Cash, in the Runway card, beside the cash forecast and the Working capital card |
| Scenarios | Runway when sales follow the forecast, when sales fall short, when ad spend rises and when nothing sells |
| Next to it | Free cash flow, burn multiple and the cash-conversion cycle |
| Forecast behind it | Cash week by week for 13 weeks, then 12 months ahead |
| How it's checked | The forecast is checked against actuals every night and corrected |
| What it needs | Xero or QuickBooks connected, and forecasting switched on for your brand by Luca's team |
| What it never does | Write to your ledger. Luca reads your books and never writes to them |
What cash runway is
Runway answers one blunt question: if nothing changes, how many months until the cash runs out? The common rule divides the cash you hold by your monthly net burn. That works for a business whose months look alike. It breaks for a store that buys stock in October, sells most of it in December and then has a quiet January.
Luca works the answer out from the cash-flow forecast instead. It takes the cash you hold, follows the forecast cash in and cash out month by month, and reads the burn from your books. The result is a runway in months that knows December is coming, and that changes when the forecast does.
What you see on the Cash tab
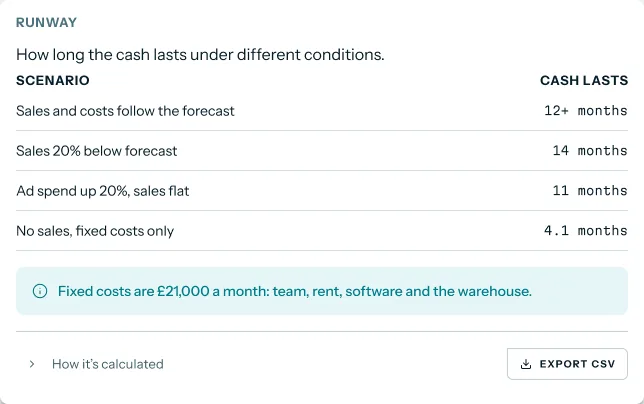
Open Numbers › Cash. You see the cash forecast first, then a Runway card and a Working capital card side by side. The Runway card lists a few conditions and how long the cash lasts under each, with the fixed costs behind the figures stated underneath.
 Illustrative example · demo brand
Runway is read under several conditions, from sales on forecast down to no sales and fixed costs only, so you see the range rather than one number. The figures are sample data for a demo brand.
What runway is not
Runway is not your bank balance, and it is not profit. A brand can show a healthy profit and still be short of cash, because stock is paid for months before it sells. Runway is also not a week-by-week cash plan. When you need to know which week a tax bill or payout lands, the 13-week view in the cash-flow forecast is the tool for that.
Why cash runway matters
What it's for
Cash runway tells you how many months of cash are left at the current burn. It turns a balance into time, which is the unit you plan in. It also shows how much a weak month shortens that time, before the month arrives.
How it helps
- A number you can act on. Months left is easier to plan around than a balance that swings every week.
- Seasonality allowed for. Runway built from the forecast knows a peak month is coming, unlike a three-month average.
- The downside priced in. Scenarios show how many months a weak December costs you.
- Books and store together. Burn comes from Xero or QuickBooks, and the cash coming in comes from Shopify payouts.
What happens without it
Without a runway figure, a large stock buy feels fine until the bills after it arrive. You find out cash is tight in the month it gets tight. By then the choices left are smaller ones, made in a hurry.
Why buyers care
Founders care most in the weeks after a big stock buy and before peak sales land. Finance leads care at every board meeting, where runway is usually the first question. Both need a number they can explain line by line.
The Luca AI approach to cash runway
Take the founder of a Shopify jewellery brand in early November. She has just paid for a large stock buy ahead of the gifting season: rings, chains and gift boxes for December. Her bank balance has dropped sharply. She wants to know how many months of cash are left at the current burn, and what happens if December sells below forecast.
The usual answer is a spreadsheet. Someone exports the bank balance and last quarter's spending, divides one by the other and calls it runway. That can take an afternoon, and the answer may be wrong in both directions. The stock buy inflates the burn, and the coming December is left out entirely.
The plain logic is that runway depends on the months ahead, not the months behind. A seasonal brand burns cash in some months and earns it back in others. So the honest figure follows the cash forecast month by month, and it needs the books, the store and the forecast together.
Luca AI does that join for you. It reads Xero or QuickBooks beside Shopify, builds the cash forecast, and works out runway from that forecast and your burn. It shows the runway under several scenarios, including sales below forecast, so the founder sees both numbers at once.
One fact you can check on this page: Luca's forecasts are checked against actuals every night and corrected. So the runway moves as December's real sales come in. How that compares with other ecommerce tools is covered in How Luca AI compares for cash runway, below.
How cash runway is worked out
There are a few common ways to put a number on runway. Each one catches something and misses something, and the gaps matter most for a brand with a big season.
Cash divided by trailing burn
The standard formula is cash reserves divided by monthly net burn, where net burn is spending minus revenue, usually averaged over the last three months. It is quick and easy to explain. It misses anything that is about to change, and a one-off stock buy in the last three months makes the burn look far worse than your normal month.
Gross burn instead of net burn
Some people divide cash by gross burn, which is total spending with revenue ignored. This gives the worst case: how long the cash lasts if nothing sells. It is a useful floor, but it overstates the risk for a brand that sells every day. Net burn is usually the more useful measure, because it counts what you earn.
Month by month from a cash forecast
The better method starts from today's cash and walks forward through a cash forecast, month by month. Each month adds the cash expected in and takes away the cash expected out. Runway is the month the balance would cross zero, or your chosen floor. This catches seasonality, tax bills and the timing of stock buys. It is only as good as the forecast, so the forecast needs checking against what actually happens.
Runway under scenarios
A single runway number hides the downside. Scenarios answer "what if": sales come in 20% below forecast, or ad spend rises while sales stay flat, or nothing sells at all. Shopify's cash-flow guide advises that if you expect a period of lower sales, include it in your forecast. The scenarios turn that advice into a range of months.
What this means for your runway in Luca
Luca works out runway from the cash-flow forecast and burn, which is the month-by-month method above. It builds the cash forecast 13 weeks ahead week by week and 12 months ahead, and it supports scenario planning with stated assumptions. The Runway card shows the scenario figures, including the no-sales, fixed-costs-only case that matches the gross-burn floor.
Read your runway
Start on Numbers › Cash. Read the cash forecast at the top first: it tells you where the balance is heading and where it dips lowest. Then read the Runway card. Check the gap between the forecast row and the weaker rows, because that gap is your exposure to a bad month.
Two checks catch most mistakes. First, make sure Xero or QuickBooks has synced recently, because burn comes from the books. Second, look at the lowest point in the cash forecast, not just the runway. A runway of a year can still hide one tight week.
Check runway after a stock buy
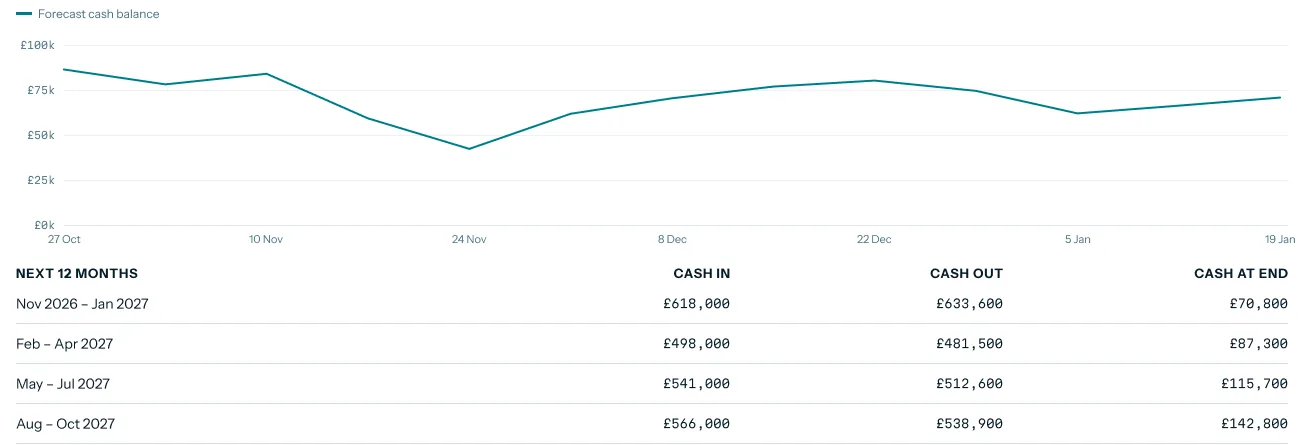
A big stock buy drops your cash in one go, then pays back as the stock sells. The forecast cash balance shows that shape: a dip after you pay, then a recovery as payouts land. Luca treats inventory as working capital, showing the cash tied up in stock, so you can see how much of the dip is sitting on your shelves.
 Illustrative example · demo brand
The dip after a stock buy is the week to watch, and the quarterly table shows whether cash recovers afterwards. The figures are sample data for a demo brand.
If the dip goes below the floor you are comfortable with, check the stock plan before you commit to the next buy. The demand forecast shows which products are expected to sell through.
Test a weak December
For a gifting brand, December decides the year. Read the Runway card's row for sales below forecast, then compare it with the forecast row. The difference is the number of months a weak December costs you.
Try asking Luca:
"If December sales come in 20% below forecast, how many months of runway do we have, and in which month does cash get tightest?"
Luca answers in plain English from all your connected platforms, so the reply draws on the cash forecast, your books and your Shopify sales together. The revenue forecast behind the December figure is worth reading too, because the runway depends on it.
Share runway with your board
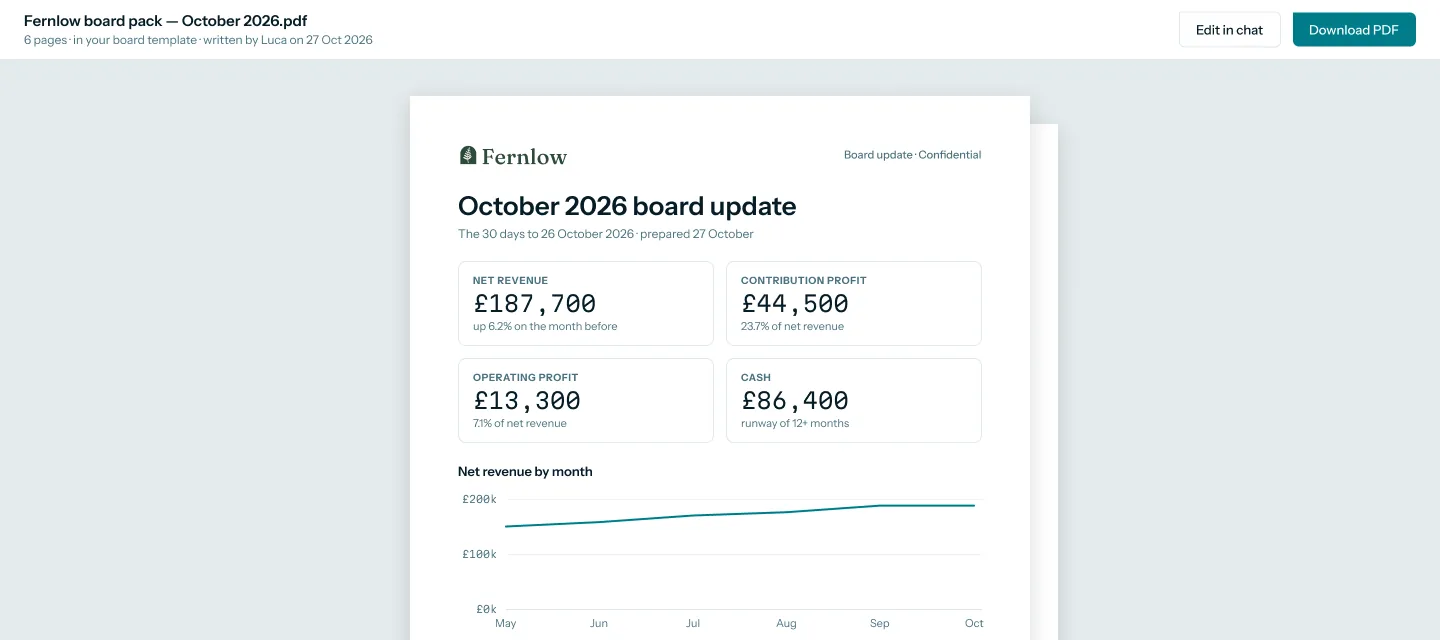
Runway is usually the first question at a board meeting. Luca writes a PDF board pack, with cash and runway on the first page beside revenue and profit. Every figure in it traces back to the same numbers you see on the Cash tab.
 Illustrative example · demo brand
Runway sits on the first page of the board pack, next to the profit figures it depends on. The figures are sample data for a demo brand.
For a monthly set of agreed figures, the KPI reporting page covers how one definition carries through to reports and exports.
How burn is measured
Runway is only as good as the burn behind it. Two or three measures do most of the work, and each one has a weak spot worth knowing.
Net burn and gross burn
Gross burn is total monthly spending, and net burn is what is left after revenue. Burn includes stock as well as salaries, rent and marketing. That is the weak spot for an ecommerce brand: one stock buy can double a month's burn without anything being wrong. Averaging over three months softens the spike but doesn't remove it.
Free cash flow
Free cash flow starts with operating cash flow and subtracts capital expenditure, such as equipment. It shows the cash left after running the business and investing in it. Its weak spot is timing. Operating cash flow can turn negative even for a profitable brand that is building up inventory ahead of a busy season, so read it alongside the season.
Burn multiple
Burn multiple compares the cash you burn with the growth you get for it. A falling multiple means each pound of burn is buying more growth. Its weak spot is the same as burn's: a stock buy in the period pushes the multiple up even when the business is sound.
Where you see burn in Luca
With Xero or QuickBooks connected, Luca adds free cash flow, burn multiple and a forward free-cash-flow forecast to your metrics. It also shows debtor, creditor and inventory days, which together give the cash-conversion cycle. Read these beside the Runway card. If burn multiple rises in the same quarter as a stock buy, the stock is the likely cause.
How to work out cash runway
You can work out runway by hand. Doing it once shows you exactly what the figure depends on.
The manual method
- Take today's cash. Use the bank balance from your books, after any stock buy that has already been paid.
- List the months ahead. Twelve months is enough for most brands, and Shopify's guide suggests keeping a rolling 12-month cash flow forecast.
- Forecast cash out each month. Include fixed costs, ad spend, stock you have committed to and tax bills.
- Forecast cash in each month. Use expected sales, with peak months such as December at their own level, and allow for when payouts land.
- Walk the balance forward. Add each month's cash in and take away its cash out.
- Find the month cash runs out. Count the months until the balance crosses zero, or your chosen floor.
- Repeat with a weaker month. Cut your peak month's sales by 20% and count again.
The same job in Luca
Luca does steps one to six for you. It reads cash and costs from Xero or QuickBooks, and sales and payouts from Shopify. It builds the cash forecast, works out runway from that forecast and your burn, and checks the forecast against actuals every night. Step seven is the Runway card's scenario rows, or a question in chat when you want a different assumption.
A worked example: runway after a gifting-season stock buy
This is an illustrative calculation with sample figures, not a Luca output. A jewellery brand starts December with the cash left after paying for its gifting-season stock in November. The first table sets out the assumptions, and the second walks the cash forward month by month.
| Assumption | Sample figure |
|---|---|
| Cash on 1 December, after the stock buy | £120,000 |
| Stock buy, paid in November | £150,000 |
| A normal month after the season | £80,000 out, £60,000 in |
| Net burn in a normal month | £80,000 − £60,000 = £20,000 |
| Cash out, September to November, including the stock buy | £330,000 |
| Cash in, September to November | £180,000 |
| Trailing net burn | (£330,000 − £180,000) ÷ 3 = £50,000 a month |
| Runway on trailing burn | £120,000 ÷ £50,000 = 2.4 months |
| Month | Cash out | Cash in, on forecast | Cash at end, on forecast | Cash in, December 20% below | Cash at end, weak December |
|---|---|---|---|---|---|
| Start, 1 December | £120,000 | £120,000 | |||
| December | £90,000 | £150,000 | £120,000 + £150,000 − £90,000 = £180,000 | £150,000 × 0.8 = £120,000 | £120,000 + £120,000 − £90,000 = £150,000 |
| January | £80,000 | £50,000 | £180,000 − £30,000 = £150,000 | £50,000 | £150,000 − £30,000 = £120,000 |
| February | £80,000 | £50,000 | £150,000 − £30,000 = £120,000 | £50,000 | £120,000 − £30,000 = £90,000 |
| March | £80,000 | £60,000 | £120,000 − £20,000 = £100,000 | £60,000 | £90,000 − £20,000 = £70,000 |
| April onwards, at £20,000 net burn | £100,000 ÷ £20,000 = 5 more months | £70,000 ÷ £20,000 = 3.5 more months | |||
| Runway from 1 December | 4 + 5 = 9 months | 4 + 3.5 = 7.5 months |
The trailing method says the brand is nearly out of cash, at 2.4 months, because the stock buy sits inside its three-month average. The forecast says nine months, or seven and a half if December disappoints. A weak December costs a month and a half of runway, and that is the number worth planning around.
Get runway switched on
- Connect Shopify. Shopify brings in orders, refunds, payouts and fees. The set-up guide walks through it.
- Connect Xero or QuickBooks. Xero connects self-serve by OAuth, and QuickBooks Online connects by OAuth with full accounting detail. The free-cash-flow forecast needs one of them.
- Ask Luca's team to switch forecasting on. Forecasting is switched on per client, so speak to your Luca contact.
- Open Numbers › Cash. Once the books have synced, read the cash forecast and the Runway card.
How runway works with the rest of Luca
Xero and QuickBooks
Xero brings in the P&L, balance sheet, bank transactions, invoices and bills, and QuickBooks Online brings full accounting detail. That is where burn, free cash flow and burn multiple come from. Access is read-only: Luca reads your books and never writes to them, as the read-only access page explains.
Shopify
Shopify supplies orders, inventory, refunds, payouts and fees. Luca matches orders to Shopify payouts and to the ledger, so revenue, cash and the books agree. That matters for runway, because cash in is counted when the payout lands, not when the order is placed.
Working capital
The Working capital card sits beside Runway. It shows stock, debtor and creditor days and the cash-conversion cycle. When runway shortens, this card often shows why: more days of stock means more cash waiting on the shelf. Your reorder points help you keep that number in check.
Chat
You can ask about runway in plain English, and the answer draws on your books, store and forecast together. The cross-source answers page shows how one answer pulls from several sources.
Revenue and demand forecasts
Runway rests on the forecasts behind it. The revenue forecast sets the cash coming in, and the inventory demand forecast shows which stock will sell and when. Daily revenue, demand and free-cash-flow forecasts are all checked nightly.
Who uses cash runway, and how
Founders and CEOs
A founder checks runway after every large commitment: a stock buy, a new hire or a bigger ad budget. She reads the weaker scenario rows before she commits, not after. The daily view of the whole business puts runway next to sales and ad spend.
CFOs and finance leads
A finance lead uses runway in the monthly close and the board pack. Because the figures trace back to Xero or QuickBooks, every number can be explained. Free cash flow and burn multiple answer the board's next question, which is whether the burn is buying growth.
Operations and inventory leads
An operations lead reads runway before agreeing the size of the next stock buy. The cash tied up in stock and the inventory days show what the buy will do to cash. The product profitability analysis shows which lines earn their place on the shelf.
How Luca AI compares for cash runway
Luca works out runway from the cash-flow forecast and your burn, shows it under several scenarios, and reads Xero or QuickBooks beside Shopify. Free cash flow and burn multiple sit next to it. Luca AI is the only platform in this table that does all four.
Cash runway features, from each platform's public documentation:
| Platform | Luca AI | Lifetimely by AMP | Saras Analytics | Triple Whale | Daasity | Shopify Sidekick |
|---|---|---|---|---|---|---|
| Runway in months from the cash forecast | Yes | Not in docs | Not in docs | Not in docs | Not in docs | Not in docs |
| Runway under sales scenarios | Yes | Not in docs | Not in docs | Not in docs | Not in docs | Not in docs |
| Free cash flow and burn multiple | Yes | Not in docs | Not in docs | Not in docs | Not in docs | Not in docs |
| Xero or QuickBooks beside Shopify | Yes | Partly (QuickBooks syncs your expenses) | Yes (Xero connector for financial data) | Not in docs | Not in docs | Not in docs |
Yes: documented and built in. Partly: documented with a limit, shown in brackets. Not in docs: not found in the vendor's public documentation.
Why Luca AI is the stronger choice for cash runway
- Runway from your own books and forecast. Luca works out runway from the cash forecast and burn. Triple Whale's docs suggest you use tax collection data to manage cash flow, with no runway figure documented. See the Triple Whale alternatives comparison.
- The whole ledger, not only expenses. Luca reads Xero or QuickBooks for burn, free cash flow and burn multiple. Lifetimely documents a QuickBooks Online link that syncs your expenses. See the Lifetimely alternatives comparison.
- A forecast that checks itself. Luca checks its forecasts against actuals every night. Daasity's docs describe a way to compare daily performance against your marketing budget projections, which you enter yourself. See the Daasity alternatives comparison.
Competitor details checked against each vendor's public documentation on 7 November 2026. Features and plans change, so confirm with the vendor before you decide.
Limits of cash runway in Luca
- It needs your books. Runway and the free-cash-flow forecast need Xero or QuickBooks connected. Without them, there is no free-cash-flow forecast.
- It is switched on per client. Forecasting, and the runway built on it, is switched on by Luca's team for each brand.
- It reads, it doesn't act. Luca reads your ledger, store and bank data. Every decision about spending, stock and supplier terms stays with you.
- It rests on the forecast. Runway follows the cash forecast, so a peak month that sells very differently from forecast moves it. The nightly check corrects the forecast as actual sales come in.
Common questions
What is cash runway?
Cash runway is the number of months your cash will last at the current burn. The simple formula divides cash by monthly net burn. For a seasonal ecommerce brand, a month-by-month cash forecast gives a truer figure, because it allows for peak months.
How does Luca work out cash runway?
Luca works out cash runway from the cash-flow forecast and your burn. It reads burn from Xero or QuickBooks and cash coming in from Shopify. The Runway card on Numbers › Cash shows the result under several scenarios.
Do I need Xero or QuickBooks for runway?
Yes. Runway and the free-cash-flow forecast need Xero or QuickBooks connected, because burn and cash come from your books. Xero connects self-serve by OAuth, and QuickBooks Online connects by OAuth with full accounting detail.
Can Luca change anything in my accounts?
No. Luca reads your books and never writes to them. It doesn't post journals, change invoices or move money. Your Shopify store and ad accounts are read the same way, so runway is a reading, never an action on your systems.
How does a big stock buy affect my runway?
A stock buy lowers your cash straight away and raises burn for that month. If you use a trailing three-month average, runway can look far shorter than it is. A forecast-based runway also counts the sales that stock is expected to bring in.
Can I see runway if December sells below forecast?
Yes. The Runway card shows runway when sales follow the forecast and when sales come in 20% below it. You can also ask in chat for runway under a different assumption, and Luca answers from your forecast and books.
What is the difference between net burn and gross burn?
Gross burn is your total monthly spending. Net burn is spending minus the cash you bring in. Net burn is the usual basis for runway, and gross burn gives a worst case where nothing sells.
What does free cash flow add to runway?
Free cash flow is operating cash flow minus capital expenditure. It shows whether the business generates cash after running and investing in itself. With Xero or QuickBooks connected, Luca shows free cash flow and a forward free-cash-flow forecast next to runway.
What is burn multiple, and where do I see it?
Burn multiple compares the cash you burn with the growth that cash buys. A lower figure means more growth for each pound burned. Luca adds burn multiple to your metrics once Xero or QuickBooks is connected.
How often does the runway update?
The forecast behind runway is checked against actuals every night and corrected. As December's real sales and payouts come in, the cash forecast moves, and so does the runway figure.
Can Luca warn me when runway gets short?
Luca supports threshold alerts, for example when runway falls under 60 days. Ask your Luca contact to set the threshold that matches your floor, so you hear about a short runway before you see it.
How is runway different from a 13-week cash forecast?
A 13-week cash forecast shows cash week by week, so you can see which week a bill or payout lands. Runway turns the longer forecast into one figure in months. Use the 13-week view for timing and runway for how long the cash lasts.
Can I put runway in a board pack?
Yes. Luca writes a PDF board pack with cash and runway on the first page, beside revenue and profit. The figures come from the same forecast and books you see on the Cash tab, so they match.
Updated 7 November 2026: first published, with the methods explainer, burn measures, the manual method and a worked example for a gifting-season stock buy.