
To calculate CAC for an ecommerce brand, you divide what you spent on marketing by the number of new customers you won in the same period. The hard part is that Meta, Google and Amazon each report their own cost per customer, and none of those figures matches the new customers in your Shopify store. Luca AI, an AI analyst for ecommerce brands, works out both numbers the same way every week. Blended CAC comes from total marketing spend and Shopify new customers, and CAC per platform comes from each platform's own spend and its own reported results.
At a glance
| Question | Answer |
|---|---|
| What is blended CAC? | Total marketing spend divided by new customers, also called true CAC. |
| What is CAC per platform? | One platform's spend divided by the results that platform reports for itself. |
| Where do new customers come from? | Your Shopify store, the record of what sold. |
| How often is it worked out? | Week by week, from sources that refresh once a day overnight. |
| Does Luca tie customers to ads? | No. Luca has no attribution model, so per-platform figures rest on each platform's own reporting. |
| Where do you see it? | The Marketing tab in Numbers, and in chat when you ask. |
| Can it change your ad accounts? | No. Every connection is read-only. |
What customer acquisition cost in Luca is
Customer acquisition cost is a standard metric in Luca. That means it is calculated for every brand that connects the sources it needs: Shopify for new customers, and the ad platforms for spend. Luca shows two versions side by side, because each one answers a different question.
Blended CAC answers "what does growth cost the business?" It divides total marketing spend by new customers, so it can't be flattered by any one platform's reporting. CAC per platform answers "what does each platform say it costs?" It divides that platform's spend by the results the platform reports, which is the same figure you would see in its own ads manager.
Both sit on the Marketing tab of your Numbers dashboard, headed Which ad spend made money, after product costs and returns. Luca's team builds that dashboard for your brand, and it refreshes every morning.
What you see on the Marketing tab
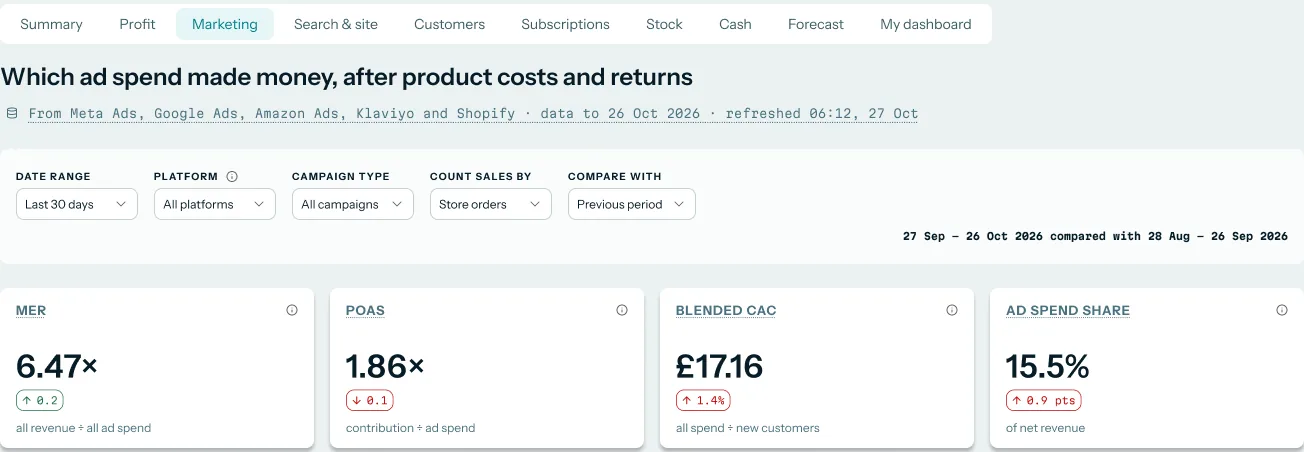
The top of the tab carries a row of headline cards. One of them is Blended CAC, with the change against the comparison period and the formula written underneath. Filters above the cards set the date range, the platform, the campaign type and the period to compare with.
 Illustrative example · demo brand
The Blended CAC card shows the formula under the figure, so anyone in the budget meeting can see how it was worked out. The figures are sample data for a demo brand.
What it is not
It is not an attribution model. Luca never decides which ad, creative, campaign or platform won a particular customer or order. When you see CAC for Meta, that figure uses Meta's spend and the results Meta reports, under Meta's own counting rules.
It is not a control panel either. Luca reads from your ad accounts and your store and writes to none of them, so it never changes a budget, a bid or a campaign.
Why customer acquisition cost matters
What it's for
Customer acquisition cost tells you what each new customer really costs, across every channel and for each ad platform. It is the number you set budgets against. It also tells you how much a customer has to spend with you before that budget pays for itself.
How it helps
- One honest cost per customer. Blended CAC uses every pound of marketing spend and every new customer in your store.
- Each platform's own view, side by side. CAC per platform shows what Meta, Google and Amazon each report, next to the blended figure.
- Drift you can see early. Week-by-week figures show when platform CAC holds steady while blended CAC climbs.
- A number finance trusts. The formula is fixed, written down and the same every week.
What happens without it
Without a blended figure, you judge growth by the cheapest number on the screen. Spend keeps rising while new customers stay flat, and nobody notices until the month-end accounts show a smaller margin. By then the budget for next quarter is already set.
Why buyers care
Heads of growth care most in the week before a budget meeting, when they have to defend where the next pound goes. Founders and finance leads care when cash is tight and every new customer has to pay back within a few months.
The Luca AI approach to customer acquisition cost
Picture the head of growth at a men's grooming brand on Shopify, selling beard oil, razors and shaving cream. In Meta Ads Manager, the cost per purchase looks cheap and steady. Yet blended CAC across every channel has risen for three months running, and the budget meeting is next Thursday.
The usual fix is a spreadsheet. Someone exports spend from Meta, Google and Amazon Ads, pulls new customers from Shopify, and lines the dates up by hand. It can take most of a morning, the formula drifts from month to month, and the platform figures rarely add up to the store's total.
What changed is simple. Each platform counts a sale under its own rules, so the same buyer can show up in more than one report. A per-platform figure can stay flat while the business pays more for every real new customer. You need both numbers, worked out the same way, before you can say which one is moving.
Luca AI works out blended CAC from total marketing spend and Shopify new customers. CAC per platform comes from each platform's spend and its own reported results. Luca does this week by week, from connections that refresh overnight and are read-only. Luca's team agrees the definitions with you once, so every later figure uses the same rule.
The formula is printed on the Blended CAC card itself: all spend divided by new customers. That is the same definition Luca's glossary uses, which is covered in How Luca AI compares for customer acquisition cost, below.
How CAC gets calculated
There are four common ways to put a number on customer acquisition cost. They give different answers from the same data, so it helps to know which one you are looking at before you defend it in a meeting.
Blended CAC
Blended CAC divides total marketing spend by the number of new customers in the same period. It catches the true cost of growth, because no platform can claim a customer twice. What it misses is the split: it can't tell you which channel is getting dearer. Keep the date range identical for spend and customers, as Shopify's guide to blended marketing metrics advises.
Platform-reported CAC
Each ad platform divides its own spend by the conversions it reports. It catches movement inside that platform quickly, such as a campaign whose cost per purchase jumps. It misses overlap: Meta uses attribution settings that decide when conversions are credited to ads, and Google lets you pick a model. The same shopper can be counted by both, and a returning customer can look like a new one.
CAC from an attribution model
An attribution model shares the credit for each order across the touchpoints before it. In single-touch attribution, one interaction gets 100% of the credit; multitouch models split it by fixed rules or by machine learning. It catches the path a buyer took, when tracking works. It misses whatever the tracking can't see, and the answer changes with the model you pick.
Fully loaded CAC
Fully loaded CAC adds costs beyond ad spend, such as agency fees, creative production or free samples, before dividing by new customers. It catches the whole cost of winning a customer. It misses comparability, because every brand chooses different costs to add.
What this means for your CAC in Luca
Luca works out the first two, blended CAC and CAC per platform, and shows them side by side. It doesn't run an attribution model. If your brand counts marketing spend differently, Luca's team sets your own definition with you, in place of Luca's default.
Read blended CAC next to CAC per platform
Start with the blended figure, then look at the platforms. The question is never "which number is right?" Both are right for what they measure. The question is which one is moving, and whether the other moves with it.
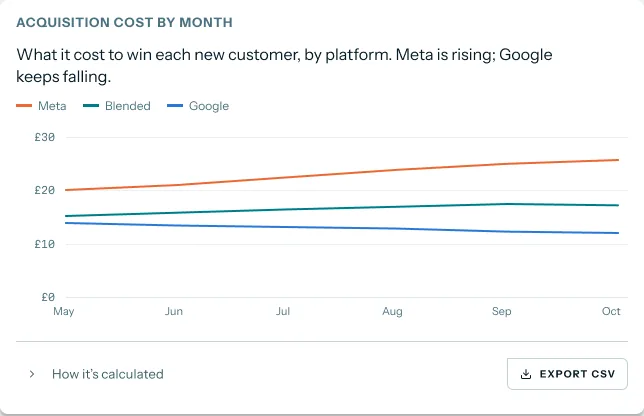
The Marketing tab charts acquisition cost by month, with the blended line between the platform lines. You can export the chart's data as a CSV for your own deck, or use the KPI report pack when finance wants the same figures in a board report.
 Illustrative example · demo brand
The blended line comes from total spend and Shopify new customers, while the Meta and Google lines use each platform's own reported results. The figures are sample data for a demo brand.
When the two lines drift apart
If platform CAC is flat and blended CAC climbs, extra spend is buying results the platform counts but your store doesn't see as new customers. If both climb together, the platform really is getting dearer. If blended CAC falls while one platform rises, another channel is doing more of the work.
None of these readings ties a customer to an ad. They tell you where to look next. From there, ROAS by platform and campaign shows whether the spend still makes money after product costs.
Ask about CAC in chat
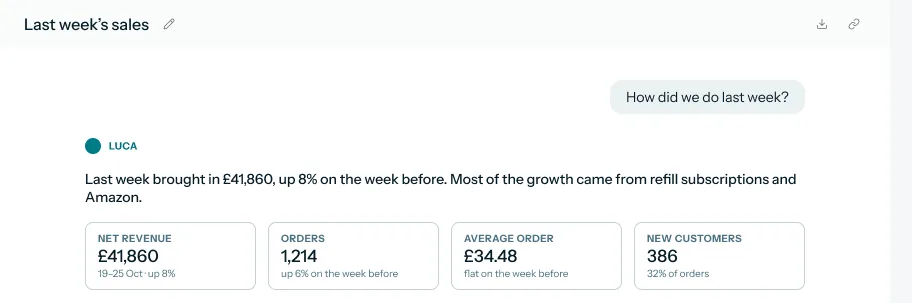
You can ask Luca in plain English, for example "What was blended CAC each week this quarter, next to Meta's?" It answers with figures, a chart where useful and next steps. Each figure links to the table it came from, and you can download the data as CSV or Excel.
 Illustrative example · demo brand
New customers sit in the first answer to a simple question, so the denominator of blended CAC is never hidden. The figures are sample data for a demo brand.
An answer can combine ad spend, store orders and the accounting ledger in one reply. That matters when finance asks how CAC compares with the margin in your books. The page on answers that draw on several sources shows how that works.
How to tell whether your CAC is healthy
A CAC figure on its own says little. It needs something to be measured against: what a customer is worth, and how fast they pay back. These are the two measures CAC feeds directly.
LTV to CAC
LTV to CAC divides what a customer is worth over time by what it cost to win them. Shopify treats 3:1 as the usual benchmark, while noting your target depends on your margins and operating costs. Its weak spot is the LTV half: a projected lifetime value is a forecast, and a blended ratio can hide a channel that brings in low-value customers at a high cost.
CAC payback
CAC payback is the number of months a new customer takes to earn back what you paid to win them, usually from gross margin. Shopify's guide suggests you check how quickly purchases repay CAC, because projected earnings don't pay this month's bills. Its weak spot is the margin: if product costs or returns are wrong, payback looks faster than it is.
Where Luca shows them
You can ask Luca for any ratio between its figures, such as LTV to CAC, directly in chat. It calculates the answer from the same data as the dashboard. CAC payback is set up per client for subscription brands. Lifetime value itself is covered on customer retention analysis, which follows each month's new customers over time.
How to calculate CAC
Here is the job done by hand, then the same job in Luca, then a worked example you can check with a calculator.
The manual method
- Pick one period, such as a week or a month, and use it for every figure.
- Export spend for that period from Meta Ads Manager, Google Ads and Amazon Ads.
- Convert any spend in other currencies to your reporting currency, and add it all up.
- Pull the number of new customers for the same period from Shopify's customer reports.
- Divide total spend by new customers. That is blended CAC.
- For each platform, divide its spend by the purchases it reports for the same period. That is CAC per platform.
- Put the blended and platform figures side by side, and repeat every week with the same formula.
The common mistakes are mismatched date ranges, a platform's spend left out, and a formula that quietly changes between months.
The same job in Luca
Once Shopify and your ad platforms are connected, Luca does steps one to seven for you, every week. Blended CAC is total marketing spend over Shopify new customers, and CAC per platform uses each platform's own spend and reported results. Open the Marketing tab in Numbers, or ask in chat. The definition stays fixed unless you agree a change with Luca's team.
A worked example: three months of rising CAC
This is an illustrative calculation with sample figures, not a Luca output. It follows the grooming brand from the approach section, which spends on Meta and Google.
| Month | Total ad spend | Shopify new customers | Blended CAC (spend ÷ customers) | Meta spend | Meta-reported purchases | Meta CAC (spend ÷ purchases) |
|---|---|---|---|---|---|---|
| July | £27,000 | 1,200 | £27,000 ÷ 1,200 = £22.50 | £16,000 | 900 | £16,000 ÷ 900 = £17.78 |
| August | £30,000 | 1,200 | £30,000 ÷ 1,200 = £25.00 | £18,000 | 1,000 | £18,000 ÷ 1,000 = £18.00 |
| September | £33,000 | 1,200 | £33,000 ÷ 1,200 = £27.50 | £20,000 | 1,100 | £20,000 ÷ 1,100 = £18.18 |
| October | £36,000 | 1,200 | £36,000 ÷ 1,200 = £30.00 | £22,000 | 1,200 | £22,000 ÷ 1,200 = £18.33 |
Meta's own figure barely moved, rising by about 3% over four months. Blended CAC rose by a third, because spend grew by a third while the store won no extra new customers. By October, Meta reports as many purchases as Shopify has new customers in total, before Google is counted. That gap is the question to take to the budget meeting.
Get CAC working for your brand
Customer acquisition cost needs two kinds of source: your store and your ad platforms. The steps below follow the order most brands use.
- Connect Shopify. It connects self-serve and read-only, and it is Luca's record of what sold.
- Connect Google Ads and Amazon Ads. Both connect self-serve and read-only.
- Connect Meta. Some accounts use OAuth, and others use a guided partner-access set-up with Luca's team.
- Agree your definitions. Luca uses its default definitions unless you set your own with Luca's team during onboarding.
The full walk-through is on setting up Luca, and the page on read-only access explains what each connection can and can't touch.
How customer acquisition cost works with the rest of Luca
Shopify
Shopify supplies the new customers behind blended CAC, along with orders, refunds and products. The same customers feed cohort retention, so CAC and lifetime value start from one customer list.
Meta, Google Ads and Amazon Ads
Each platform supplies its spend and its reported results. Meta is read at account, campaign, ad and creative-asset level. Google Ads is read by campaign type, and Amazon Ads by campaign, keyword and placement. Every source refreshes once a day, overnight.
Xero and QuickBooks
Both accounting tools connect read-only. With your ledger connected, you can set CAC beside gross and operating margin from your books, which is how a finance lead checks whether growth spend fits the budget.
Chat and Slack
Every CAC figure can be asked for in chat, and the answer links back to its source table. On the Leadership plan and above, you can also ask Luca from Slack.
Who uses customer acquisition cost, and how
Growth and marketing leads
A growth lead checks blended CAC every Monday against the platform lines. When they drift apart, they look at ROAS by platform before moving budget between channels.
Founders and CEOs
A founder wants one number for what growth costs, not three dashboards that disagree. Blended CAC sits with sales, profit and cash on the morning view of the whole business.
CFOs and finance leads
A finance lead needs CAC worked out the same way every month, so the board pack holds up. The fixed formula and the source link on every figure make it easy to check, and one set of KPI definitions keeps it consistent across reports.
Subscription DTC brands
A subscription brand cares how fast a new subscriber pays back. Luca sets up CAC payback per client for subscription brands, next to blended CAC.
How Luca AI compares for customer acquisition cost
Luca AI shows blended CAC and CAC per platform side by side, every week, with your accounting ledger in the same place. It doesn't add its own attribution model, so the blended figure rests on your store and each platform figure on that platform's reporting. Luca AI is the only platform in this table that does all three.
Customer acquisition cost features, from each platform's public documentation:
| Platform | Luca AI | Triple Whale | Northbeam | Lifetimely by AMP | Daasity | Shopify Sidekick |
|---|---|---|---|---|---|---|
| Blended CAC (spend ÷ new customers) | Yes | Yes (NCPA from blended ad spend) | Not in docs | Yes (Blended CAC metric) | Yes (marketing spend over new customers) | Not in docs |
| CAC per ad platform | Yes | Yes (Pixel NCPA by channel) | Yes (CAC from attributed transactions) | Partly (CPA per platform) | Partly (channel-level CPA from attribution) | Yes (CAC by marketing channel) |
| Xero or QuickBooks in the same place | Yes | Not in docs | Not in docs | Yes (QuickBooks cost sync) | Not in docs | Not in docs |
Yes: documented and built in. Partly: documented with a limit, shown in brackets. Not in docs: not found in the vendor's public documentation.
Why Luca AI is the stronger choice for customer acquisition cost
- Both figures, worked out the same way. Luca shows blended CAC next to CAC per platform. Triple Whale's per-channel figure is new-customer cost as reported by its Pixel. Luca AI vs Triple Whale
- A blended figure as well as a platform one. Luca puts blended CAC on the Marketing tab. Lifetimely's platform breakdown shows spend, CPA, conversions and ROAS per platform rather than new-customer CAC. Luca AI vs Lifetimely
- Your books in the same answer. Luca reads Xero and QuickBooks alongside your ad platforms. Daasity's channel figures come from attribution data rolled up to channel and vendor. Luca AI vs Daasity
Competitor details checked against each vendor's public documentation on 7 November 2026. Features and plans change, so confirm with the vendor before you decide.
Limits of customer acquisition cost in Luca
- No attribution model. Luca never assigns a customer, order or sale to an ad, creative, campaign or platform. CAC per platform rests on each platform's own reporting.
- New customers come from Shopify. Blended CAC uses the new customers your store records.
- Overnight refresh. Sources refresh once a day, so today's spend appears in tomorrow's figures.
- Read-only. Luca can show that CAC is rising, but it doesn't change budgets, bids or campaigns. You make those changes in each ad platform.
- Payback is per client. CAC payback is set up for subscription brands with Luca's team, rather than shown for every brand.
Common questions
How do you calculate CAC for an ecommerce store?
Divide total marketing spend for a period by the number of new customers in the same period. Luca does this every week, using your connected ad spend and the new customers recorded in your Shopify store.
What is the CAC formula?
The standard formula is CAC = total marketing spend ÷ new customers. Luca uses it as the default for blended CAC, which it also calls true CAC, and prints it on the Blended CAC card.
What is the difference between blended CAC and CAC per platform?
Blended CAC divides all marketing spend by all new customers in your store. CAC per platform divides one platform's spend by the results that platform reports. Luca shows both side by side, week by week.
Why is Meta's cost per purchase lower than my blended CAC?
Meta counts conversions under its own attribution settings, and other platforms count under theirs. The same buyer can be counted twice, and a returning buyer can count as a purchase. Blended CAC counts each new customer once.
Does Luca tie each new customer to an ad?
No. Luca has no attribution model. It never assigns a customer or order to an ad, creative, campaign or platform. Per-platform CAC uses each platform's own spend and its own reported results.
Where does Luca get new customers from?
From Shopify, which Luca treats as the record of what sold. The same new customers feed blended CAC and the retention cohorts, so both start from one customer list.
How often does CAC update?
Every connected source refreshes once a day, overnight. The Numbers dashboard refreshes every morning, and Luca works out blended CAC and CAC per platform week by week.
Can I change how Luca defines CAC?
Yes. Luca uses its default definitions for every customer unless you set your own. You agree your brand's definition with Luca's team, and every later figure uses it.
Can Luca work out LTV to CAC?
Yes. You can ask Luca for any ratio between its figures, such as LTV to CAC, directly in chat. It calculates the ratio from the same data that drives the dashboard.
Does Luca show CAC payback?
CAC payback is set up per client for subscription brands. It shows how many months a new customer takes to earn back what it cost to win them.
Which ad platforms does Luca use for CAC?
Meta, Google Ads and Amazon Ads. Google Ads and Amazon Ads connect self-serve. Meta connects by OAuth for some accounts and through a guided partner-access set-up with Luca's team for others.
Can Luca change my ad budgets when CAC rises?
No. Every connection is read-only. Luca reads from your store and ad accounts and writes to none of them, so any change to budgets or bids is yours to make.
Can I export CAC for a budget meeting?
Yes. The chart on the Marketing tab has an Export CSV button, and any chat answer can be downloaded as CSV or Excel.
Is blended CAC the same as MER?
No. MER divides total revenue by total ad spend, so it measures return. Blended CAC divides total marketing spend by new customers, so it measures the cost of each new customer. Luca shows both on the Marketing tab.
Updated 7 November 2026: first version, with the four ways CAC gets calculated, LTV to CAC and payback, the manual method and a worked example.