A Google Ads reporting tool has one job for a Shopify brand: show whether the money you give Google comes back as store revenue. Google Ads reports its own conversions, counted its own way, so its numbers rarely match what Shopify recorded. Luca AI connects to Google Ads read-only, including Shopping, Performance Max and YouTube. It sets Google's spend and reported results beside your Shopify revenue, so you judge payback on real sales.
At a glance
| What you want to know | The short answer |
|---|---|
| What Luca reads from Google Ads | Campaign, ad group, keyword, search term, asset and location results, impression share, conversion actions, Shopping results by product, and YouTube by campaign, ad group and video |
| Campaign types covered | Search, Shopping, Performance Max and YouTube, split by campaign type |
| What it is set beside | Your Shopify revenue, plus spend from any other ad platform you connect |
| How it connects | Self-serve, on the Google card in Sources, by approving read-only access on Google's own screen |
| What it writes to Google Ads | Nothing. Luca never changes campaigns, bids or budgets |
| How fresh the figures are | Refreshed automatically once a day, overnight |
| Whose conversions you see | Google's own count, shown as Google reports it. Luca does not assign orders to campaigns |
What the Google Ads connection is
The Google Ads connection is a read-only link between your Google Ads account and Luca. It covers paid search, Shopping, Performance Max and YouTube. Once it is connected, Luca reads your campaign results every night and keeps them in your brand's private warehouse, next to your Shopify orders.
Google Ads sits on one Google card with Google Analytics 4 and Google Search Console. You can connect all three, or only Google Ads. The connection is self-serve, so you do it yourself in a few minutes, with no call to book.
What you see on the Sources screen
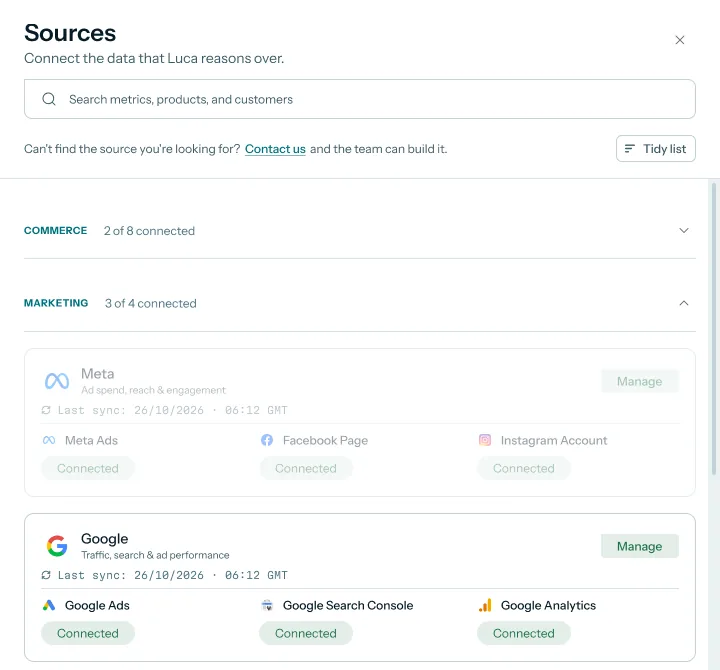
Open Sources from the left rail. Your connectors are grouped as Commerce, Marketing, Email & subscriptions, Finance, Payments and Banking. Google Ads is in Marketing, on the card labelled "Traffic, search & ad performance". Once connected, the card shows its last sync time and a Connected badge for each Google source.
 Illustrative example · demo brand
The last sync time on the Google card tells you your ad figures come from last night's refresh. Dates and counts are sample data for a demo brand.
What Luca reads from Google Ads
Luca reads the reports a growth lead would otherwise export by hand:
- Performance by level: campaign, ad group, keyword, search term, asset and location results.
- Campaign type: the same results split by campaign type, so Search, Shopping, Performance Max and YouTube sit in separate rows.
- Shopping: Google's own Shopping results for each product, as Google reports them.
- Search reach: impression share, and the share of impressions lost to budget.
- Conversions: your conversion actions, with the conversions and conversion value Google counts.
- YouTube: results at campaign, ad group and video level, with Google's own recommendations.
From these, Luca works out the acquisition figures it calculates for every brand that connects the source. They include ROAS by platform and campaign, cost per conversion, ad spend as a share of revenue and break-even ROAS.
What it is not
It is not an attribution tool and it is not a campaign manager. Luca doesn't decide which campaign earned an order, and it never edits anything in Google Ads. You keep running campaigns in Google; Luca shows you what that spend looks like against your store. Our page on read-only access explains how that works for every source.
Why Google Ads reporting matters
What it's for
Google Ads reporting tells you whether Google spend pays back in your store. A useful report sets Google's spend and reported results beside the revenue Shopify actually recorded, for the same days.
How it helps
- One view of spend and sales: Google's spend sits beside Shopify revenue, without a weekly export.
- Campaign types kept apart: Performance Max, Shopping, Search and YouTube each show their own spend and clicks.
- A margin-based bar: break-even ROAS comes from your gross margin, so you know the line Google has to clear.
- Plain-English questions: you ask about Google in chat and get figures back, with each one linked to its table.
What happens without it
Without a joined view, you judge Google on Google's own scorecard. A rising reported ROAS can hide flat store revenue, and nobody notices until the margin review. Budget decisions then rest on a count the store never sees.
Why buyers care
Heads of growth care when the founder asks whether Google earns its budget, usually before a season or a budget increase. Finance leads care at month end, when ad spend has to be explained against revenue and margin.
The Luca AI approach to Google Ads reporting
Think of the head of growth at a Shopify garden-tools brand in late winter. Spring is the brand's peak, and she runs Performance Max, Shopping and YouTube campaigns. The founder wants to know whether Google pays back before the budget goes up for March.
The usual answer is a spreadsheet. She exports Google's campaign report, exports Shopify sales for the same dates, and lines them up by hand. That can take an afternoon each week, and it happens just when spring planning needs her most. The totals rarely agree, because Google counts conversions its own way, and the sheet goes stale by Monday.
What changed is simple. Ad accounts and the store already keep good records, and a read-only connection can read both every night. The work that remains is putting them side by side with the same dates and the same definitions.
Luca AI reads Google Ads read-only and sets the spend beside your Shopify revenue. It splits Google's results by campaign type, keeps Google's reported conversions as Google's own count, and works out MER, ad spend share and break-even ROAS. You ask about any of it in plain English.
Google Ads connects self-serve on the Google card, refreshes every night, and writes nothing back to Google. Campaign types, search terms and impression share all come in through that one connection. The detail is covered in How Luca AI compares for Google Ads reporting, below.
How Google Ads payback gets measured
There are four common ways to judge whether Google spend pays back. Each catches something the others miss, so it helps to know what each one can and can't tell you.
Google's reported ROAS
ROAS is revenue attributable to ads divided by the cost of those ads. In Google Ads, that revenue is Google's conversion value. It is quick to read and it splits by campaign, which makes it useful for comparing one campaign with another. Its weak spot is the count itself. Google takes credit for any user who touches a Google campaign at any point, even if that person later clicks another channel before buying.
Attribution windows and models
Google's default is a 30-day window using last-click attribution. Other models, such as multitouch attribution, spread credit across every touchpoint. A model can help explain a journey, but each platform runs its own. So Google, Meta and Shopify can each report a different figure for the same sale.
Blended MER
MER is total revenue divided by total marketing spend. It uses the store's own revenue, so it can't be inflated by a platform's count. Its weak spot is that it blends every channel. MER tells you whether the whole ad budget pays back, not how much of that Google earned.
Break-even ROAS
Break-even ROAS is 1 divided by your gross margin. At a 40% margin, any campaign below 2.5 loses money on product cost alone. It turns a ROAS figure into a yes or no. Its weak spot is that it is only as good as the margin you feed it.
What this means for your Google Ads reporting
No single measure settles the question. The practical check is to read Google's reported ROAS against break-even ROAS, then watch MER and store revenue when Google spend moves. Luca shows ROAS by platform and campaign, blended MER, ad spend as a share of revenue and break-even ROAS. It does not run its own attribution model, so Google's conversions stay Google's count.
Read your Google Ads results beside store revenue
Google's figures live on the Marketing tab, under Numbers › Marketing, and in chat. The tab is headed Which ad spend made money, after product costs and returns. It shows your ad platforms together, with filters for date range, platform and campaign type.
Performance Max, Shopping, Search and YouTube
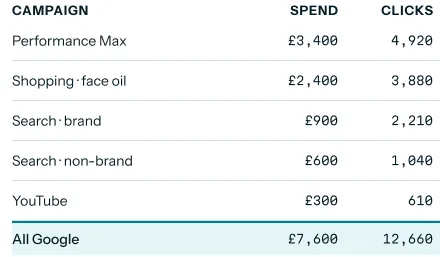
Start with the split by campaign type. Performance Max often takes the largest share of a Shopify brand's Google budget, so check its spend first. Then compare Shopping, brand Search, non-brand Search and YouTube. A type with growing spend and flat clicks is the first one to question. Before you raise Shopping spend on a product for the season, check its stock cover with product demand forecasting.
 Illustrative example · demo brand
Splitting Google's spend by campaign type shows where the budget goes before you judge any return. All figures are sample data for a demo brand.
Try asking Luca:
"How much did we spend on Performance Max, Shopping and YouTube last month, and how did each change from the month before?"
Search terms, keywords and impression share
For Search campaigns, read search terms beside keywords. Search terms show what people actually typed, which is where wasted spend usually hides. Impression share shows how often your ads appeared when they could have. The budget-lost share tells you whether a campaign is held back by budget rather than by bids or relevance.
YouTube results
YouTube results come in at campaign, ad group and video level. Read them for spend and clicks, and treat any conversions as Google's count. Luca also reads Google's own recommendations for YouTube, so you can see what Google suggests without opening the account.
Ask in chat
You can ask about Google in plain English, in the same place as your store and your books. Luca answers with figures, a chart where it helps and next steps, with each figure linked to the table it came from. Our guide to answers across sources shows how one question can span Google, Shopify and Xero.
"Which non-brand search terms cost the most last month with no conversions reported by Google?"
How to measure whether Google spend pays back
Two measures do most of the work for this job. Use them together, because each covers the other's weak spot.
Google's reported ROAS against break-even ROAS
Compare each campaign type's reported ROAS with your break-even ROAS. Below break-even, the campaign loses money even on Google's own generous count. Above it, the campaign may or may not pay back, because Google's count can include sales other channels also claim. Treat a pass here as a necessary check, not proof.
MER and Google's share of revenue
Then watch MER and ad spend as a share of revenue as Google spend changes. If you raise Google spend and store revenue moves with it, MER holds steady. If spend rises and revenue stays flat, MER falls and ad spend share climbs. This measure uses store revenue, so it can't be inflated. Its weak spot is that seasons and other channels move revenue too, so compare like periods.
Where Luca shows both
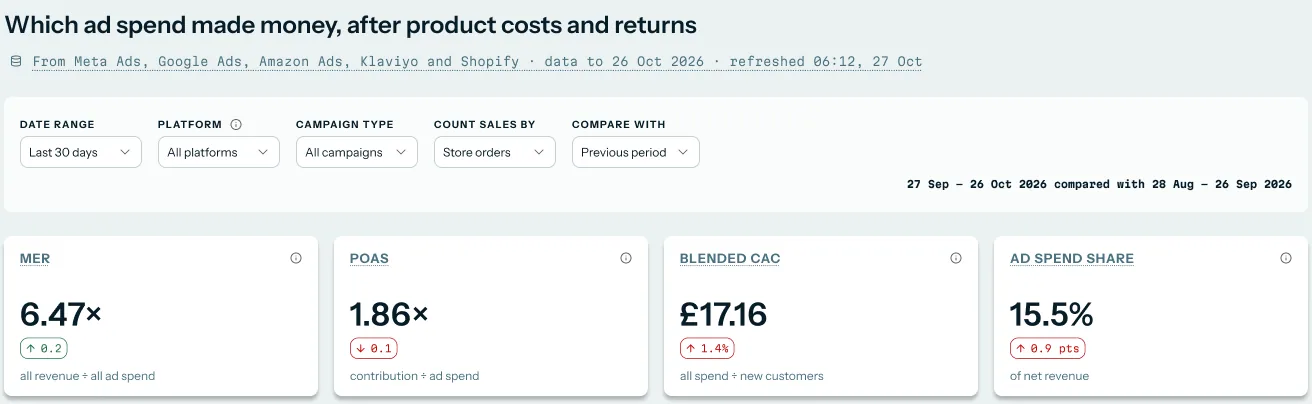
The top of the Marketing tab shows MER as all revenue divided by all ad spend, and ad spend share as a share of net revenue. Each card compares the period with the one before. ROAS by platform and campaign, and break-even ROAS, are there too, and you can ask for either in chat.
 Illustrative example · demo brand
MER and ad spend share use your store's revenue, so they check Google's own count. All figures are sample data for a demo brand.
How to report on Google Ads for a Shopify brand
The manual method
- In Google Ads, export a campaign report for the period, with spend, clicks, conversions and conversion value, segmented by campaign type.
- In Shopify, export net sales for the same dates and the same time zone.
- Add spend from every other ad platform for the same period.
- Work out Google's reported ROAS for each campaign type: conversion value divided by spend.
- Work out MER: Shopify net revenue divided by all ad spend.
- Work out break-even ROAS from your gross margin, then mark each campaign type above or below it.
- Repeat next week, and keep the definitions the same so the trend means something.
The same job in Luca
Connect Google Ads once. Luca refreshes it overnight, beside Shopify and your other sources, and works out ROAS by platform and campaign, MER, ad spend share and break-even ROAS for you. Luca's default metric definitions apply to every brand, and your own definitions can be set with Luca's team. You open the Marketing tab or ask in chat, and download any answer's data as CSV or Excel if you still want a sheet.
A worked example: March Google spend for a garden-tools brand
This is an illustrative calculation with sample figures, not a Luca output. A garden-tools brand has a 40% gross margin, so its break-even ROAS is 1 ÷ 0.40 = 2.5. It raises Google spend for March and keeps Meta spend flat.
| Measure | February | March | How it's worked out |
|---|---|---|---|
| Google spend | £20,000 | £30,000 | From Google Ads |
| Google-reported conversion value | £80,000 | £105,000 | From Google Ads |
| Google's reported ROAS | 4.0 | 3.5 | £80,000 ÷ £20,000; £105,000 ÷ £30,000 |
| Shopify net revenue | £200,000 | £210,000 | From Shopify |
| All ad spend | £40,000 | £50,000 | Google plus Meta |
| MER | 5.0 | 4.2 | £200,000 ÷ £40,000; £210,000 ÷ £50,000 |
| Google spend share of revenue | 10% | 14.3% | £20,000 ÷ £200,000; £30,000 ÷ £210,000 |
| Extra Google spend in March | £10,000 | £30,000 less £20,000 | |
| Extra store revenue in March | £10,000 | £210,000 less £200,000 | |
| Gross profit on the extra revenue | £4,000 | £10,000 × 40% |
Google's reported ROAS of 3.5 is still above the 2.5 break-even line. But store revenue grew by no more than the extra Google spend, and only 40% of that growth is gross profit. MER fell from 5.0 to 4.2, so the increase did not pay back on store sales, whatever Google counted. Seasons move revenue too, so check the same weeks last year before you decide.
Connect Google Ads
- Open Sources from the left rail and expand Marketing.
- On the Google card, click Connect.
- Sign in with a Google account that has admin or owner access to your Google Ads account.
- Approve read-only access on Google's own consent screen. Google then sends you back to Luca.
- Check the card. It shows the last sync time once the first refresh has run.
From the next overnight refresh, answers in chat combine Google Ads with everything else you have connected. If you are setting up Luca for the first time, our set-up guide covers Shopify and your team as well.
How Google Ads works with the rest of Luca
Shopify
Shopify is the record of what sold. It brings in orders, refunds and products with full history, which gives Google's spend a revenue figure to stand against. MER and ad spend share both use it.
Google Analytics 4 and Search Console
GA4 and Search Console sit on the same Google card. Website analytics and Google search performance can be answered together, so you can read paid search beside organic demand for the same terms.
Meta and Amazon Ads
Spend from Meta and Amazon Ads joins Google's in MER and blended CAC. Meta connects through guided partner access with Luca's team; Amazon Ads connects self-serve. The ROAS analysis guide compares every platform at once.
Xero and QuickBooks
Your accounting ledger gives gross and operating margin. That margin sets your break-even ROAS, and it lets you read Google spend against Xero figures at month end.
KPI reports
Google's figures can go into the board pack with the same definitions you use in chat. The KPI reporting guide shows how one set of definitions runs through dashboards, chat and exports.
Who uses Google Ads reporting, and how
Growth and marketing leads
A growth lead checks Google's spend by campaign type each week, reads search terms for waste, and watches MER when budgets move. Before a budget increase, they compare Google's reported ROAS with break-even ROAS.
Founders and CEOs
A founder wants one answer: is Google worth its budget? They ask in chat, see Google's spend beside store revenue, and follow the figures back to their tables. Whether new customers come back is a separate question, covered by customer retention analysis. The overview on seeing the whole business shows where this fits each morning.
CFOs and finance leads
A finance lead reads Google spend as a share of revenue at month end, beside margin from the ledger. They use break-even ROAS to set the bar Google has to clear before the next quarter's budget.
How Luca AI compares for Google Ads reporting
Luca AI reads Google Ads read-only, split by campaign type down to search terms and impression share. It sets the spend beside Shopify revenue and your Xero or QuickBooks ledger in one place. Luca AI is the only platform in this table that does all four.
Google Ads reporting features, from each platform's public documentation:
| Platform | Luca AI | Triple Whale | Northbeam | Daasity | Lifetimely by AMP | Shopify |
|---|---|---|---|---|---|---|
| Performance Max, Shopping and YouTube by campaign type | Yes | Partly (campaign sub-type field, Google only) | Yes (Google and YouTube spend) | Partly (Performance Max at campaign level only) | Not in docs | Not in docs |
| Search terms and impression share | Yes | Yes (Search Terms table) | Not in docs | Not in docs | Not in docs | Not in docs |
| Google spend beside store revenue | Yes | Yes (MER and Blended ROAS) | Yes (Blended MER) | Yes (MER in the metric glossary) | Yes (spend and ROI beside Shopify data) | Yes (ad spend and ROAS report) |
| Xero or QuickBooks in the same place | Yes | Not in docs | Not in docs | Not in docs | Partly (QuickBooks cost and expense sync) | Not in docs |
Yes: documented and built in. Partly: documented with a limit, shown in brackets. Not in docs: not found in the vendor's public documentation.
Why Luca AI is the stronger choice for Google Ads reporting
- Your ledger in the same answer: Luca reads Xero or QuickBooks beside Google spend, while Triple Whale documents MER and Blended ROAS with no accounting source in its docs. Luca AI vs Triple Whale
- Campaign types and search terms: Luca splits Google by campaign type down to search terms, while Lifetimely documents connecting Google Ads to track spend and ROI beside Shopify data. Luca AI vs Lifetimely
- Performance Max in full: Luca reads Performance Max as its own campaign type, while Daasity notes that Performance Max has no ad or ad group data in its ad-level tables. Luca AI vs Daasity
- Store revenue and the ledger beside Google's count: Luca sets Google's reported results beside Shopify revenue and your Xero or QuickBooks margin, while Shopify's marketing report documents ad spend and ROAS with no accounting source. Why platform ROAS and profit drift apart
Competitor details checked against each vendor's public documentation on 7 November 2026. Features and plans change, so confirm with the vendor before you decide.
Limits of the Google Ads connection
- Read-only by design. Luca reads Google Ads and writes nothing to it. It never pauses campaigns, changes bids or moves budgets; every change stays with you in Google Ads.
- Google's conversions are Google's count. Luca shows the conversions and conversion value Google reports. It does not assign orders, sales or customers to a campaign, ad or product.
- Overnight, not live. Google Ads refreshes once a day, overnight, so today's spend appears after the next refresh.
- Google Ads only on this connection. Spend from other ad platforms comes in through their own connections. Pinterest ads are not offered.
Common questions
Does Luca change my Google Ads campaigns, bids or budgets?
No. The Google Ads connection is read-only. Luca reads your campaign results and writes nothing back, so every change to campaigns, bids and budgets stays with you in Google Ads.
Which Google Ads campaign types does Luca read?
Luca reads Search, Shopping, Performance Max and YouTube, and splits the results by campaign type. You can read the spend and clicks for each type separately, or ask about all of Google together.
Does Luca read YouTube ads?
Yes. YouTube results come in through the Google Ads connection at campaign, ad group and video level. Luca also reads Google's own recommendations for those campaigns.
Does Luca read search terms and keywords?
Yes. Luca reads keyword and search term results, as well as ad group, asset and location results. That lets you find search terms that cost money without any conversions reported by Google.
Does Luca tell me which Google campaign drove a particular order?
No. Luca has no attribution model. Google's conversions and conversion value are Google's own count, and Luca shows them as Google reports them, beside the revenue Shopify recorded for the same period.
Why doesn't Google's conversion value match my Shopify revenue?
Google counts a conversion when someone who touched a Google ad buys within its window, even if other channels also played a part. Shopify records every order once. The two counts answer different questions, so they rarely match.
How often do Google Ads figures refresh in Luca?
Google Ads refreshes automatically once a day, overnight, like every other source. The Google card on the Sources screen shows the time of the last sync.
What access do I need to connect Google Ads?
You need admin or owner access to the Google Ads account. You connect it yourself from the Google card and approve read-only access on Google's own consent screen.
Do I need to connect Google Analytics 4 and Search Console as well?
No. They sit on the same Google card, but each is optional. Connecting them lets you read paid results beside site analytics and organic search for the same terms.
Can I see Google spend beside Meta and Amazon Ads?
Yes. Spend from every connected ad platform feeds blended MER and blended CAC, and ROAS is shown by platform and campaign. You can filter the Marketing tab by platform or campaign type.
Where does break-even ROAS come from?
Break-even ROAS is 1 divided by your gross margin. A brand with a 40% margin has a break-even ROAS of 2.5, so any campaign below that loses money on product cost.
Does Luca show impression share for Google Ads?
Yes. Luca reads impression share, and works out the share of impressions lost to budget, for every brand that connects Google Ads. It shows whether a campaign is limited by budget.
Can I export the Google Ads figures?
Yes. Any answer comes with a control to download its data as CSV or Excel, so you can take Google's figures into your own sheet.
Does Luca's team need to set up Google Ads for me?
No. Google Ads is one of the sources you connect yourself. Sources such as WooCommerce, Magento, Recharge and Klaviyo are the ones Luca's team sets up.
Updated 7 November 2026: first published, with the methods explainer, payback measures, worked example and comparison.