Ecommerce Analytics 101: A Beginner’s Guide to Data & Metrics
mins read
TL;DR
Ecommerce analytics runs through four layers: what happened, why, what happens next, and what to do. Most stores never leave layer one.
A Shopify survey of 500 store owners found 77% track revenue while fewer than half track profit margin, traffic, AOV, or conversion rate.
Gross margin hides eight variable costs. One $49.99 SKU at 72% gross margin carried $71.30 in true unit cost, losing $21.31 per order.
Split conversion rate into add-to-cart rate and cart-to-purchase rate. Each points at an opposite fix, and the medians are 24.12% and 70.22% abandonment.
Platform ROAS misleads in both directions. Google brand search reported 19.07x against 5.72x incremental, while Meta acquisition was understated at 1.13x.
Use a three-layer cadence with thresholds written before numbers move, and benchmark against your own trailing trend rather than a stranger's median.
Q1. What is ecommerce analytics, and what does it change on Monday morning? [toc=1. Analytics Defined]
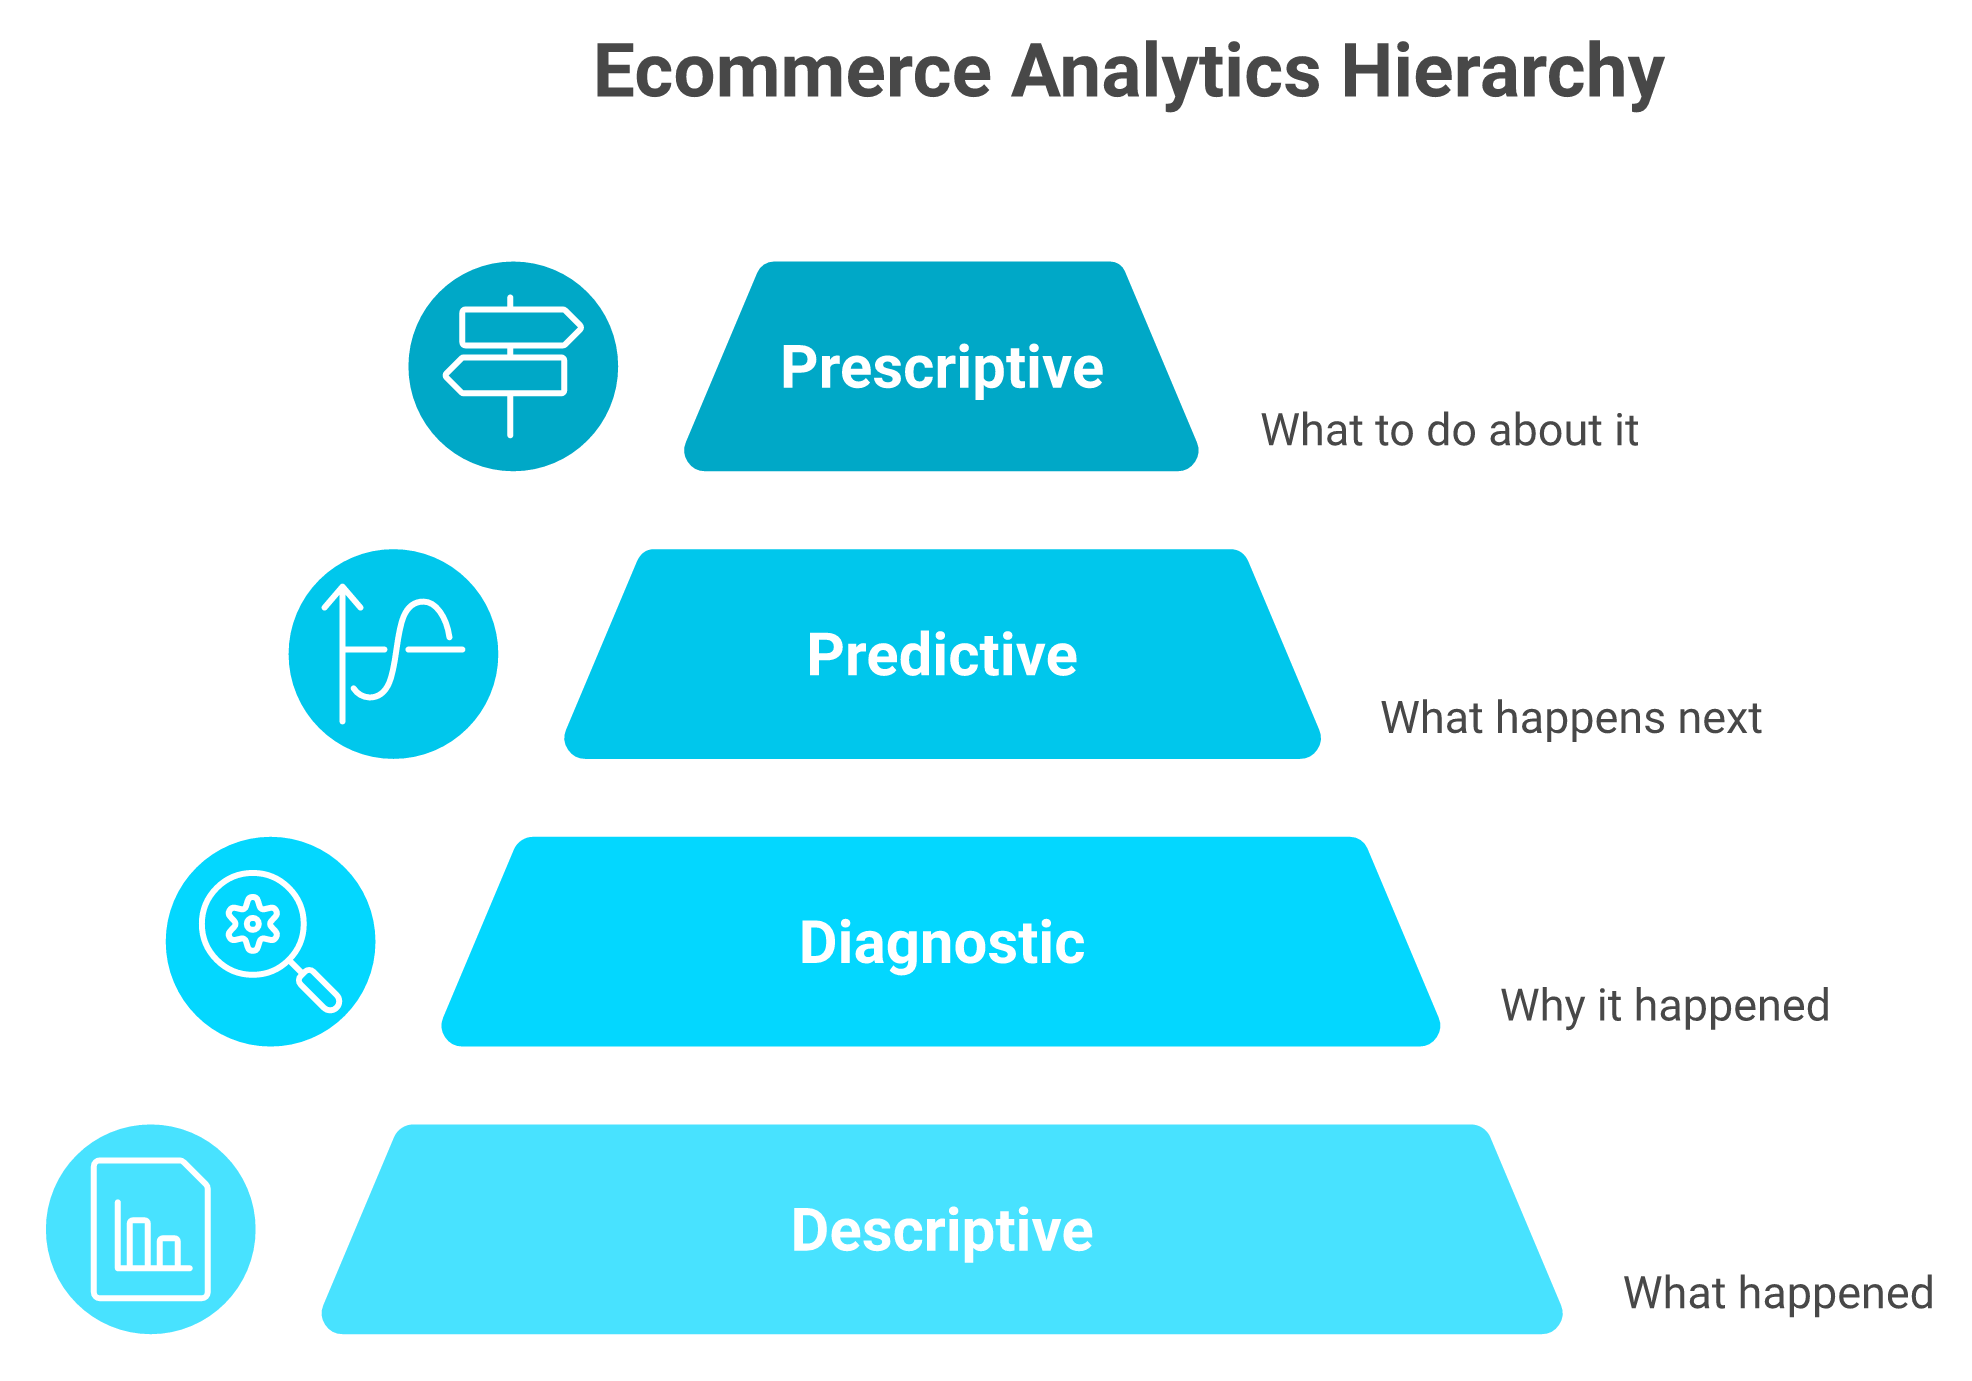
Ecommerce analytics is the practice of turning store, ad, email, and fulfillment data into decisions you act on this week. It moves through four layers: what happened, why it happened, what happens next, and what to do. Most operators never leave layer one. A Shopify survey of 500 store owners found 77% track revenue, while fewer than half track profit margin, traffic, average order value, or conversion rate.
🔍 Why most stores stall at layer one
The problem is not access. Your Shopify admin already holds sessions, orders, and returning customer rate. Meta already reports spend. Klaviyo already reports flow revenue.
The problem is that none of it reasons together. One operator described the feeling precisely: there are too many metrics, you do not know which are good or bad, and the screen just looks like a jumble of numbers. That gap between raw numbers and an actual answer is the core problem ecommerce data analytics has to solve.
🧭 The windshield and the gas gauge
Here is the frame I use with founders. Your strategy is the windshield. Your dashboard is the gas gauge.
The gauge tells you how much fuel is left and how fast you are going. It cannot tell you where to drive. Most store owners spend their Monday staring at the gauge and never look up through the glass. A well-built ecommerce analytics dashboard should shorten that stare, not extend it.
📊 The four layers, run against one real store
Ecommerce analytics climbs four layers. A report sits at the bottom; a decision sits at the top, and most stores never make the climb.
Take a $180K-per-month apparel brand on Shopify, running Meta and Google, with Klaviyo on email.
Descriptive (what happened): revenue fell 11% week over week.
Diagnostic (why): sessions held flat, but conversion rate dropped from 2.4% to 1.9%, concentrated on mobile.
Predictive (what next): at that conversion rate, the current inventory position overstocks by roughly six weeks.
Prescriptive (what to do): fix the mobile checkout step, hold the reorder, and pull spend from the campaign driving the worst-converting traffic.
Layer one is a report. Layer four is a decision. Everything between them is the work this guide covers, and it is the same ladder that separates reporting tools from decision intelligence tools.
✅ What a working loop actually produces
One decision per week. That is the honest output target, and it is lower than most blogs promise.
Not a prettier dashboard. Not 40 tracked metrics. One change you can name on Friday that you would not have made on Monday. If your analytics setup does not produce that, it is costing you time without paying you back.
Luca AI exists because the bottleneck is reasoning, not access. Luca AI is an AI-native data platform that sits over your unified store data, normalizes and standardizes schemas on ingestion, and pulls the relevant slice for the question in front of you. You skip the data cleanup year. The output is the reasoning and the next step, not another chart to interpret.
Q2. Metric or KPI: which numbers actually earn a place on your dashboard? [toc=2. Metrics vs KPIs]
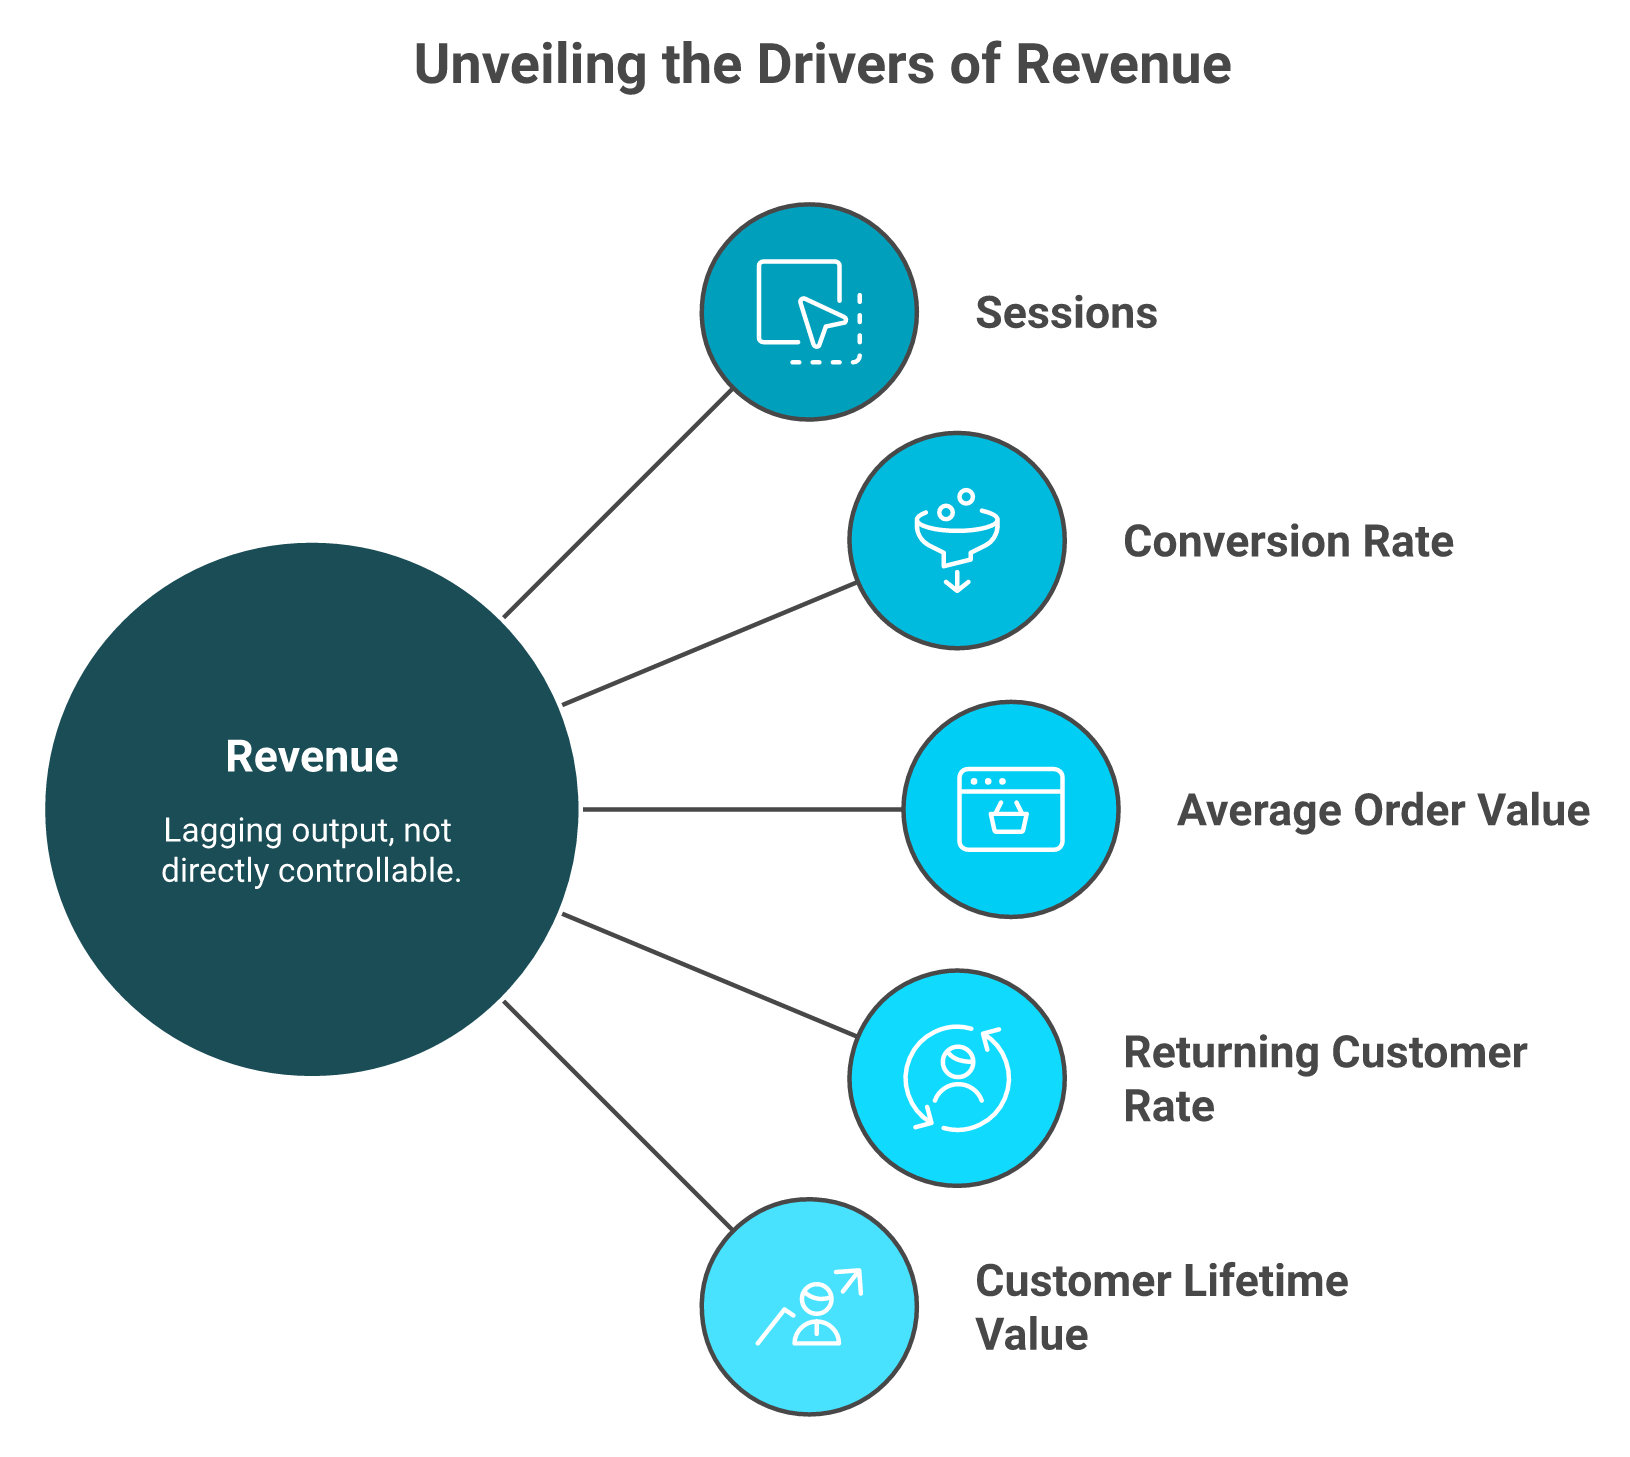
A metric is anything you can measure. A KPI is a metric you will act on. Apply one test: if it drops 10% and nobody does anything differently, it is a data point, not a KPI. Revenue is a lagging output you cannot touch directly. Start with five leading inputs: sessions, conversion rate, average order value, returning customer rate, and customer lifetime value.
⚠️ Revenue is an output, so stop managing it
You cannot increase revenue directly. These five inputs are the only levers that produce it.
You cannot increase revenue. You can only increase the inputs that produce it. That distinction sounds like semantics until you watch someone set a revenue target with no input plan attached.
Leading indicators move first, and you can pull them. Lagging indicators confirm what already happened. Sessions and conversion rate lead. Revenue and profit lag. If you want the longer list, our breakdown of ecommerce KPIs sorts them the same way.
📋 The five levers, with formulas
The Five Input Levers That Produce Revenue
Metric
Formula
Lever it controls
Cadence
Sessions
Total visits
Traffic and channel mix
Weekly
Conversion rate
Orders ÷ sessions
Product page and checkout
Weekly
Average order value
Net revenue ÷ orders
Bundling, pricing, upsell
Weekly
Returning customer rate
Repeat customers ÷ total customers
Retention and post-purchase
Monthly
Customer lifetime value
Purchase frequency × AOV × gross margin
Acquisition ceiling
Monthly
Calculate conversion rate using sessions, not unique identified users. That single mistake inflates the number and quietly breaks every downstream decision.
❌ The three metrics beginners over-track
Run the 10% test on each of these and watch them fail.
Bounce rate. It drops 10%. What do you change? Nothing specific.
Total followers. It drops 10%. No order is affected this quarter.
Platform-reported ROAS. It drops 10% while blended revenue holds. You have learned nothing about the business.
One operator I know rebuilt his dashboard around only those five levers. The rebuild surfaced a purchase frequency of 1.01, meaning almost nobody bought twice. He shifted the entire roadmap toward consumable add-ons and subscriptions. The number had been sitting in Shopify the whole time, just never isolated, which is exactly the pattern we see in Shopify LTV work.
💬 What operators say about default dashboards
Default analytics tools rarely surface the input levers without manual work.
"Almost all of the super popular, easy-to-use, out-of-the-box reports now have to be manually created. The rows aren't even clickable any more so the default views don't dive in to other views." — Verified User in Computer Software, Mid-Market, 2/5 stars, December 2022, Google Analytics - G2 Verified Review
"The interface and reporting structure are not very intuitive at first, and finding specific metrics or building custom reports can take time. Some standard reports that were easily accessible in Universal Analytics now require extra configuration." — Aman S., Performance Marketing Head, 2/5 stars, December 2025, Google Analytics - G2 Verified Review
The pattern is consistent. The data exists. Getting it into lever form is manual labor, which is why so many operators end up shopping for Google Analytics alternatives for ecommerce.
Luca AI makes the shortlist self-maintaining. Set thresholds on the five levers once, and Luca AI scans the data continuously, then pings Slack, email, or the app when one breaks its established pattern. We built it this way because the dashboard also has to work on the weeks nobody opens it.
Q3. Where does each number live, and can you trust it? [toc=3. Sources & Data Trust]
Shopify Analytics covers store-level truth: sales, AOV, conversion rate, and returning customer rate. Add GA4 when you need cross-channel traffic sources and funnel exploration that Shopify cannot see. Before trusting either, run four checks: one tag firing once, bot and internal traffic excluded, Shopify order count reconciled against GA4, and inventory cost verified against bank statements rather than your inventory app.
🗺️ Shopify or GA4, decided simply
Under roughly 100 orders a month, Shopify Analytics alone is enough. It owns the order record, so its revenue and AOV are the closest thing you have to truth. Our walkthrough of the Shopify analytics dashboard covers what each native report actually measures.
GA4 earns its place when you need to know which channel sent the session and where in the funnel people left. It does not own your orders, so treat its revenue figure as an estimate. If you have not wired it up yet, start by adding Google Analytics to Shopify correctly.
✅ The four-check audit, and what each one catches
Run this once before you read another number. It takes about 15 minutes.
Tag duplication. Open your site, inspect network calls, confirm GA4 fires once per pageview. A duplicated tag halves your reported conversion rate.
Bot and internal traffic. Exclude your own IP and known bot traffic. Unfiltered bots inflate sessions and crush conversion rate.
Order reconciliation. Compare last month's Shopify order count to GA4 purchases. A gap over 5% means tracking is broken, not that demand shifted. Our notes on ecommerce conversion tracking cover the common causes.
Cost verification. Pull landed cost from reconciled financials, not your inventory tool. The average retailer runs roughly 6% inventory accuracy, and the IHL Group puts industry losses from this revenue distortion above $1 trillion.
On check four, a warning worth repeating: most inventory management systems are open systems that never reconcile back to bank and credit card statements. If the cost input is wrong, every margin number built on it is wrong too, which is where disciplined ecommerce inventory management earns its keep.
💸 Why reviewers keep flagging the same gaps
This is not theory. Verified buyers describe it in detail.
"It has pretty substantial limitations for ecommerce tracking and often isn't close to accurate for conversion rate, number of orders, or revenue." — Verified User in Information Technology and Services, Mid-Market, 1.5/5 stars, May 2019, Google Analytics - G2 Verified Review
"It is becoming very opaque, it doesn't have real-time, the sampling is increasingly wild, and now it applies a threshold. If you don't pay for BigQuery, you're really tied hand and foot." — Verified User in Retail, Mid-Market, 1.5/5 stars, February 2024, Google Analytics - G2 Verified Review
"We are a startup company and mainly use Supermetrics for Shopify API. Data is inaccurate when it comes to Daily Total Sales and Returning Orders figures." — Verified User, Startup, 2.5/5 stars, October 2022, Supermetrics - G2 Verified Review
Even purpose-built ecommerce tools carry the same seam. A four-star Triple Whale reviewer noted discrepancies between platforms on attributed revenue, where the tool credited email and the sending platform credited SMS.
"Some data we still notice discrepancies between platforms, for example, tracking ads, and differences in the reported metrics like revenue. Or with our emails/sms platforms about what revenue is attributed to which channel." — Verified User, 4/5 stars, April 2023, Triple Whale - G2 Verified Review
Luca AI removes the reconciliation argument from your Monday. Luca AI connects Shopify, Meta, Google, Klaviyo, accounting tools, 3PL, and support into one normalized source of truth, standardizing schemas on ingestion. The definitions get settled once, at setup, instead of every week in a spreadsheet, which is the whole point of real ecommerce data integration.
Q4. Why is your 72% gross margin bestseller probably losing money? [toc=4. Contribution Margin Truth]
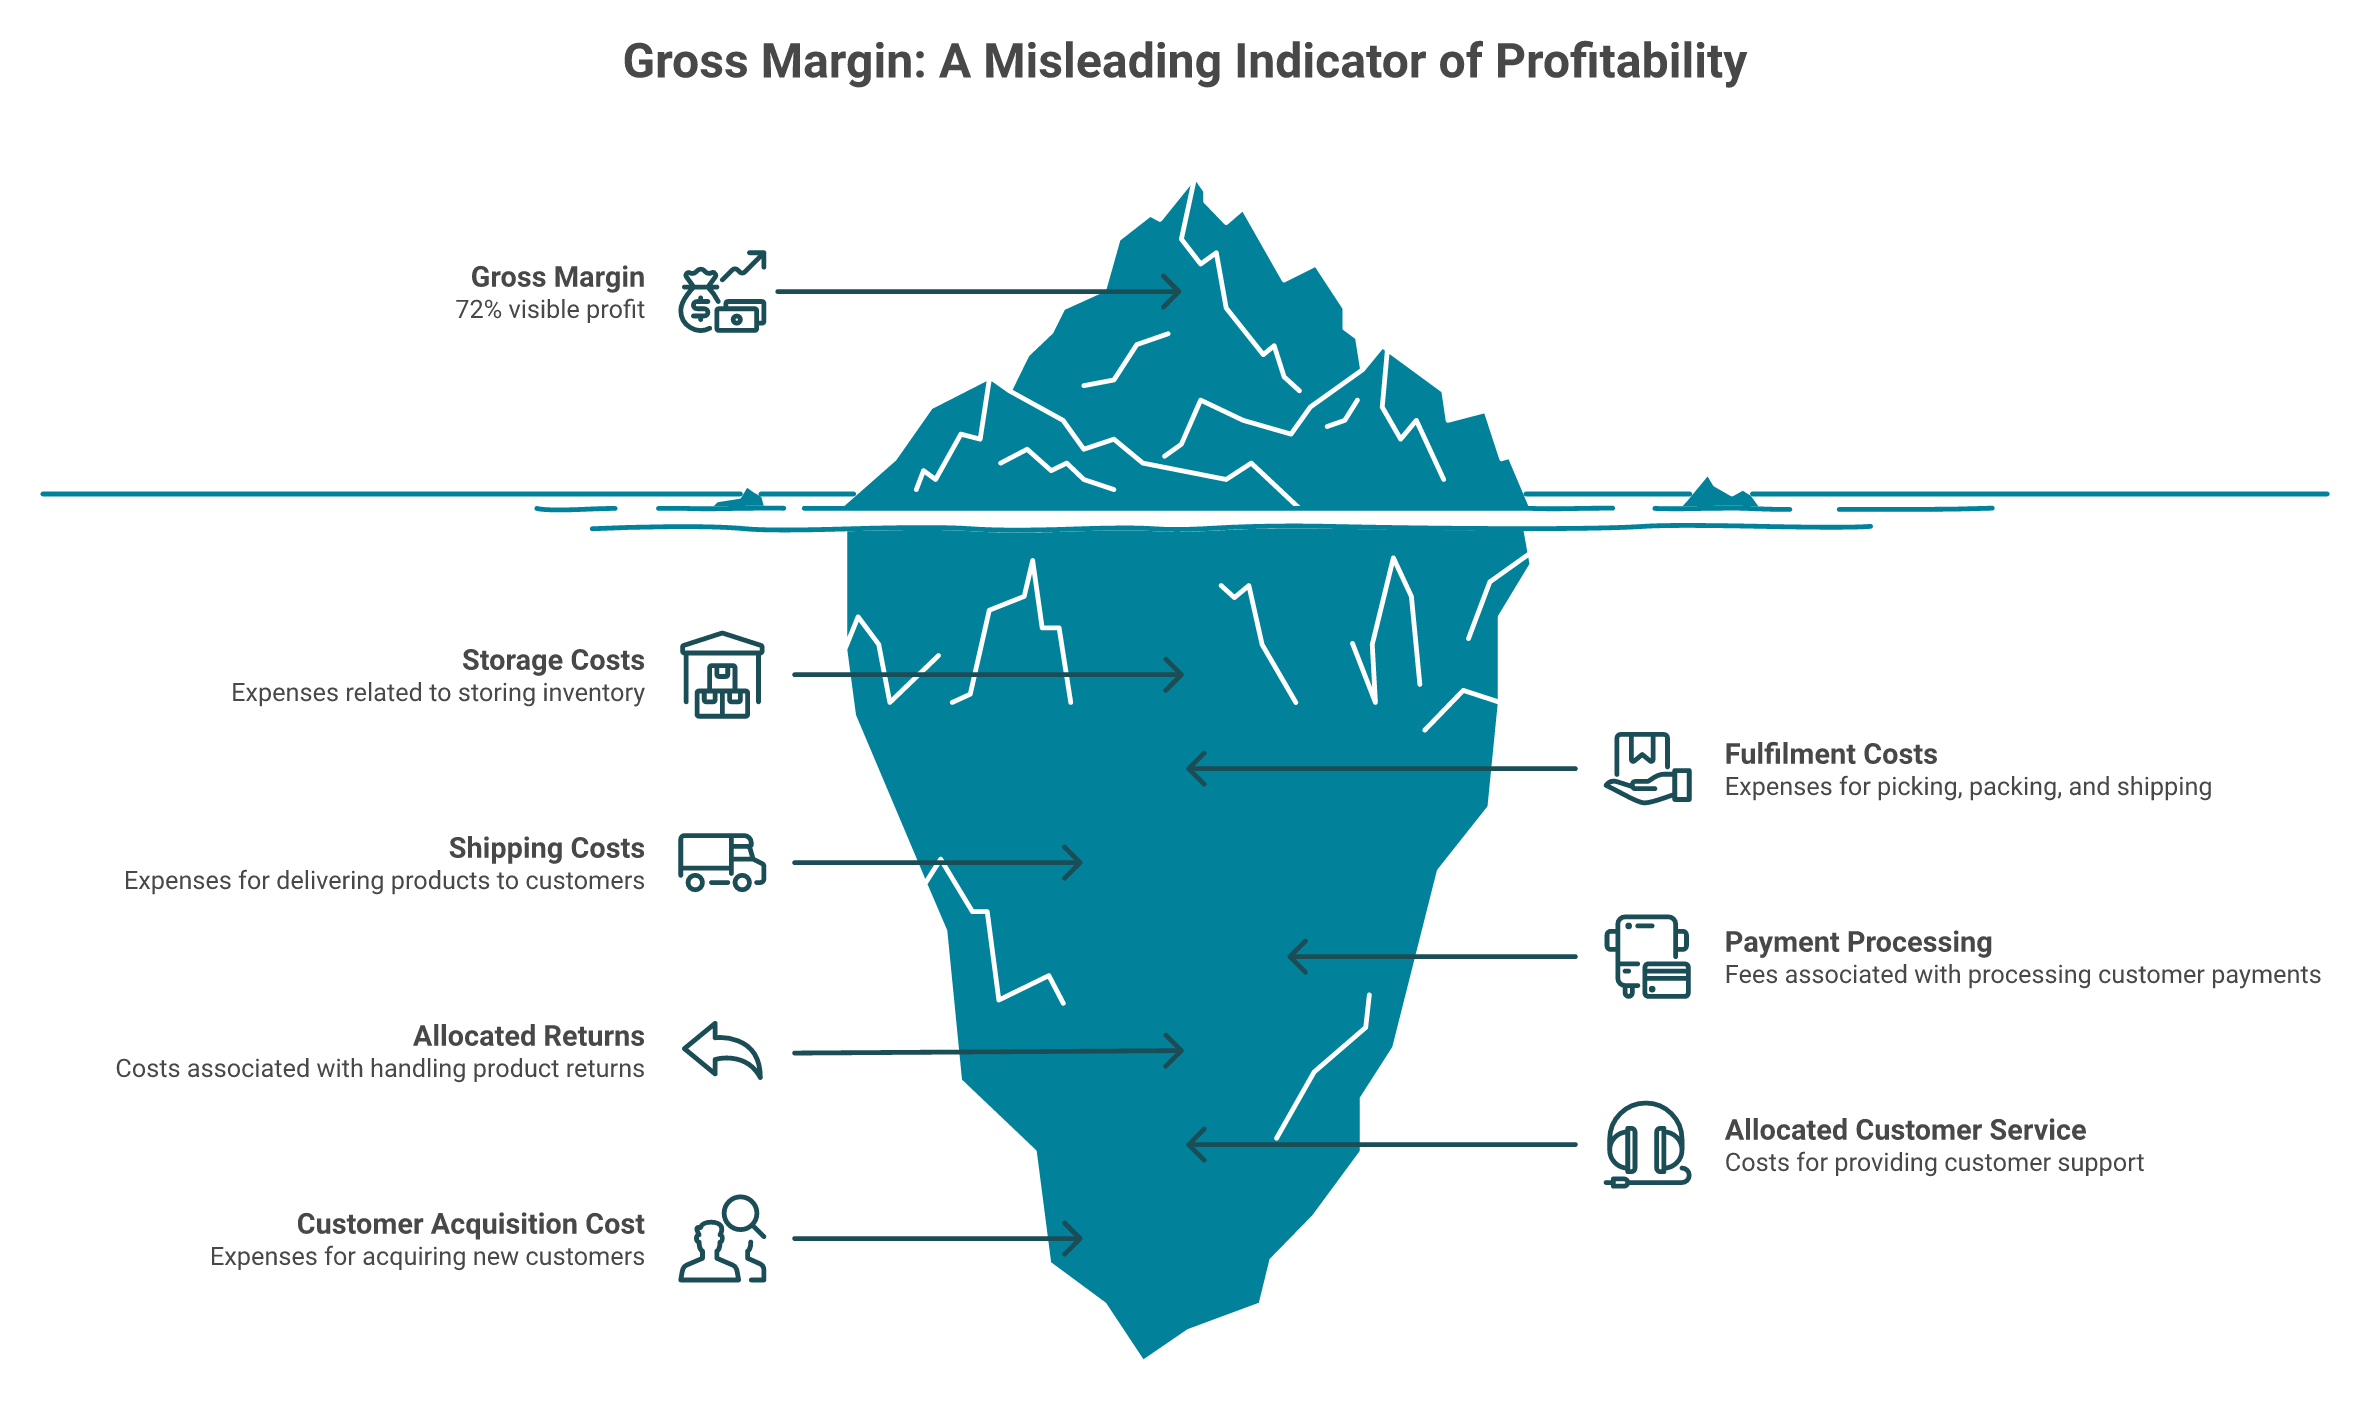
Because gross margin counts what it costs to make the thing, not what it costs to sell it. Eight variable costs sit in between: landed cost, storage, pick-pack, shipping, payment processing, allocated returns, allocated customer service, and customer acquisition cost. One $49.99 knife set carrying 72% gross margin had $71.30 in true unit cost, a $21.31 loss per order. Level CFO's 2026 benchmark puts true DTC contribution margin at 15% to 20% at the median.
📉 The invoice on the table
I watched this happen in a real review. A founder running a $2.3M kitchenware brand slid an invoice across the table and said her ceramic knife set was the hero: 72% gross margin, could not make them fast enough.
Twenty minutes later she was in tears. Not because anyone was harsh. Because the data had been sitting in her own systems the entire time, and nobody had ever added it up line by line. The distinction between contribution margin and gross margin is the single most expensive thing most beginners skip.
Gross margin is the tip. The seven costs below the waterline are what turn a hero SKU into a loss per order.
🧾 The teardown, cost by cost
True Unit Economics of a $49.99 Ceramic Knife Set
Line item
Per unit
Revenue
$49.99
Landed cost
$17.75
Storage
$0.65
Pick, pack, fulfill
$4.10
Shipping
$8.40
Payment processing
$1.75
Returns (allocated)
$6.20
Customer service (allocated)
$1.45
Customer acquisition cost
$31.00
Total cost
$71.30
That customer service figure came from one query: 42% of all support tickets traced to this single product, which allocated out to $1.45 per unit. Gross margin never sees that number.
✅ The worksheet, in order
Start with net price collected, not list price.
Strip shipping, handling, and discounts out of AOV before using it anywhere. Blended AOV flatters you.
Allocate returns by SKU, never catalog-wide. Return rates vary 3x between products.
Allocate support by ticket volume per SKU, the way the knife set earned its $1.45.
Include CAC. Some accountants argue it is marketing overhead, not product cost. My position is firm: if you must spend money to acquire a customer to sell a unit, it is a variable cost of that sale.
Recalculate monthly. Shipping rates, CPMs, and return rates all drift.
Run this on your top five SKUs before you touch anything else. It is the fastest route to honest e-commerce unit economics, and it usually changes at least one pricing decision.
⭐ What happened next
She raised the price to $59.99. She added an instructional usage video, which cut the return rate from 18% to 9%. She shifted hero ad spend to a cutting board set with better unit economics, and repackaged the fulfillment box to save $0.80.
Six months later, the same SKU ran at 23% contribution margin. For context, Common Thread Collective measured 29.3% median contribution margin across 299 DTC brands in Q1 2026. That is the level at which ecommerce profit margins start funding growth instead of consuming it.
Luca AI runs this teardown as a question instead of a project. Ask Luca AI for contribution margin by SKU and it joins support volume, returns, fulfillment, and ad cost to each product, identifies which cost component is driving the result, and flags SKUs whose margin moved since last month. We outline the steps. You make the call.
Q5. Where exactly is your funnel leaking? [toc=5. Funnel Leak Diagnosis]
Split conversion rate into two numbers. Add-to-cart rate judges your product page: images, price clarity, reviews, shipping promise. Cart-to-purchase rate judges checkout: payment options, shipping cost reveal, forced account creation. Median cart-to-purchase sits at 24.12% and median abandonment at 70.22%. So a store converting at 1.5% with a healthy 8% add-to-cart has a checkout problem, not a traffic problem.
📉 One number hides two very different problems
Most founders track a single conversion rate. Then they buy more traffic, because that is the only lever a single number suggests.
The number is an average of two independent events. People deciding to want the thing. People deciding to pay for the thing. Those failures have opposite fixes, which is why proper ecommerce website analytics separates them before anyone touches the site.
✅ The two formulas, and nothing more
Use these exactly as written. Both pull from Shopify's own order and cart data.
Add-to-cart rate = add-to-cart sessions ÷ total sessions
Cart-to-purchase rate = orders ÷ carts created
Calculate conversion rate using sessions, not unique identified users. One verified reviewer put the underlying problem with session metrics bluntly:
"'Sessions' are a vague statistic that do not help define the quality/quantity of your web traffic. Far too often, people rely on the free version as a main hub for their website traffic reporting, it's a mistake." — Verified User in Marketing and Advertising, Mid-Market, 0.5/5 stars, August 2018, Google Analytics - G2 Verified Review
🧭 Four scenarios, four different Mondays
Funnel Diagnosis Matrix: What Each Rate Combination Means
Add-to-cart rate
Cart-to-purchase
What is actually broken
The fix
Low (under 5%)
Healthy (above 24%)
Product page or traffic quality
Rewrite offer, add proof, fix price clarity
Healthy (7% plus)
Low (under 18%)
Checkout friction
Add payment options, show shipping earlier
Low
Low
Wrong audience entirely
Audit targeting before touching the site
Healthy
Healthy
Nothing. Volume is your constraint
Scale traffic, protect the funnel
That bottom-left row is the expensive one. I have watched operators spend six weeks on checkout tests when the real issue was a cold audience that never wanted the product.
⚠️ The leaky bucket problem
Here is the version of this I see most often. A plain Shopify product page with one image, a short description, and a few reviews.
That is not a funnel. That is a leaky bucket. Nothing on the page answers the three questions a cold buyer actually has: why this, why now, and what happens if it is wrong. Mapping that gap is the job of ecommerce customer journey analytics.
💸 Where the money hides
Run the math before you pick a project. At 10,000 sessions and a $74 average order value, moving cart-to-purchase from 18% to 24% is worth roughly $3,500 a month. No new traffic required.
Moving add-to-cart from 5% to 7% at the same cart-to-purchase rate is worth about $2,600. Both beat buying more clicks at current cost per thousand impressions.
⭐ The step most people skip
Segment before you act. Mobile and desktop almost never leak in the same place.
Desktop usually leaks at add-to-cart, because the page has room to fail at persuasion. Mobile usually leaks at checkout, because payment and shipping reveal happen on a four-inch screen. Fixing the wrong one burns a sprint.
Luca AI narrows the leak before you commit the sprint. Ask Luca AI why conversion fell last week and it segments the funnel by device, channel, and landing page, identifies the stage where the drop concentrated, and names the stages already performing well. We outline the diagnosis. You choose what to fix.
Q6. How do you measure what a customer costs and what a customer is worth? [toc=6. CAC & Lifetime Value]
Customer lifetime value is purchase frequency times average order value times gross margin, where purchase frequency equals total orders divided by total customers. Customer acquisition cost is channel-specific spend divided by new customers from that channel. Never use a blended figure. Blended DTC CAC has risen 40% to 60% since 2023, and blended numbers near $68 to $84 hide retail CAC closer to $226, according to Taylor Sicard's DTC Channel Benchmarks 2026. Median LTV to CAC runs 2.8x, with 3:1 as the working target, per Level CFO's 2026 benchmark.
🧮 The manual version, in Shopify, in ten minutes
You do not need a tool for the first pass. Pull two numbers from your Shopify customer report for a 12-month window.
Divide total orders by total customers. That is purchase frequency. A result near 1.0 means almost nobody buys twice.
Multiply purchase frequency by average order value.
Multiply that by gross margin as a decimal. Skipping this step is how people end up with a CLV that looks three times too good.
Strip shipping, handling, and discounts out of average order value first. Leaving them in inflates every downstream number. Our fuller treatment of ecommerce customer lifetime value walks through the cohort version of this same math.
⏰ Use the median, not the mean
When you measure time between purchases, use the median. One customer who reordered after 400 days will drag the mean badly, and the median ignores them.
This matters because the repurchase window sets your email timing. Get it wrong, and your winback flow fires three weeks late. That timing sits at the heart of most customer retention strategies for ecommerce.
⚠️ Why blended CAC quietly ruins decisions
There is no single CAC. It is a property of the channel, not the business.
How Customer Acquisition Cost Behaves by Channel
Channel
Typical cost behavior
What it tells you
Meta prospecting
Highest CAC, true new customers
Real acquisition cost
Google brand search
Very low reported CAC
Mostly demand you already created
Email and SMS
Near zero marginal cost
Retention, not acquisition
Blended average
Sits between all of them
Almost nothing actionable
The trap is obvious once stated. A blended CAC of $75 can hide one channel at $40 and another at $180. You scale the wrong one because the average said you were fine. Channel-level visibility is exactly what cross-channel analytics tools exist to provide.
💰 The structural trap at low AOV
If your average order value sits near $30, paid acquisition will likely never work at scale.
Run it. At £220 in ad cost for 100 visitors and $15 profit per order, you need 15 sales to break even. That is a 15% conversion rate, which is close to impossible. Pushing AOV toward $80 or $100 is the fix, because that range covers ad cost, cost of goods, fees, chargebacks, and refunds.
✅ The decision gate
Here is the gate I use, and I will hedge it honestly: 3:1 is a guideline, not physics.
Below 2:1, stop scaling spend and fix margin or retention.
Between 2:1 and 3:1, hold spend flat and work on repeat purchase rate.
Above 3:1, you have room to increase acquisition spend.
Pair it with CAC payback period, meaning how many months until the customer repays what you spent to get them. Under 12 months is workable for most self-funded brands. Past 18 months, you are financing growth out of working capital whether you meant to or not, which is why payback belongs inside your cash flow forecast.
Luca AI computes CLV by cohort and CAC by channel against live store data, then simulates forward. Ask Luca AI what happens to payback if Meta costs per thousand impressions climb 15% next quarter, and it models the answer against your own history rather than a stranger's benchmark.
Q7. Why does ROAS mislead you, and what should replace it? [toc=7. ROAS vs MER]
Platform return on ad spend is reported by the company selling you the ads, and it ignores returns, fulfillment, fees, and lead time. Use marketing efficiency ratio instead, meaning total revenue divided by total ad spend across all channels. Median MER sits at 4.23x. Across 299 DTC brands, Google brand search reported 19.07x ROAS against 5.72x incremental, an incrementality factor of 0.30, while Meta acquisition was understated at 1.13x, per the Common Thread Collective Q1 2026 Channel Mix Benchmark.
❌ What almost everyone believes
The standard playbook says pick a target ROAS, then scale anything above it and cut anything below. I ran that playbook for years. It works until it quietly stops.
The flaw is structural, not tactical. Meta and Google both measure their own homework, and each claims credit for the same order. We unpacked that gap at length in declining platform ROAS versus true profitability.
🔁 Now the part that surprised me
I assumed every platform overstates. That is only half true, and the half I had wrong cost real money.
Common Thread Collective measured reported ROAS against incremental ROAS, meaning revenue that genuinely would not have happened without the ad. Google brand search collapsed from 19.07x to 5.72x. Meta acquisition went the other way and was understated at 1.13x.
So the operators cutting Meta prospecting to fund brand search were defunding the channel actually creating demand. They were not being lazy. They were trusting the dashboard. Sharper AI marketing analytics would have caught the inversion.
✅ What to track on Monday instead
Marketing efficiency ratio is total revenue divided by total ad spend. No attribution model, no pixel, no argument.
Unlike ROAS, it accounts for long lead times and repeat purchases, which matters more every year as tracking degrades. One operator I trust puts it sharply: click-through rate and ROAS are meaningless on their own, and marketing has to marry finance and forecasting.
⚠️ The honest limit of MER
MER tells you whether the whole machine is efficient. It tells you nothing about which channel to cut.
That is the trade-off, and I will not pretend otherwise. Use MER as the business-level gate, then use channel-level tests, such as geo holdouts or spend ramps, to answer allocation. Even purpose-built tools carry seams here:
"Some data we still notice discrepancies between platforms, for example, tracking ads, and differences in the reported metrics like revenue. Or with our emails/sms platforms about what revenue is attributed to which channel." — Verified User, 4/5 stars, April 2023, Triple Whale - G2 Verified Review
💸 A weekly MER habit that takes four minutes
Pull total revenue for the week from Shopify.
Pull total ad spend across every paid channel.
Divide. Log it in the same sheet every week.
Watch the trend line, not the single reading.
Four weeks of MER history beats one week of perfect attribution. The trend tells you whether spend changes are working. A single number tells you nothing.
Luca AI reports MER with the reasoning attached and delivers it on a schedule. Set a standing weekly task, and Luca AI sends the ratio, the components that moved it, and a recommended direction to Slack or email through its automated ecommerce reporting. Worth stating plainly: Luca AI is not an attribution pixel and does not replace one.
Q8. What does good look like in 2026? [toc=8. Current Benchmarks]
Median ecommerce conversion rate is 2.01%, median average order value is $74.12, and median cart abandonment is 70.22% across a panel of 33,000-plus brands, per Triple Whale's Ecommerce Benchmarks 2026. Median cart-to-purchase is 24.12% across 4,000-plus Shopify stores, per Polar Analytics. Segment before judging. Desktop converts roughly twice mobile, email runs 4% to 5% against paid social under 1.2%, and Food and Beverage sits far above Consumer Electronics. Your own trailing trend beats any industry median.
📊 The numbers, with their panels attached
A benchmark without a sample size is a rumor. Here is what each figure actually rests on.
2026 Ecommerce Benchmarks With Source Panels
Metric
Formula
2026 median
Source and panel
Cadence
Conversion rate
Orders ÷ sessions
2.01%
Triple Whale, 33,000+ brands, $18.4B spend
Weekly
Average order value
Net revenue ÷ orders
$74.12
Triple Whale, 33,000+ brands
Weekly
Cart abandonment
1 − (orders ÷ carts)
70.22%
Triple Whale, 33,000+ brands
Weekly
Cart-to-purchase
Orders ÷ carts
24.12%
Polar Analytics, 4,000+ Shopify brands
Weekly
Contribution margin
CM ÷ revenue
29.3%
Common Thread Collective, 299 DTC brands
Monthly
LTV to CAC
LTV ÷ CAC
2.8x
Level CFO, DTC and multi-channel brands
Monthly
🧭 Segment before you judge yourself
A 1.6% conversion rate means nothing on its own. Split it three ways first.
By device. Desktop typically converts near double mobile. A mobile-heavy store will always look worse on a blended number.
By channel. Email converts 4% to 5%. Paid social often runs under 1.2%. Changing channel mix moves your blended rate without anything improving or breaking.
By category. Food and Beverage runs far above Consumer Electronics, mostly because of price point and repeat behavior.
Different panels measure different populations. Triple Whale skews toward ad-spending DTC brands. Polar refreshes weekly across Shopify stores. Neither is wrong. They are counting different stores.
Pick one panel, note its sample size, and stay with it. Switching sources mid-year is how people convince themselves a flat quarter was a win. If you are weighing these vendors directly, our rundown of Polar Analytics alternatives covers what each panel actually measures.
💬 One more reason to distrust an isolated reading
Measurement error is larger than most operators assume. A verified reviewer described exactly how far off sampled data can drift:
"When we switched to an enterprise web analytics solution that does no sampling, we found that Google Analytics was telling us we had twice as much traffic as we actually do. The sampling also means that you will not receive the same answer twice." — Gitai B., Marketing, Web Analytics, and Testing Lead, 1/5 stars, November 2016, Google Analytics - G2 Verified Review
If sessions are inflated, your conversion rate is deflated, and your benchmark comparison is meaningless.
✅ The comparison that actually drives decisions
Compare yourself to yourself. Same month last year, then last 13 weeks as a rolling line.
My read, and I hold this loosely: industry medians are useful once, when you are deciding whether a metric is worth attention at all. After that, your own baseline carries every real decision, which is the premise behind continuous ecommerce performance analytics.
Luca AI benchmarks you against your own history. Luca AI studies performance across months and years, then flags deviation from your established pattern, so a 1.6% conversion rate reads as a seasonal norm or a genuine problem depending on your data.
Q9. What should your weekly and monthly analytics rhythm look like? [toc=9. Dashboard & Cadence]
Build three layers, not one dashboard. Daily covers spend pacing, conversion rate, stock-outs, and anomalies only. Weekly covers the five input levers plus marketing efficiency ratio and cart-to-purchase. Monthly covers cohorts, contribution margin by SKU, and LTV to CAC. The rule that makes it stick is a threshold and an action written down per metric before the number moves, with one named owner.
⏰ Three layers, three different jobs
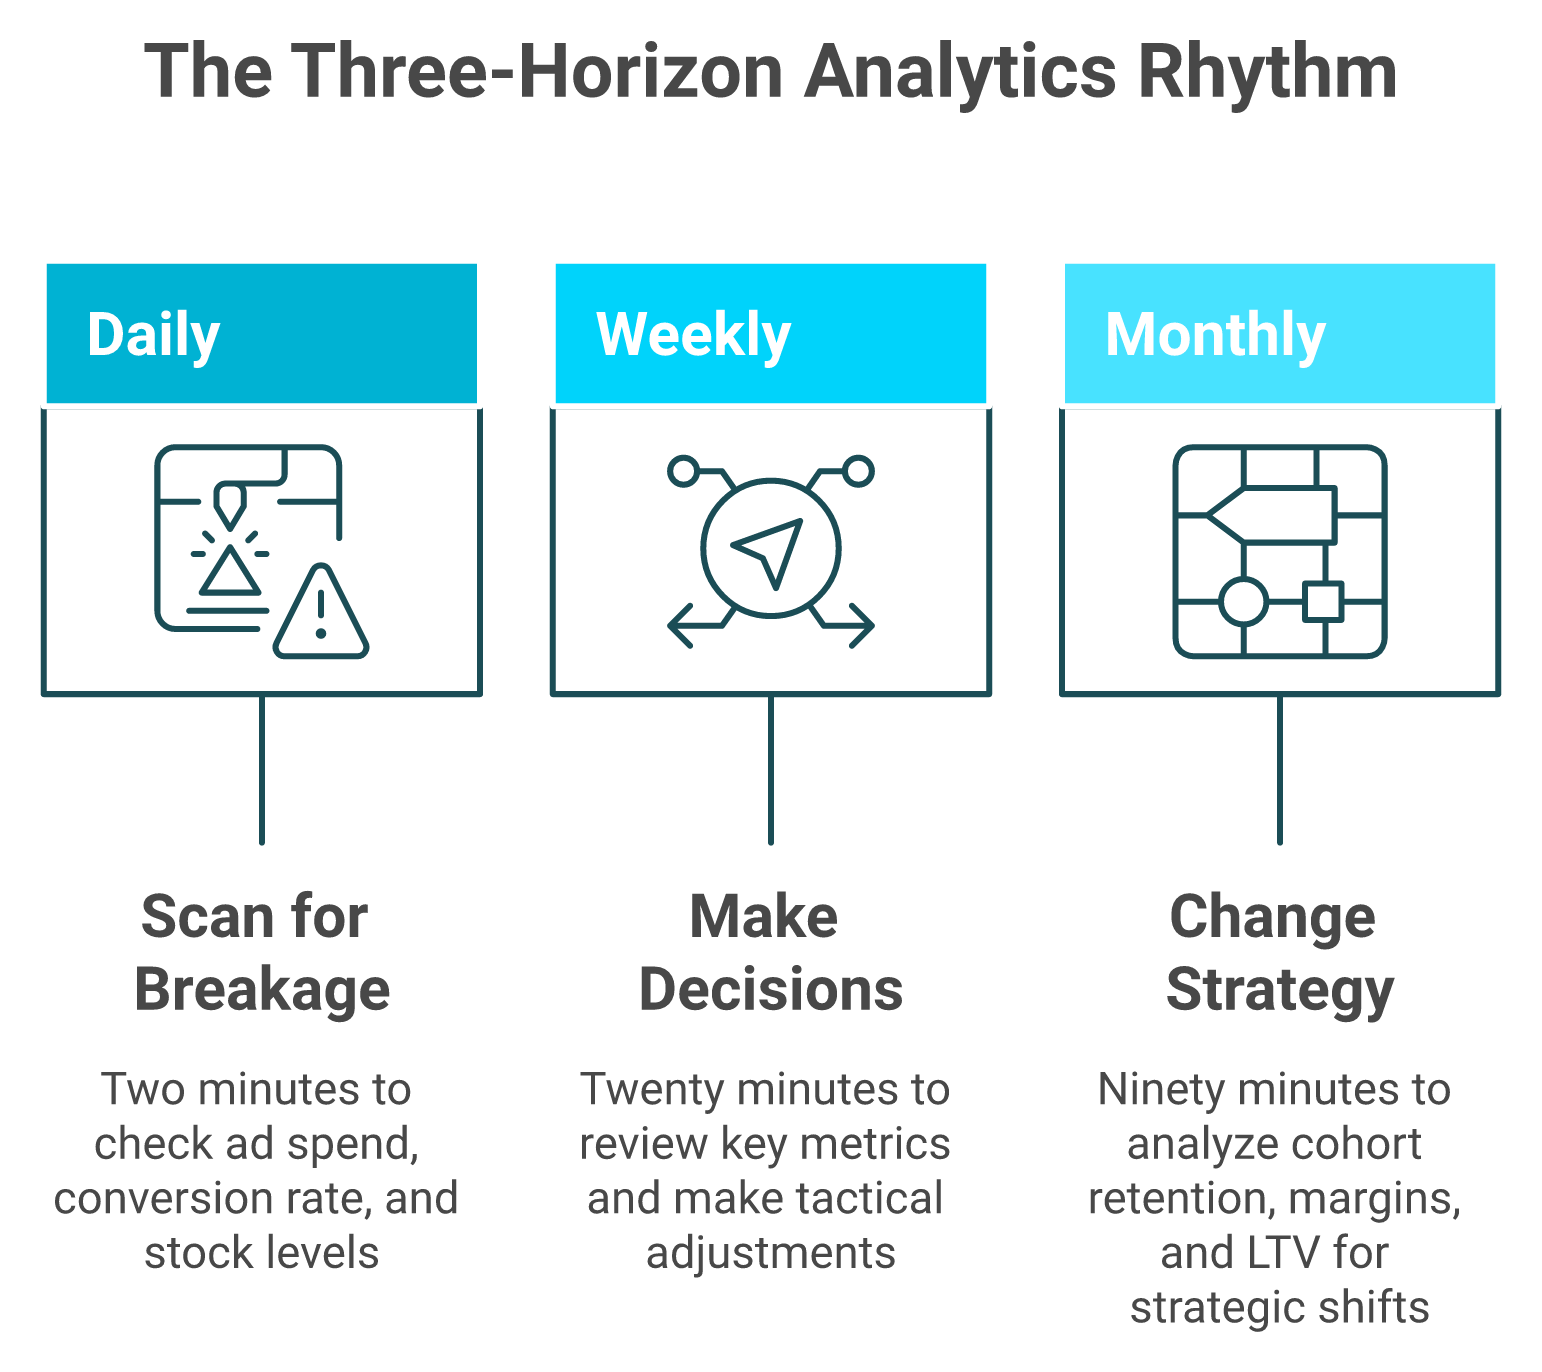
Split the routine into three horizons. Daily catches breakage, weekly drives decisions, monthly changes strategy.
One dashboard tries to serve three time horizons and fails at all of them. Split it.
Daily (two minutes): ad spend pacing, yesterday's conversion rate, any SKU at zero stock. You are scanning for breakage, nothing else.
Weekly (twenty minutes): sessions, conversion rate, average order value, returning customer rate, MER, and cart-to-purchase. This is where decisions get made.
Monthly (ninety minutes): cohort retention, contribution margin by SKU, LTV to CAC, and return rates. This is where strategy changes.
Structuring ecommerce reporting around those three horizons is what keeps the daily scan from swallowing the monthly review.
✅ The decision rules, written before the number moves
Writing the action in advance is the entire trick. Otherwise, you debate the number instead of acting on it.
Metric Thresholds, Actions, and Owners by Cadence
Metric
Threshold
Action
Owner
Cadence
Daily spend pacing
Over 15% above plan
Pause the newest campaign
Growth
Daily
Conversion rate
Down 0.3 points for 3 days
Run the funnel split from Q5
Growth
Daily
Inventory cover
Under 4 weeks
Trigger reorder review
Ops
Weekly
MER
Below target for 2 weeks
Cut lowest-incrementality channel
Growth
Weekly
Contribution margin by SKU
Below 15%
Reprice, repackage, or retire
Founder
Monthly
LTV to CAC
Below 2:1
Freeze acquisition spend
Founder, Finance
Monthly
Shopify's own KPI guidance lands in the same place on cadence, which is a decent sanity check if you want a second source.
💸 The Monday export trap
Here is the version that breaks. One operator who scaled past £200M in gross merchandise value described the early years as almost entirely Excel based, with Monday mornings spent on exports from Shopify and exports from the returns system, stitched together by hand. He said it makes him shudder now.
That workflow does not break because it is unsophisticated. It breaks because it consumes the person who should be making decisions. Replacing it starts with honest ecommerce data management, not another spreadsheet tab.
⚠️ What reviewers say about automated reporting
Automated pipelines help, but they are not maintenance-free. Verified buyers are clear about this.
"Supermetrics offers functionality such as error handling and email alerts, however I have yet to see either of these features work. Much of my time spent within Supermetrics is spent manually finding and fixing errors from expired auth tokens or date formats changing randomly. This can absolutely get you what you need for your data, but know it is not a 'set it and forget it' platform." — Verified User, 2.5/5 stars, October 2019, Supermetrics - G2 Verified Review
"I highly recommend making sure your web partner is experienced in analytics and can help you set up a dashboard of some kind. There is a wealth of information in Google Analytics but it can be difficult for the average user to find it and extract it correctly." — Verified User in Marketing and Advertising, Mid-Market, 2/5 stars, January 2018, Google Analytics - G2 Verified Review
I think of an ecommerce business as two train tracks. One is inventory. One is cash. They have to run parallel, or you come off the rails.
That is why reorder timing belongs in the weekly layer, not the monthly one. A reorder decision made three weeks late is a cash decision, whether you logged it that way or not. Pairing reorder review with an ecommerce cash flow forecasting tool keeps both tracks visible at once.
Luca AI absorbs the cadence instead of adding to it. Give Luca AI standing tasks, such as a weekly CAC report with graphs and reasoning or a vendor performance review before each buying cycle, and it runs them on schedule. Luca AI also forecasts operational pressure like support ticket spikes and seasonal staffing. We do the analysis. You make the call.
Q10. Which analytics stack do you actually need at your stage? [toc=10. Stack By Stage]
Under roughly 100 orders a month, Shopify Analytics plus GA4 is enough. Past that, the real question is whether you need better visualization or actual reasoning. Luca AI sits at the reasoning end: an AI operating system over unified store data that answers plain-English questions, runs root-cause and cohort analysis, and pushes periodic reports to Slack or email. Dashboard tools visualize well and still leave interpretation to you.
🧭 Three stages, three upgrade triggers
Stage is about data volume and decision frequency, not revenue vanity.
Native only. Under about 100 orders a month. Shopify Analytics owns your order truth. Add GA4 for traffic source. Spending money here is premature.
Visualization layer. Roughly 100 to 1,000 orders a month, multiple paid channels. You now need numbers in one place, because manual triangulation eats your week.
Reasoning layer. Past that, the constraint flips. You have the charts. What you lack is someone to tell you which of three moves is better.
Our overview of ecommerce analytics platforms maps the same three stages against what each category was built to do.
📊 What each layer actually does
Capability Comparison Across Four Analytics Layers
Capability
Shopify + GA4
Dashboard tools
Classic BI
Luca AI
Unifies all sources
No
Partly
Yes, with setup
Yes
Normalizes on ingestion
No
Partly
No, you build it
Yes
Plain-English questions
No
Limited
No, SQL required
Yes
Root-cause analysis
No
No
Manual
Yes
Prediction and simulation
No
Limited
Manual
Yes
Proactive anomaly alerts
No
Some
Configurable
Yes
Scheduled reports with reasoning
No
Charts only
Charts only
Yes
Marketing attribution pixel
No
Yes, some
No
No
That last row matters. Luca AI is not an attribution pixel and does not replace one. If pixel-level attribution is your actual problem, buy an attribution tool.
1. Luca AI [toc=10.1 Luca AI]
Best when you have data piling up and nobody to interpret it. Luca AI normalizes and standardizes schemas on ingestion, so you skip the data-cleanup year. Our read: it functions as an AI data analyst for ecommerce that works nights.
2. Dashboard and attribution tools [toc=10.2 Dashboard Tools]
Strongest for paid-media operators who want channel views fast. If you are comparing the named players in this tier, start with Triple Whale alternatives.
3. Pipeline and ETL connectors [toc=10.3 ETL Connectors]
Good if you already have a warehouse and someone to query it. Smaller teams usually land on the best ETL tools for small business rather than enterprise pipelines.
4. Classic BI platforms [toc=10.4 Classic BI]
Powerful, but they assume a data team exists. Without one, most stores get more out of Shopify business intelligence built for the platform.
5. Native Shopify plus GA4 [toc=10.5 Native Tools]
Still the correct answer early, and free. Our Shopify analytics guide covers how far the native reports actually take you.
💬 What buyers actually report
Balanced view, straight from verified reviews.
"Its very easy to use and works good for a multichannel solution." — Verified User, 4/5 stars, April 2023, Triple Whale - G2 Verified Review
"They're very slow to update their existing connectors. As a result, they're missing lots of features and updates within their connectors, meaning there are regularly fields, metrics, breakdowns and quality-of-life improvements that are totally absent from their integrations." — Verified User, 1.5/5 stars, April 2024, Supermetrics - G2 Verified Review
"Sometimes we found with platforms like google analytics, it can be over complicated to get a relatively straightforward piece of data." — Verified User, 4/5 stars, April 2023, Triple Whale - G2 Verified Review
❌ Who each option is wrong for
Honest non-fits, including ours.
Native tools fail once you run three or more paid channels.
Dashboard tools leave you holding the interpretation, which is the actual work.
Classic BI is wrong without a data analyst on payroll.
Luca AI is wrong for enterprises that already run a data team, for stores too early to have data worth reasoning against, and for marketplace-only sellers with no store data to unify.
Luca AI leads this list because it reasons rather than displays. Luca AI connects your sources, standardizes them on ingestion, then answers questions in plain English and surfaces insights without being asked. The output is the reasoning and the next step. You decide and execute.
Q11. Which beginner analytics mistakes cost the most money? [toc=11. Costly Beginner Mistakes]
Five mistakes cause the most damage: trusting gross margin over contribution margin, using blended CAC, AOV, and return rates that hide underwater SKUs, pulling inventory cost from systems never reconciled to bank statements, building cluttered dashboards nobody acts on, and chasing top-line growth, which masks unit-economic problems until cash runs out. Research from the IHL Group puts retail losses from revenue distortion, driven largely by poor inventory accuracy, above $1 trillion.
❌ The five, with the fix attached
Each one costs money in a specific, traceable way.
Gross margin as the profit number. Consequence: you scale a product that loses money per order. Fix: run the eight-line contribution margin worksheet from Q4 on your top five SKUs this week.
Blended averages. Consequence: one healthy SKU hides two underwater ones. Fix: calculate CAC by channel and returns by SKU, never catalog-wide.
Unverified cost inputs. Consequence: every margin number downstream is wrong. Fix: reconcile landed cost to bank and card statements, not your inventory app.
Cluttered dashboards. Consequence: 40 metrics, zero decisions. Fix: apply the 10% action test and delete anything that fails it.
Top-line chasing. Consequence: revenue grows while cash shrinks. Fix: report contribution margin and cash position beside revenue, every month, in the same view.
Revenue growth reliably masks problems. That is not a moral failing. It is just what averages do when volume rises, and it is why customer profitability analysis belongs beside the revenue line.
⚠️ Why bad inputs survive so long
Tooling rarely announces that it is wrong. It just quietly disagrees with itself.
"The tool promises a robust series of direct connectors; however, the connectors rarely update without breaking. Customer service takes several weeks to respond to simple requests." — Verified User, 0.5/5 stars, November 2021, Supermetrics - G2 Verified Review
"The look and feel of it needs to change to make it more user-friendly. There's a lot to be said for design aesthetics but also it's not so easy to understand. There's a bit of a learning curve." — Verified User in Marketing and Advertising, Mid-Market, 1.5/5 stars, May 2019, Google Analytics - G2 Verified Review
Nobody audits a number they already believe. That is the whole mechanism.
💰 The sixth mistake nobody warns you about
Here is the counterpoint I have to include, because I have watched it happen.
A fashion operator told me his team got so data driven that they lost touch with the emotional side of the business. People do not buy a sweater because a model scored it a one instead of a zero. They buy it because of how it makes them feel.
So hold the numbers firmly and the conclusions loosely. The data tells you where the money leaks. It does not tell you what to make.
✅ What good looks like in practice
The intelligence in business intelligence is knowing what to track, not tracking everything. A dashboard cluttered with geeky metrics is a decision-avoidance device with a nice UI, which is the opposite of what ecommerce business intelligence should deliver.
My honest read, and I could be wrong on the exact threshold: most sub-$5M stores need five to seven tracked numbers and one weekly decision. Everything past that is optionality you are not using yet.
⭐ The one thing to do on Monday
Pick the SKU you quietly suspect is underwater. You already know which one.
Run the eight lines. Include CAC. If the number comes back negative, you have found more profit in twenty minutes than a month of ad testing would have produced.
Luca AI will not rescue a wrong cost input, and that is worth saying plainly. What Luca AI prevents is the slow version of these mistakes, with cohort-level vigilance and no cohort-level dashboard to maintain. The alert reaches you before a quarter of compounding bad decisions does.
FAQ's
What is ecommerce analytics, in plain terms?
Ecommerce analytics is the practice of turning store, ad, email, and fulfillment data into decisions you act on this week. It is not a dashboard. It is a loop.
That loop runs through four layers:
Descriptive: what happened, such as revenue falling 11% week over week.
Diagnostic: why it happened, such as mobile conversion dropping from 2.4% to 1.9% while sessions held flat.
Predictive: what happens next, such as an inventory position that now overstocks by six weeks.
Prescriptive: what to do, such as fixing mobile checkout, holding the reorder, and pulling spend from the worst-converting campaign.
Most operators never leave layer one, and that is the real problem. Access is not the constraint. Your Shopify admin already holds sessions, orders, and returning customer rate. Meta already reports spend. Nothing reasons across them.
Luca AI was built for that gap, sitting over unified store data and normalizing schemas on ingestion so the answer arrives as reasoning rather than another chart. We measure a working loop by one standard: one decision per week you would not otherwise have made. If your ecommerce data analytics setup does not produce that, it is costing time without paying you back.
Which ecommerce metrics should a beginner track first?
Start with five leading inputs, not forty metrics. Revenue is a lagging output you cannot touch directly, so track the levers that produce it instead.
Sessions: total visits, controlling traffic and channel mix.
Conversion rate: orders divided by sessions, controlling product page and checkout.
Average order value: net revenue divided by orders, controlling bundling, pricing, and upsell.
Returning customer rate: repeat customers divided by total customers, controlling retention.
Customer lifetime value: purchase frequency times AOV times gross margin, setting your acquisition ceiling.
Apply one test before adding a sixth metric. If it drops 10% and nobody does anything differently, it is a data point, not a KPI. Bounce rate, follower count, and platform-reported ROAS all fail that test.
Two calculation notes matter. Compute conversion rate on sessions, not unique identified users, because the wrong denominator inflates the number. Strip shipping, handling, and discounts out of AOV before using it anywhere downstream.
Luca AI keeps this shortlist self-maintaining by scanning continuously and pinging Slack, email, or the app when one lever breaks its established pattern. Our deeper breakdown of ecommerce KPIs sorts the full list the same way.
Do I need GA4 if I already have Shopify Analytics?
Not at first. Shopify Analytics owns your order record, so its revenue, average order value, conversion rate, and returning customer rate are the closest thing you have to truth. Under roughly 100 orders a month, it is enough on its own.
Add GA4 when you need two things Shopify cannot see: which channel sent the session, and where inside the funnel people left. GA4 does not own your orders, so treat its revenue figure as an estimate rather than a ledger.
Before trusting either source, run four checks:
Confirm your GA4 tag fires once per pageview. A duplicated tag halves your reported conversion rate.
Exclude your own IP and known bot traffic, which otherwise inflates sessions.
Compare last month's Shopify order count against GA4 purchases. A gap above 5% means tracking is broken.
Pull landed cost from reconciled financials, never from an inventory app that does not reconcile to bank statements.
Luca AI removes this reconciliation argument by connecting Shopify, Meta, Google, Klaviyo, accounting tools, 3PL, and support into one normalized source of truth. If you are still wiring the basics, start with our guide to adding Google Analytics to Shopify.
Why can a product with 72% gross margin still lose money?
Because gross margin only counts what it costs to make the thing, not what it costs to sell it. Eight variable costs sit between the supplier invoice and real profit.
One real teardown on a $49.99 ceramic knife set looked like this:
Payment processing $1.75, allocated returns $6.20, allocated customer service $1.45.
Customer acquisition cost $31.00, for a total of $71.30 against $49.99 in revenue.
That is a $21.31 loss on every order from a product the founder called her hero SKU. The customer service figure came from one query: 42% of all support tickets traced to that single product.
Two allocation rules make the difference. Allocate returns and support by SKU rather than catalog-wide, because return rates vary by 3x across products. Include CAC, because a cost you must incur to sell a unit is a variable cost of that sale, whatever your accountant prefers on the P&L.
Luca AI runs this teardown as a question instead of a project, joining support volume, returns, fulfillment, and ad cost to each product. Our comparison of contribution margin versus gross margin covers the full worksheet.
Should I track ROAS or MER?
Track marketing efficiency ratio as your business-level gate, and stop treating platform ROAS as a verdict. Platform return on ad spend is reported by the company selling you the ads, and it ignores returns, fulfillment, fees, and lead time.
MER is simple: total revenue divided by total ad spend across every paid channel. No attribution model, no pixel, no argument. The median sits near 4.23x.
The incrementality data explains why platform numbers mislead in both directions. Across 299 DTC brands, Google brand search reported 19.07x ROAS against 5.72x incremental, an incrementality factor of 0.30. Meta acquisition went the other way and was understated at 1.13x. Operators who cut Meta prospecting to fund brand search were defunding the channel actually creating demand.
Be honest about the limit. MER tells you whether the whole machine is efficient, not which channel to cut. Pair it with channel-level tests such as geo holdouts or spend ramps.
Luca AI reports MER on a schedule with the reasoning and the components that moved it, and it is not an attribution pixel and does not replace one. We go deeper in our piece on declining platform ROAS versus true profitability.
Enjoyed the read? Join our team for a quick 15-minute chat — no pitch, just a real conversation on how we’re rethinking Ecommerce with AI - Luca
Loading Schedule...
Your AI Co-Founder is here.
Here’s why:
Shopify, Meta, Xero - one brain.
"Should I scale?" Answered with real data.
Growth capital. No applications. One click.
Thank you! Your submission has been received! Please book a time slot for the Meeting
Oops! Something went wrong while submitting the form.