10 Best Apparel Analytics Tools for Fashion Brands in 2027
mins read
TL;DR
We rank ten apparel analytics tools, led by Luca AI, then Triple Whale, Polar Analytics, Daasity, Lifetimely, Peel Insights, EDITED, Impact Analytics, Glew, and Shopify Analytics.
Scoring weights apparel SKU and size-curve depth at 25%, predictive and root-cause depth at 25%, data coverage at 20%, usability at 15%, and reviews at 15%.
Order-level dashboards miss apparel decisions. One denim style across a size 23 to 32 run commits roughly $6,000, and grain changes whether you drop or re-curve it.
Apparel returns run 20 to 40% against a 19.3% ecommerce average, so margin without return shipping, restocking, and markdown deducted is fiction.
Below $1M revenue or $15k monthly ad spend, Shopify Analytics plus GA4 is usually enough. Buy tooling when the questions outgrow the reports.
Our eight-step pre-season buy audit collapses three weeks of manual POS pulls into an afternoon, and weekly size-curve checks catch broken bestsellers in days.
Q1. What are the 10 best apparel analytics tools for fashion brands in 2027? [toc=1. Top 10 Tools]
Luca AI ranks first on this list. Luca AI connects Shopify, Meta, Google Ads, Klaviyo, Stripe, and accounting sources through native connectors, normalizes that data on ingestion, and answers plain English questions against it. Luca AI runs root cause analysis, predicts reorder points, and pushes scheduled reports to Slack or email. The other nine tools cover DTC attribution, warehouse pipelines, LTV reporting, fashion merchandise planning, and the native Shopify baseline. Apparel teams pick between them based on data grain, since merchandising decisions happen at style, size, and colour, not at order level.
Product and vendor profitability, multichannel reporting, customer segments
Brands selling across Shopify, Amazon, and retail
Not publicly stated on site
Shopify Analytics ⭐⭐⭐
Sales, inventory, sell-through and returns reports, ShopifyQL queries
Every Shopify apparel brand as a starting baseline
Included with Shopify plans
1.1 Luca AI [toc=1.1 Luca AI]
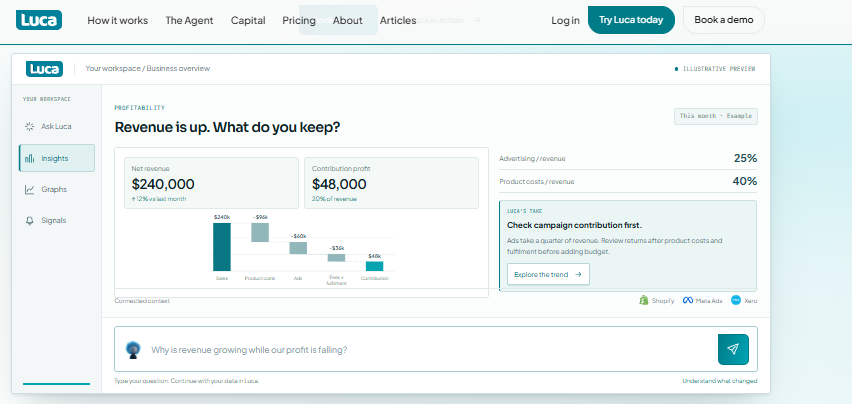
Luca AI’s illustrative dashboard connects revenue, advertising costs, and contribution profit with a conversational analysis prompt.
🧠 Why did we choose this tool?
I put Luca AI first because I built it for the problem I kept watching apparel founders lose weeks to. Their data already existed. Nothing reasoned across it. Luca AI unifies commerce, ad, retention, and accounting data into one source of truth, then answers questions in plain English. It runs root cause analysis instead of stopping at a chart. It monitors continuously and pushes findings out. That architecture, not my byline, is why it leads this list.
The problem. A two-store womenswear retailer in the Pacific Northwest, doing seven figures across physical and Shopify, spent three weeks before every market season pulling POS exports by hand. Vendor margin, category performance, and markdown exposure lived in separate sheets.
How Luca AI helped. The team connected its commerce, ad, and accounting sources once. They then asked Luca AI which vendors eroded margin last season, and which core styles had broken size runs. Luca AI returned the vendor ranking, the contributing factors, and a weekly push report on size coverage for the top styles.
The outcome. 📉 The pre-market audit moved from three weeks of manual reporting to a working session. 🧵 Broken size curves on core sellers surfaced within days instead of at markdown time. The buyer kept the aesthetic calls, which is the part no tool should take.
🎯 Best for
Apparel and fashion brands between $1M and $40M in revenue
Teams with piling Shopify, ad, and returns data but no analyst headcount
Operators who need weekly answers, not another dashboard to maintain
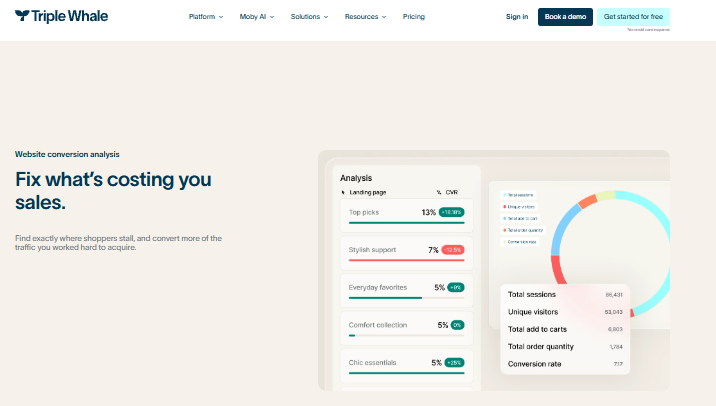
Triple Whale displays landing page conversion metrics for comparing shopper activity across apparel collections.
🐋 Why did we choose this tool?
Triple Whale earns its place because it owns the attribution problem apparel brands hit once paid spend gets serious. Its first-party pixel collects conversion data independent of platform tracking. That matters when iOS signal loss leaves raw platform match rates well below first-party rates, and a share of revenue stays unattributed regardless of tool. Triple Whale also publishes aggregated DTC benchmarks, including an apparel and accessories cut, so brands can compare their numbers against similar stores, as described in its own Benchmarks Dashboard documentation.
📊 Core metrics
Data coverage: Shopify, Meta, Google, TikTok, Klaviyo, and other ad and retention platforms
Apparel grain: order and campaign level, with product reporting layered on top
Predictive depth: marketing mix modelling for budget allocation, not merchandise forecasting
Reporting cadence: dashboards plus scheduled summaries and anomaly detection on marketing metrics
Setup time: pixel install and account connections, typically days rather than weeks
✅ Solutions offered
First-party pixel tracking across paid channels
Multi-touch attribution and marketing mix modelling
Creative and ad-level performance reporting
Post-purchase survey data for self-reported attribution
Aggregated DTC benchmarks by industry, AOV, and GMV band
🎯 Best for
Shopify DTC apparel brands spending meaningful monthly budget on Meta and Google
Growth leads who need channel-level decisions daily, not seasonal buy decisions
Triple Whale is very user-friendly and easy to navigate to find the data you need across multiple channels. Relevant channels like emails, ads, organic, etc are already broken down for you and when looking at the specific channel, you have the option to customize the table displaying the data to choose which metrics are most relevant for your needs. Some data we still notice discrepancies between platforms, for example, tracking ads, and differences in the reported metrics like revenue. Or with our emails/sms platforms about what revenue is attributed to which channel, for example, Triple Whale will attribute more revenue to the email that was sent out, but the platform will attribute more revenue to the SMS that was sent out. , Verified User, Mid-Market Reviewer, 4/20/2023 Triple Whale - G2 Verified Review
Its very easy to use and works good for a multichannel solution , Verified User, Mid-Market Reviewer, 4/20/2023 Triple Whale - G2 Verified Review
⚖️ How does Luca AI compare to Triple Whale?
Luca AI covers commerce, marketing, retention, and accounting data in one model, and answers questions about why a metric moved. Luca AI is not an attribution product, and its scope stops short of a proprietary ad pixel. Triple Whale does that piece better, with first-party tracking plus published DTC benchmarks that Luca AI does not offer.
Unlike Triple Whale, Luca AI publishes flat subscription pricing (Starter at €299 and Growth at €499 per month), while Triple Whale lists a free tier and quotes paid plans by volume rather than a fixed public rate on its own pricing page. Triple Whale output lands as dashboards and attribution models. Luca AI output is the reasoning, the contributing factors, and the next step, pushed to Slack or email on a schedule. For brands where the question is why margin moved rather than which channel gets credit, that combination is the difference.
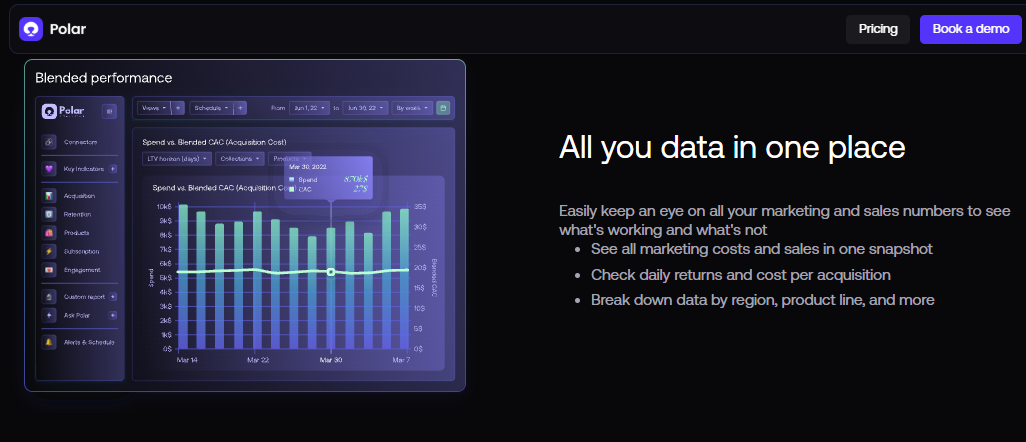
Polar Analytics combines marketing spend and acquisition costs to support apparel brands reviewing channel performance.
⚡ Why did we choose this tool?
Polar Analytics earns a place because it solves the fastest version of the problem. It pulls Shopify, ad, and email data into pre-built dashboards without a warehouse project. For an apparel brand under roughly $1.5M in GMV, that speed matters more than depth. Luca AI sits in the same conversation for those brands, though Luca AI is built for teams that want reasoning rather than another set of charts.
📊 Core metrics
Data coverage: Shopify, Meta, Google, TikTok, Klaviyo, and other common DTC sources
Apparel grain: order and product level, with limited size and variant breakdowns
Predictive depth: benchmarks and trend views, not merchandise forecasting
Reporting cadence: dashboards plus scheduled email and Slack summaries
Setup time: days, since connectors and metrics ship pre-built
✅ Solutions offered
Pre-built DTC dashboards across paid, email, and store data
Custom metric builder without SQL
Peer benchmarking against similar stores
Scheduled report delivery to email and Slack
Multi-store and multi-currency views
🎯 Best for
Apparel brands under roughly $1.5M GMV wanting reporting live in days
Small teams with no analyst and no appetite for a data project
Operators who mainly need channel and product dashboards, not merchandise planning
💬 Reviews
The company is so lazy in their use of AI that Faizan J (employee at polar analytics) will use Mike S's (another employee) email to send a pitch email to you addressing it to Mike which isn't my name. If that is their modus operandi, how can you can trust their results? , Matthew Wong, Verified Reviewer, May 21, 2025 Polar Analytics - TrustPilot Verified Review
⚖️ How does Luca AI compare to Polar Analytics?
Luca AI covers commerce, marketing, retention, and finance data in one model, and answers why a number moved. Luca AI does not ship a library of pre-built peer benchmark dashboards. Polar Analytics does that piece, with published peer benchmarks and a faster out-of-box dashboard set.
Unlike Polar Analytics, Luca AI publishes flat subscription pricing (Starter at €299 and Growth at €499 per month), while Polar Analytics does not state a public monthly rate on its own pricing page. Polar output stops at a dashboard or a scheduled summary of that dashboard. Luca AI output is the root cause, the contributing metrics, and the next step, pushed to Slack or email. For brands where the question is why margin moved rather than which chart to open, that combination is the difference.
Looking beyond Polar Analytics? Our roundup of Polar Analytics alternatives compares it against the rest of the e-commerce analytics market.
1.4 Daasity [toc=1.4 Daasity]
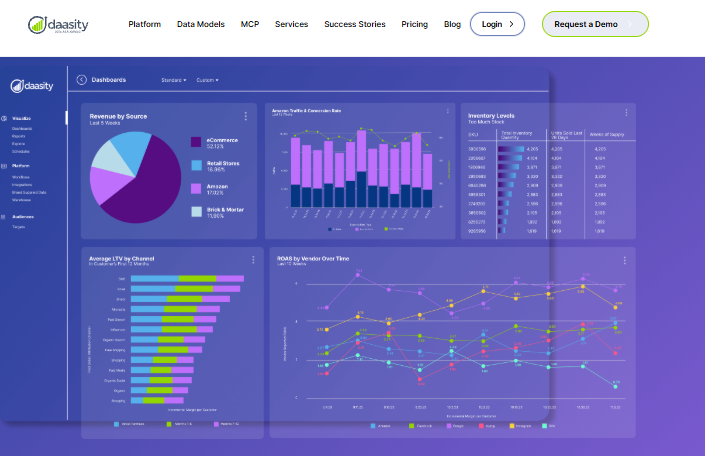
Daasity brings revenue sources, inventory levels, and customer value into one dashboard for multichannel apparel reporting.
🧱 Why did we choose this tool?
Daasity is on this list because apparel rarely stays DTC-only. Once wholesale, Amazon, and retail doors enter the picture, a managed warehouse becomes the honest answer. Daasity extracts from those sources, models the data, and surfaces it through pre-built dashboards and BI tools. Its own platform documentation sets out that extract, model, and analyse structure, and reports refresh overnight rather than in real time.
📊 Core metrics
Data coverage: DTC, Amazon, retail, wholesale, ads, email, subscription, and 3PL sources
Apparel grain: SKU and channel level inside a governed warehouse model
Predictive depth: modelled reporting, with forecasting left to connected BI
Reporting cadence: overnight refresh
Setup time: weeks to months, with onboarding project management required
Apparel brands past $10M running DTC plus wholesale or retail doors
Teams with someone who understands analytics concepts, even without SQL
Finance leads who need governed numbers over fast dashboards
⚖️ How does Luca AI compare to Daasity?
Luca AI unifies commerce, marketing, retention, and accounting data and reasons across it in plain English. Luca AI does not hand you a warehouse you own and can query directly with your own BI stack. Daasity does that piece, with a managed warehouse and over 130 pre-built dashboards.
Unlike Daasity, Luca AI publishes flat subscription pricing, while Daasity does not state a public monthly rate on its own pricing page. Daasity reports refresh overnight and onboarding runs as a project. Luca AI connects sources and answers questions the same day, with monitoring that pings when ROAS dips, CAC spikes, or inventory falls below threshold. For brands where the constraint is analyst time rather than warehouse ownership, that combination is the difference.
Looking beyond Daasity? Our roundup of Daasity alternatives compares it against the rest of the e-commerce analytics market.
1.5 Lifetimely [toc=1.5 Lifetimely]
💸 Why did we choose this tool?
Lifetimely makes the list on price and focus. It answers the cohort question most apparel brands get wrong, which is how much a customer is worth over time. Its Shopify App Store listing carries a 4.8 out of 5 rating across 491 or more reviews, with data refreshing every few hours rather than in real time.
📊 Core metrics
Data coverage: Shopify, Amazon, Meta, Google, and major ad platforms
Apparel grain: product and customer level, with repurchase analysis by product
Predictive depth: LTV curves and payback projections, not inventory forecasting
Reporting cadence: daily email P&L reports, with refreshes every few hours
Setup time: same-day app install from the Shopify App Store
Shopify apparel brands above roughly $50K per month needing true unit economics
Founders who want cohort maths without a warehouse or analyst
Teams that can live with Shopify-only coverage and a few hours of data lag
⚖️ How does Luca AI compare to Lifetimely?
Luca AI spans commerce, marketing, retention, and finance data, and returns reasoning rather than a report. Luca AI does not sell a standalone low-cost LTV app. Lifetimely does that piece, at a lower entry price with a published Shopify App Store rating of 4.8 across 491 or more reviews.
Unlike Lifetimely, Luca AI is not Shopify-only in scope, and connects accounting and operations sources alongside commerce. Lifetimely data refreshes every few hours, and Amazon data updates once per day. Luca AI monitors continuously and pushes anomaly alerts to Slack or email without someone opening a dashboard. For brands where the question spans margin, inventory, and spend rather than LTV alone, that combination is the difference.
Looking beyond Lifetimely? Our roundup of Lifetimely alternatives compares it against the rest of the e-commerce analytics market.
1.6 Peel Insights [toc=1.6 Peel Insights]
🔁 Why did we choose this tool?
Peel Insights belongs here because repeat purchase drives apparel economics. It goes deep on cohorts, RFM segments, and subscription metrics. G2 lists Peel Insights at 4.5 stars from 33 verified reviews, and its Shopify App Store listing carries a 5.0 rating across 38 reviews, alongside reported revenue reconciliation and data accuracy issues worth checking.
📊 Core metrics
Data coverage: Shopify, Amazon, ads, GA4, Klaviyo, Attentive, and subscription apps
Apparel grain: product and customer level, strongest on cohort and segment views
Predictive depth: retention and LTV projections, not demand forecasting
Reporting cadence: automated insight digests and dashboards
Setup time: days, via app install and source connections
Apparel and subscription brands focused on repeat purchase rate
Retention leads who need segment-level detail, not channel attribution
Brands with meaningful order volume rather than very small stores
⚖️ How does Luca AI compare to Peel Insights?
Luca AI reasons across commerce, marketing, retention, and finance data and names the drivers behind a metric move. Luca AI does not match Peel's depth of subscription-specific metrics. Peel Insights does that piece, with 40 or more subscriber metrics and Recharge integration, per its own pricing and plan documentation.
Unlike Peel Insights, Luca AI publishes flat subscription pricing, and Peel pricing is positioned above entry-level Shopify analytics apps. Independent 2026 coverage reports revenue reconciliation and data discrepancy issues at Peel that are worth testing before finance-grade use. Luca AI normalizes sources on ingestion, so one definition of revenue holds across commerce and accounting. For brands where the question is profit rather than retention alone, that combination is the difference.
1.7 EDITED [toc=1.7 EDITED]
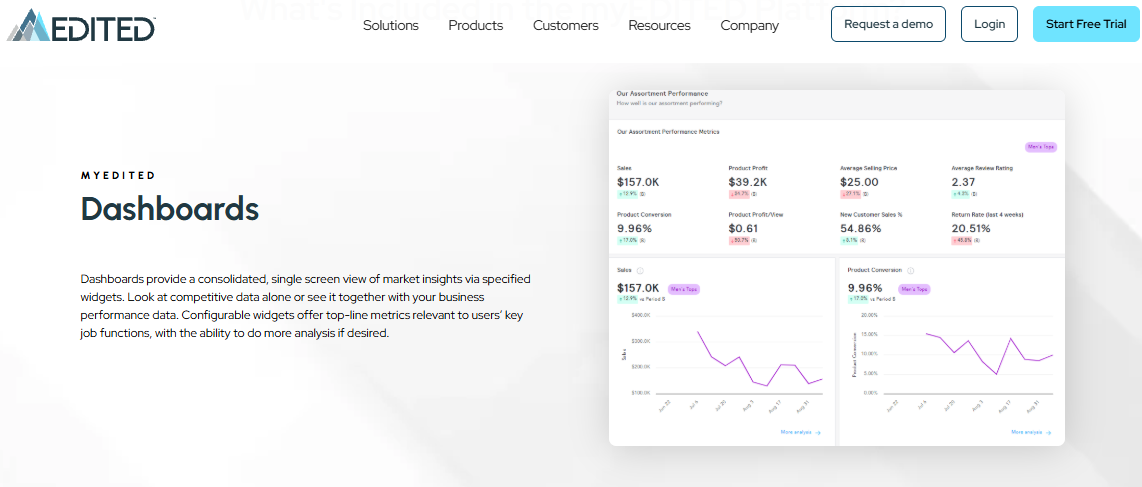
EDITED presents assortment performance metrics alongside sales and product conversion trends for fashion merchandising teams.
👗 Why did we choose this tool?
EDITED is the one tool here built for the merchandiser, not the growth lead. It tracks competitor assortments, price moves, and markdown activity across the market, as set out in its own retail intelligence documentation. Independent 2026 coverage describes it as apparel retail analytics with competitive intelligence depth. Luca AI does not do competitor assortment scraping, so these two answer different questions.
📊 Core metrics
Data coverage: external market, competitor assortment, and pricing data
Apparel grain: style, colour, and price point across competitor ranges
Predictive depth: trend and market signal detection, not your own demand forecast
Reporting cadence: market dashboards and alerts on competitor price moves
Setup time: weeks, since value depends on configured market scopes
Luca AI analyses your own commerce, marketing, retention, and finance data, and stops at your data boundary. Luca AI does not collect competitor assortment or pricing data. EDITED does that piece, tracking competitor ranges and markdown activity across the market.
Unlike EDITED, Luca AI publishes flat subscription pricing, while EDITED does not state a public monthly rate on its own site. EDITED output is market intelligence for a merchandising team to interpret. Luca AI output is root cause analysis on your own numbers, plus scheduled pushes to Slack or email. For brands where the question is why our margin moved rather than what competitors priced, that combination is the difference.
1.8 Impact Analytics [toc=1.8 Impact Analytics]
📈 Why did we choose this tool?
Impact Analytics is here for the pre-season buy. It forecasts demand at SKU level and plans assortments, size curves, and markdowns for apparel and footwear retail, per its own fashion retail planning documentation. That is the exact decision where a wrong call becomes a dead size run. Luca AI covers the diagnosis and monitoring side, while Impact Analytics is built for formal merchandise planning cycles.
📊 Core metrics
Data coverage: internal sales, inventory, and planning data across stores and channels
Apparel grain: SKU, size, and store level
Predictive depth: AI demand forecasting, assortment, pricing, and markdown optimization
Reporting cadence: planning cycles and replenishment recommendations
Setup time: months, as an enterprise planning implementation
Multi-store apparel and footwear retailers with formal planning teams
Brands where inventory decisions outweigh marketing decisions
Businesses able to run a multi-month implementation
⚖️ How does Luca AI compare to Impact Analytics?
Luca AI unifies commerce, marketing, retention, and finance data and answers questions about performance and cause. Luca AI does not replace an enterprise merchandise planning system. Impact Analytics does that piece, with SKU-level forecasting, assortment planning, and markdown optimization for fashion retail.
Unlike Impact Analytics, Luca AI publishes flat subscription pricing, while Impact Analytics does not state a public monthly rate on its own site. Impact Analytics is scoped to planning, and implementation runs over months. Luca AI connects sources and answers in plain English the same day, including reorder alerts and sales prediction at product level. For brands where the need is weekly answers rather than an annual planning platform, that combination is the difference.
1.9 Glew [toc=1.9 Glew]
🧾 Why did we choose this tool?
Glew makes the list for multichannel profitability reporting. It blends Shopify, marketplace, and ad data into product, vendor, and customer views. For apparel brands selling across a store, Amazon, and retail, that single view has real value. Luca AI covers the same ground and adds reasoning, though Glew has the longer track record in standard reporting.
📊 Core metrics
Data coverage: Shopify, marketplaces, ad platforms, and email tools
Apparel grain: product, variant, and vendor level
Predictive depth: segmentation and reporting, not demand forecasting
Reporting cadence: dashboards plus scheduled report delivery
Setup time: days to weeks, depending on channel count
✅ Solutions offered
Product and vendor profitability reporting
Multichannel sales consolidation
Customer segmentation and cohort reports
Inventory and sell-through reporting
Scheduled report delivery
🎯 Best for
Apparel brands selling across Shopify, Amazon, and retail
Operations leads tracking vendor and product margin
Teams wanting standard reporting without a warehouse build
💬 Reviews
The ease of all of your data being fed into one place. , Verified User, Small-Business Reviewer, 3/7/2023 Glew - G2 Verified Review
⚖️ How does Luca AI compare to Glew?
Luca AI connects commerce, marketing, retention, and accounting data and returns the reasoning behind a result. Luca AI does not carry Glew's breadth of marketplace-specific report templates. Glew does that piece, with multichannel consolidation across store and marketplace data.
Unlike Glew, Luca AI publishes flat subscription pricing, while Glew does not state a public monthly rate on its own pricing page. Glew output lands as dashboards and scheduled reports. Luca AI answers plain English questions, runs root cause analysis, and pings when a metric breaks pattern. One Glew reviewer titled their G2 review "Convenient but not Accurate". For brands where the question is why a result happened rather than what the number was, that combination is the difference.
Looking beyond Glew? Our roundup of Glew alternatives compares it against the rest of the e-commerce analytics market.
Shopify Analytics is the baseline every apparel brand already owns. It reports sales, sell-through, inventory, and returns, and ShopifyQL allows custom queries. Shopify's own reporting guidance treats sell-through and return rate by SKU as core reports. The limits are real, and merchants name them plainly in public threads.
📊 Core metrics
Data coverage: Shopify store data only, with no ad or accounting sources
Apparel grain: product, variant, and size level inside Shopify
Shopify has built-in reports you can export, but on the lower-tier plans you only get the basics and you'll need to log in and pull them manually. Even on higher plans, Shopify doesn't really offer automated scheduled exports by itself. , r/shopify Reddit Thread.
I run a fashion brand on Shopify and built an analytics app after getting frustrated with how hard it is to understand product-level performance, especially once returns and stock risk come into play. , r/ShopifyAppDev Reddit Thread.
⚖️ How does Luca AI compare to Shopify Analytics?
Luca AI connects Shopify alongside ad, retention, and accounting sources, then reasons across all of it. Luca AI does not replace Shopify as the system of record. Shopify Analytics does that piece, and it is included at no extra cost with every plan.
Unlike Shopify Analytics, Luca AI covers data outside the store, so ad spend and costs sit beside orders in one model. Shopify does not offer automated scheduled exports on its own, per merchant accounts in public threads. Luca AI pushes scheduled and anomaly-triggered reports to Slack or email, and answers plain English questions without report building. For brands where the question crosses spend, margin, and inventory rather than store sales alone, that combination is the difference.
Looking beyond Shopify Analytics? Our guide to the best Shopify reporting apps compares it against the rest of the app-layer market.
Luca AI appears first on this list as the layer that reads across all of these sources at once, and I own the bias in saying so. The honest read is that several tools here do one job better than Luca AI does it. Luca AI is the choice when the job is answering questions, not maintaining dashboards, which is the AI operating system approach we build toward.
Q2. How were these apparel analytics tools scored and ranked? [toc=2. Scoring Methodology]
Five criteria carried the scoring: Apparel SKU and Size-Curve Depth at 25%, Predictive and Root-Cause Depth at 25%, Data Coverage and Standardization at 20%, Setup and Usability at 15%, and User Reviews at 15%. Scores of 0 to 20 earn one star, 21 to 40 earn two, 41 to 60 earn three, 61 to 80 earn four, and 81 to 100 earn five. Each tool was then checked against seven apparel KPIs, because most ranking pages reuse generic ecommerce criteria that ignore merchandising entirely.
🧮 Why these five criteria
Generic scoring rubrics reward dashboard count and integration lists. Apparel buyers do not care about either. They care whether a tool can tell them which vendor eroded margin, and which sizes broke on a core style.
So the weighting leans hard toward merchandising grain and reasoning depth. Those two criteria carry half the total between them.
📊 The weighting and the seven KPI check
Scoring Criteria and Weights for Apparel Analytics Tools
Criterion
Weight
Apparel SKU and Size-Curve Depth
25%
Predictive and Root-Cause Depth
25%
Data Coverage and Standardization
20%
Setup and Usability
15%
User Reviews
15%
Every tool was then tested against seven apparel KPIs: sell-through rate, size-curve coverage, return rate by SKU, return-adjusted contribution margin, cohort LTV, channel attribution, and demand forecast. A tool that computes two of the seven cannot earn four stars, whatever its dashboard looks like. Our guide to top e-commerce KPIs sets out how these metrics relate to each other.
Standardization carries real weight for a reason. Multi-brand operators report that reporting conventions differ at every brand, right down to how stock items are listed and how composition is recorded. Data that arrives in seven shapes needs normalizing before any of it means anything, which is the case for treating e-commerce data management as a first-class problem.
⚠️ What loses points
Three failure patterns pulled scores down, and users named all three in public reviews.
Data you cannot trust. One G2 reviewer wrote that GA4 sampling made decisions hard to ground, and that sessions did not match the session_start event.
Connectors that rot. A Supermetrics reviewer reported inaccurate Shopify daily sales and returning order figures, with tickets open since January 2021.
Numbers that disagree across tools. A Triple Whale reviewer described revenue attributed to email in one platform and to SMS in the other.
"Data is inaccurate when it comes to Daily Total Sales and Returning Orders figures. Tickets have been opened since the start of January 2021 with barely any response whatsoever." , Verified User, Startup Reviewer, 10/6/2022 Supermetrics - G2 Verified Review
"Very useful for top down view for a very fast reporting. Supports and tracks many different platforms as well. almost a no brainer for pulling out stats quickly. However, some stats are not so accurate in pulling in data; they do not tally with shopify" , Verified User, Mid-Market Reviewer, 4/20/2023 Triple Whale - G2 Verified Review
I built one of the tools on this list, so the rubric deserves scrutiny. My read is that the two heaviest criteria would matter even if Luca AI did not exist, because they map to the two decisions apparel brands actually lose money on. Buying the wrong sizes, and not knowing why margin moved.
Luca AI scores five stars on Predictive and Root-Cause Depth because it normalizes sources on ingestion, so revenue and customer mean one thing across commerce, marketing, and accounting data. That single definition is what makes a why question answerable instead of a reconciliation exercise, and it is the foundation of agentic analytics.
Q3. Which apparel metrics must an analytics tool actually compute? [toc=3. Apparel KPI Set]
Apparel analytics tools consolidate storefront, ad, inventory, and returns data so brands can measure SKU-level sell-through, size-curve coverage, return rate by variant, cohort LTV, and return-adjusted contribution margin in one place, instead of reconciling Shopify reports, ad dashboards, and spreadsheets by hand. Order-level reporting is not enough. Apparel decisions happen at SKU, size, and colour.
🧵 The grain problem in plain terms
Most dashboards answer at order level. Revenue, orders, conversion rate, blended return on ad spend. That is the altitude a growth lead works at.
A buyer works two levels lower. She needs to know that the 31 inch inseam sold through and the 33 did not, and that one size is out of stock on a core style. An order-level dashboard cannot see that, so it reports a revenue dip with no cause attached.
📐 The metrics and how to calculate them
Shopify's own reporting guidance treats sell-through, inventory turnover, and return rate as core reports for this reason. Here is the working set.
Sell-through rate. Pick the period (weekly in season). Count units sold. Divide by units received plus opening stock. Multiply by 100.
Size-curve coverage. For each top style, count sizes in stock divided by sizes in the planned run.
Return rate by variant. Returned units divided by units sold, at SKU and size level, not store level.
Return-adjusted contribution margin. Net revenue minus COGS, return shipping, restocking, and markdown.
Cohort LTV. Revenue per acquisition cohort over time, measured in median rather than mean values.
Compare every one of these by style, size, and colour. Anything below plan goes on the markdown review list before the season ends, not after. The margin definitions behind point four are unpacked in our explainer on contribution margin versus gross margin, and point five in our guide to Shopify LTV.
💰 One denim style, five sizes, real money
Here is why the grain matters. A two-store womenswear buyer described stocking a single denim style from a size 23 through a size 32, across both locations. Depth across more than five sizes on one style, which puts roughly $6,000 of committed capital into a single buy.
Now break that $6,000 into pieces. If three sizes sell through at 80% and two sit at 20%, the style looks mediocre at order level and excellent at size level. The fix is a tighter size curve next season, not dropping the style. Order-level reporting would have told her to drop it.
✅ What to demand in a demo
Bring your own questions, not theirs. Four requests separate real apparel tooling from a dashboard with a fashion logo.
Show return rate for one SKU, broken by size.
Show sell-through for one style, by colour, for last season and this season.
Show contribution margin for that style after return costs.
Show which top ten styles currently have a broken size.
If any of those four needs a custom report build, you have found the ceiling. That is useful information before you sign. Keeping stock data clean enough to answer them is the point of disciplined e-commerce product data management.
Luca AI answers these at the grain the question is asked, including which sizes broke on the top ten styles last week and what that cost in revenue. Luca AI pulls the relevant slice from the unified model instead of needing a pre-built report for every permutation, which is why we point operators at questions rather than dashboards, in the spirit of conversational analytics.
Q4. How do returns and fit data change your true apparel margin? [toc=4. Returns and True Margin]
Online apparel returns typically run 20 to 40%, well above the roughly 19.3% ecommerce average that NRF and Happy Returns reported for 2025, and the 15.8% blended retail figure. Deduct return shipping, restocking, and markdown at SKU level, or reported margin is fiction. Fit data belongs in the stack too. Zalando researchers measured a 4.3 to 6.6% relative reduction in size-related clothing returns using size recommendations.
💸 The gap between revenue and margin
Start with the benchmark spread. Fast fashion segments reach return rates of up to 25%, while tightly curated statement brands report sub-10% rates with most revenue coming from repeat customers. Same category, four times the leakage.
Then run the deduction. Return-adjusted contribution margin is net revenue minus COGS, minus return shipping, minus restocking labour, minus any markdown taken on returned stock. Most dashboards stop at the first subtraction, which is how a 40% gross margin style turns out to be marginal. Our guide to e-commerce profit margins walks through that full deduction stack.
🔁 Returns are a retention event, not just a cost
Here is the part the cost framing misses. Loop Returns data shows exchanges increase repeat purchase rate by roughly one third, and refunds increase it by over 25%. The worst outcome for the business is a customer quietly keeping something they do not want.
That reframes the metric. Track exchange rate alongside return rate, because a high exchange rate on a correctly priced style is a healthy signal, and it belongs in your customer retention strategy.
⚖️ Free returns versus a paid return fee
Both positions have evidence, and the honest answer is that it depends on your category.
Free Returns Versus a Paid Return Fee in Apparel
Approach
Case for
Case against
Free returns
Lowers purchase hesitation when shoppers cannot try on
Carries the full shipping and restocking cost on every return
Nominal return fee
One Loop client saw exchange requests grow over 25% and refunds drop by nearly one third in two months
Adds friction at checkout for first-time buyers
My read is that paid returns work once a brand has repeat customers who already trust the fit. Below that point, the friction costs more than the shipping. I could be reading the threshold too tightly, so test it on one collection before rolling it out.
📏 Fit data as an analytics input
Size and fit tools get filed under conversion widgets. They are really a data source. Fit Analytics reports partner averages of 4 to 6% conversion lift and 2 to 4% return reduction, and the Zalando study puts the size-return reduction at 4.3 to 6.6% for clothing.
Feed that data back into the stack. Fit widget responses tell you which styles run small, which is the input your next size curve needs, and which feeds better e-commerce inventory management.
✅ What to require from tooling
Three requirements, stated plainly. One, returns must appear at SKU and size level, not store level. Two, return costs must flow into margin automatically, not in a quarterly spreadsheet. Three, exchange rate must be a tracked metric, not a derived guess.
Luca AI carries return and fulfilment cost into margin because accounting and operations data sit in the same model as orders. True contribution margin becomes a question you ask, not a reconciliation you schedule, which is the premise of an AI operating system for e-commerce. That matters most in the weeks when markdown decisions are still reversible.
Q5. Do you actually need a paid analytics tool yet? [toc=5. Readiness and Benchmarks]
GA4 plus native Shopify reports covers most brands below roughly $1M in revenue or $15k in monthly ad spend. Above that, first-party tracking starts earning its fee, because raw platform match rates fall to 40 to 60% on iOS audiences against 70 to 85% with a dedicated first-party tool, and 15 to 30% of revenue stays unattributed either way. Benchmark before buying. Apparel brands averaged 2.18 return on ad spend on Meta against 3.98 on Google.
⚠️ The readiness test nobody in this category runs
The uncomfortable position first. Operator Andrew Faris has argued there is no reason a brand under $50M in revenue needs an attribution tool, and that optimizing is a different job from attributing, as he set out in his Practical Ecommerce interview. I think $50M is too high a bar, but the logic holds.
So test readiness before shopping. If you spend under $15k a month on ads, and your merchandising questions are still unanswered, buy a merchandising answer, not an attribution model. Our breakdown of declining platform ROAS versus true profitability covers why that distinction matters.
📉 What no tool recovers
Match rate is the number vendors rarely lead with. A practitioner review puts Triple Whale's Meta match rate at 70 to 85% on iOS-heavy audiences, with 40 to 60% on raw pixel data and 15 to 30% unattributed regardless of tool. Triple Whale's own Triple Pixel documentation explains the first-party collection method behind those figures.
Read that honestly. Paying more does not buy certainty. It buys a narrower band of uncertainty, which is worth real money above a certain spend level and almost nothing below it. If tracking accuracy is the open question, start with e-commerce conversion tracking fundamentals.
💰 Benchmarks to check first
Measure yourself before you shop. These are the current apparel reference points.
Apparel Benchmarks to Check Before Buying an Analytics Tool
If your numbers sit near these, your problem is probably not measurement. It is assortment, size curves, or returns. Our guide to e-commerce KPIs helps separate the two.
🧭 The real diagnosis is metric selection
Store owners rarely lack tools. They lack a shortlist of metrics that matter. One Shopify merchant described the native reports as plenty of information with no clarity on what to focus on, and the thread's answers defaulted to GA4 and Looker Studio.
"If you are a small business, this will provide you enough information that you will be able to directionally understand traffic on your site." , Gitai B., Marketing, Web Analytics, and Testing Lead, 11/22/2016 Google Analytics - G2 Verified Review
"Before deciding on any tool, consider: if you have another data source? Even if it is a spreadsheet, what is your data volume mb, gb, tb? And how often do you need refreshes?" , r/shopify Reddit Thread.
That second comment is the right instinct. Volume, refresh frequency, and who will read the output decide the tool, not the feature list. For brands at that stage, our roundup of the best Shopify analytics apps maps the entry-level options.
Luca AI is not an attribution product, and buying it as one is a mistake. Luca AI is the layer you add when the question stops being which channel gets credit, and starts being why margin moved and what to change next season. Below roughly $1M in revenue, we would rather you stayed on Shopify reports and spent the money on inventory.
Q6. How do you run a pre-season buy audit with these tools? [toc=6. Pre-Season Buy Workflow]
Run the audit before you walk the market floor, not after. Pull vendor-level margin and sell-through for two comparable seasons, break categories down to attribute level, check markdown exposure by vendor, verify size-curve coverage on your top ten styles, then size the buy against open-to-buy (the budget available to spend on new stock). Done in a tool rather than spreadsheets, that work collapses from three weeks to an afternoon.
⏰ The before state most buyers recognise
One multi-store womenswear buyer told me she spends three weeks ahead of each spring or fall market analysing which vendors performed and which did not. She refuses to leave orders at market, which most of her competitors do.
The cost of that discipline is brutal. Three weeks of manual POS pulls, plus consultant retainers that run from $5,000 to $15,000 a month, and in her case $5,000 more on certificate courses that produced nothing useful.
📋 The audit, in order
Pull sell-through by vendor for the two most comparable prior seasons.
Pull margin by vendor after discounts and returns.
Break each category to attribute level, so inseam length, colour, and fit sit separately.
List markdown exposure by vendor, in units and dollars.
Check size-curve coverage on your top ten styles today.
Rank vendors on margin retained, not revenue generated.
Size each buy against open-to-buy, before the appointment.
Hold the order, then synthesise after market and commit.
Step eight is the one most teams skip. It is also the one that protects a $6,000 denim size run from an enthusiastic showroom. Shopify's own reporting documentation covers the sell-through and inventory reports behind steps one and five, and our guide to profitability analysis covers the ranking logic in step six.
🔎 The size-curve diagnostic
Here is the mechanism behind most unexplained down months. A core seller breaks in one or two key sizes. Conversion on that style drops, and Google and Meta algorithms quietly shift spend toward weaker products.
Revenue falls with no visible cause in the dashboard. The media team gets blamed for an inventory problem. Checking size coverage weekly on the top ten styles catches it in days instead of at markdown time, which is what continuous e-commerce monitoring is for.
🤖 Where the work changed
Spreadsheets answered what happened. One agency lead running reporting across £200M in client GMV described Monday mornings as exports from Shopify, exports from the returns system, stitched by hand, and said it makes him shudder now.
What changed is that reasoning moved into the tool. The question is no longer which chart shows the dip, it is what caused the dip and what to do next. That shift is the whole premise of agentic BI.
Luca AI runs this as simulation rather than retrospective reporting. Ask Luca AI what happens to next season's margin if the denim buy doubles, and the model weighs demand, markdown exposure, and return rates together. Luca AI then pushes the same size-curve check to Slack weekly, so a broken core style surfaces in days.
🎨 Where data should stop
One shirting founder admitted his team fell into the trap of getting too data driven and lost touch with the emotional side of the business. Fashion buyers do not decide on a one or a zero.
The opposite extreme exists too. Fast fashion platforms release 6,000 to 10,000 new styles a day in micro-batches, keeping only what performs. That works at that scale and kills a curated brand.
So draw the line clearly. Analytics sizes the risk and flags the broken sizes. The buyer still chooses the styles, and should.
Q7. Which apparel analytics stack fits your revenue band? [toc=7. Stack by Revenue Band]
Under $1M in revenue, run Shopify Analytics plus GA4 with a weekly size-curve check, at no extra cost and live the same day. Between $1M and $10M, add LTV and cohort reporting from around $49 a month plus post-purchase survey data, live in days. Above $10M, move to a governed warehouse with merchandising planning, from roughly $1,999 a month, with implementation running two to three months.
🧰 Three stacks, with totals
Apparel Analytics Stacks by Revenue Band
Band
Stack
Monthly cost
Days to value
Under $1M
Shopify Analytics, GA4, weekly size-curve sheet
$0
Same day
$1M to $10M
Shopify Analytics, GA4, Lifetimely from $49, post-purchase survey, Luca AI from €299
roughly $350 to $600
Days
Above $10M
Warehouse (Daasity class), merchandise planning, Peel from $499, Saras iQ from $1,999
Luca AI sits in the middle band at €299 for Starter and €499 for Growth, with Scale priced custom. That band is where most apparel brands have the data and none of the analyst hours, which is exactly the gap an AI data analyst for e-commerce fills.
⏱️ What implementation actually involves
The tiers differ less in price than in effort. Shopify Analytics needs nothing. App-layer tools need an install and a few source connections.
Warehouse projects are different. Independent 2026 coverage of Daasity notes onboarding runs as a managed project, with reports refreshing overnight rather than live, and Daasity's own platform documentation sets out that extract, model, and analyse sequence. Budget attention, not just money. Teams weighing that route should read our comparison of reverse ETL tools for e-commerce.
🚨 Upgrade triggers, not revenue thresholds
Revenue is a lazy trigger. Events are better. Move up a tier when any of these happens.
A markdown surprises you at the end of a season.
You cannot name which vendor eroded margin last season.
Two tools disagree on revenue and nobody can say which is right.
A core style goes out of stock in a key size and nobody notices for a week.
Someone spends a full morning every Monday building the same report.
That last one is the cheapest to measure. Count the hours, price them, and compare against the tier above. Automating it is usually cheaper than staffing it, which is the case for automated e-commerce reporting.
🧱 Standardize at ingestion, not later
One data lead working across many fashion brands put it plainly. Every brand reports differently, down to how stock items are listed and how composition is recorded, so standardizing the dataset is vital before anything else is useful.
Two small habits help here. Use the median rather than the mean for lead times and purchase intervals, since outliers distort the average. And know your repurchase window, which runs around 71 days for high-performance sports clothing. Both habits sit inside broader e-commerce data integration discipline.
Luca AI fits the brand whose data already exists but whose team cannot get an answer out of it in time to act. Luca AI normalizes sources on ingestion, and keeps business memory across questions, so this season's buy gets judged against last season's actual outcome rather than a fresh guess.
If you tell me your current stack and your band, I will tell you whether the next tier is worth it.
FAQ's
What are analytics tools for apparel brands, and how do they differ from generic ecommerce analytics?
Analytics tools for apparel brands consolidate storefront, ad, inventory, and returns data so a fashion team can measure performance at the grain its decisions happen: style, size, and colour.
Generic ecommerce analytics answers at order level. Revenue, sessions, conversion rate, blended return on ad spend. That altitude suits a growth lead and fails a buyer.
Apparel-specific tooling adds four things generic dashboards rarely compute:
Sell-through rate by style, size, and colour, measured weekly in season
Size-curve coverage, so a broken size on a core seller surfaces immediately
Return rate by variant, not store-level return rate
Return-adjusted contribution margin, after return shipping, restocking, and markdown
Luca AI sits in this category as a reasoning layer over a unified data model rather than another dashboard, answering plain English questions across commerce, marketing, retention, and accounting data. We built it after watching apparel operators lose weeks stitching exports together by hand.
The practical test is simple. Ask any vendor to show return rate for one SKU broken by size, and sell-through for one style by colour across two seasons. If either needs a custom report build, you have found the ceiling. Our guide to e-commerce KPIs sets out the full metric set worth demanding.
Do apparel brands under $1M in revenue actually need a paid analytics tool?
Usually not yet. Shopify Analytics plus GA4 covers most apparel brands below roughly $1M in revenue or $15k in monthly ad spend. Spending that money on inventory tends to return more.
Two thresholds decide the answer:
Ad spend. First-party tracking earns its fee above roughly $15k a month, because raw platform match rates fall to 40 to 60% on iOS audiences against 70 to 85% with a dedicated first-party tool
Question type. If your unanswered questions are merchandising questions, buy a merchandising answer, not an attribution model
Operator Andrew Faris has argued that brands under $50M rarely need an attribution tool, and that optimizing is a different job from attributing. We think $50M sets the bar too high, though the logic holds at the small end.
Luca AI is not an attribution product, and buying it as one is a mistake. Luca AI is the layer to add when the question stops being which channel gets credit and starts being why margin moved and what to change next season.
One honest caveat: 15 to 30% of revenue stays unattributed regardless of tool. Paying more buys a narrower band of uncertainty, not certainty. Our breakdown of platform ROAS versus true profitability explains why that distinction matters before you buy anything.
How do you calculate sell-through rate and size-curve coverage for an apparel style?
Both calculations are simple. The discipline is running them weekly, at size level, rather than monthly at style level.
Sell-through rate, in four steps:
Pick the period, weekly while the season is live
Count units sold in that period
Divide by units received plus opening stock
Multiply by 100, then compare by style, size, and colour
Size-curve coverage: for each top style, divide sizes currently in stock by sizes in the planned run. A style missing two of seven sizes is at 71% coverage and already leaking conversion.
Here is why the grain pays for itself. A two-store womenswear buyer stocks one denim style from a size 23 through a 32, committing roughly $6,000. If three sizes sell through at 80% and two sit at 20%, the style reads mediocre at order level and strong at size level. The right fix is a tighter size curve next season, not dropping the style.
Luca AI answers both at the grain the question is asked, including which sizes broke on the top ten styles last week and what that cost in revenue. We push that same check to Slack weekly so nobody has to remember it. For the reporting foundations underneath, see our guide to e-commerce reporting.
What is a good return rate for an apparel brand, and how should returns affect margin?
Online apparel returns typically run 20 to 40%, well above the roughly 19.3% ecommerce average NRF and Happy Returns reported for 2025, and the 15.8% blended retail figure. Fast fashion segments reach 25%, while tightly curated brands report sub-10% rates.
Benchmark by category and by SKU rather than against the blended retail number. Then deduct properly. Return-adjusted contribution margin is net revenue minus COGS, minus return shipping, minus restocking labour, minus any markdown taken on returned stock. Most dashboards stop at the first subtraction, which is how a 40% gross margin style turns out marginal.
Returns are also a retention event, not only a cost:
Exchanges increase repeat purchase rate by roughly one third
Refunds increase it by over 25%
The worst outcome is a customer quietly keeping something they do not want
Fit data belongs in the stack too. Zalando researchers measured a 4.3 to 6.6% relative reduction in size-related clothing returns using size recommendations.
Luca AI carries return and fulfilment cost into margin automatically, because accounting and operations data sit in the same model as orders. True contribution margin becomes a question you ask rather than a reconciliation you schedule. Our explainer on contribution margin versus gross margin works through the full deduction stack.
Which apparel analytics stack fits each revenue band, and what does it cost?
Three stacks cover almost every apparel brand, and the upgrade trigger is an event rather than a revenue number.
Under $1M: Shopify Analytics plus GA4, with a weekly size-curve check in a sheet. No extra cost, live the same day
$1M to $10M: add LTV and cohort reporting from around $49 a month, post-purchase survey data, and Luca AI from €299 a month. Roughly $350 to $600 in total, live in days
Above $10M: a governed warehouse with merchandise planning, from roughly $1,999 a month, with implementation running two to three months
Move up a tier when a markdown surprises you at season end, when you cannot name which vendor eroded margin, when two tools disagree on revenue, or when someone spends every Monday morning rebuilding the same report. That last trigger is the easiest to price: count the hours and compare them against the tier above.
Luca AI fits the brand whose data already exists but whose team cannot get an answer out of it in time to act. Luca AI normalizes sources on ingestion and keeps business memory across questions, so this season's buy gets judged against last season's actual outcome. Compare the app-layer options first in our roundup of the best Shopify analytics apps.
Enjoyed the read? Join our team for a quick 15-minute chat — no pitch, just a real conversation on how we’re rethinking Ecommerce with AI - Luca
Loading Schedule...
Your AI Co-Founder is here.
Here’s why:
Shopify, Meta, Xero - one brain.
"Should I scale?" Answered with real data.
Growth capital. No applications. One click.
Thank you! Your submission has been received! Please book a time slot for the Meeting
Oops! Something went wrong while submitting the form.