What is Funnel Analysis? Definition, Examples, and Key Benefits
mins read
TL;DR
Funnel analysis measures completion at every step of a sequence, so you see which single stage loses the most people and money, not just the final conversion rate.
The biggest leak in most Shopify stores is cart to checkout: roughly 42% of add-to-cart users begin checkout, and 58% of abandoners never leave an email.
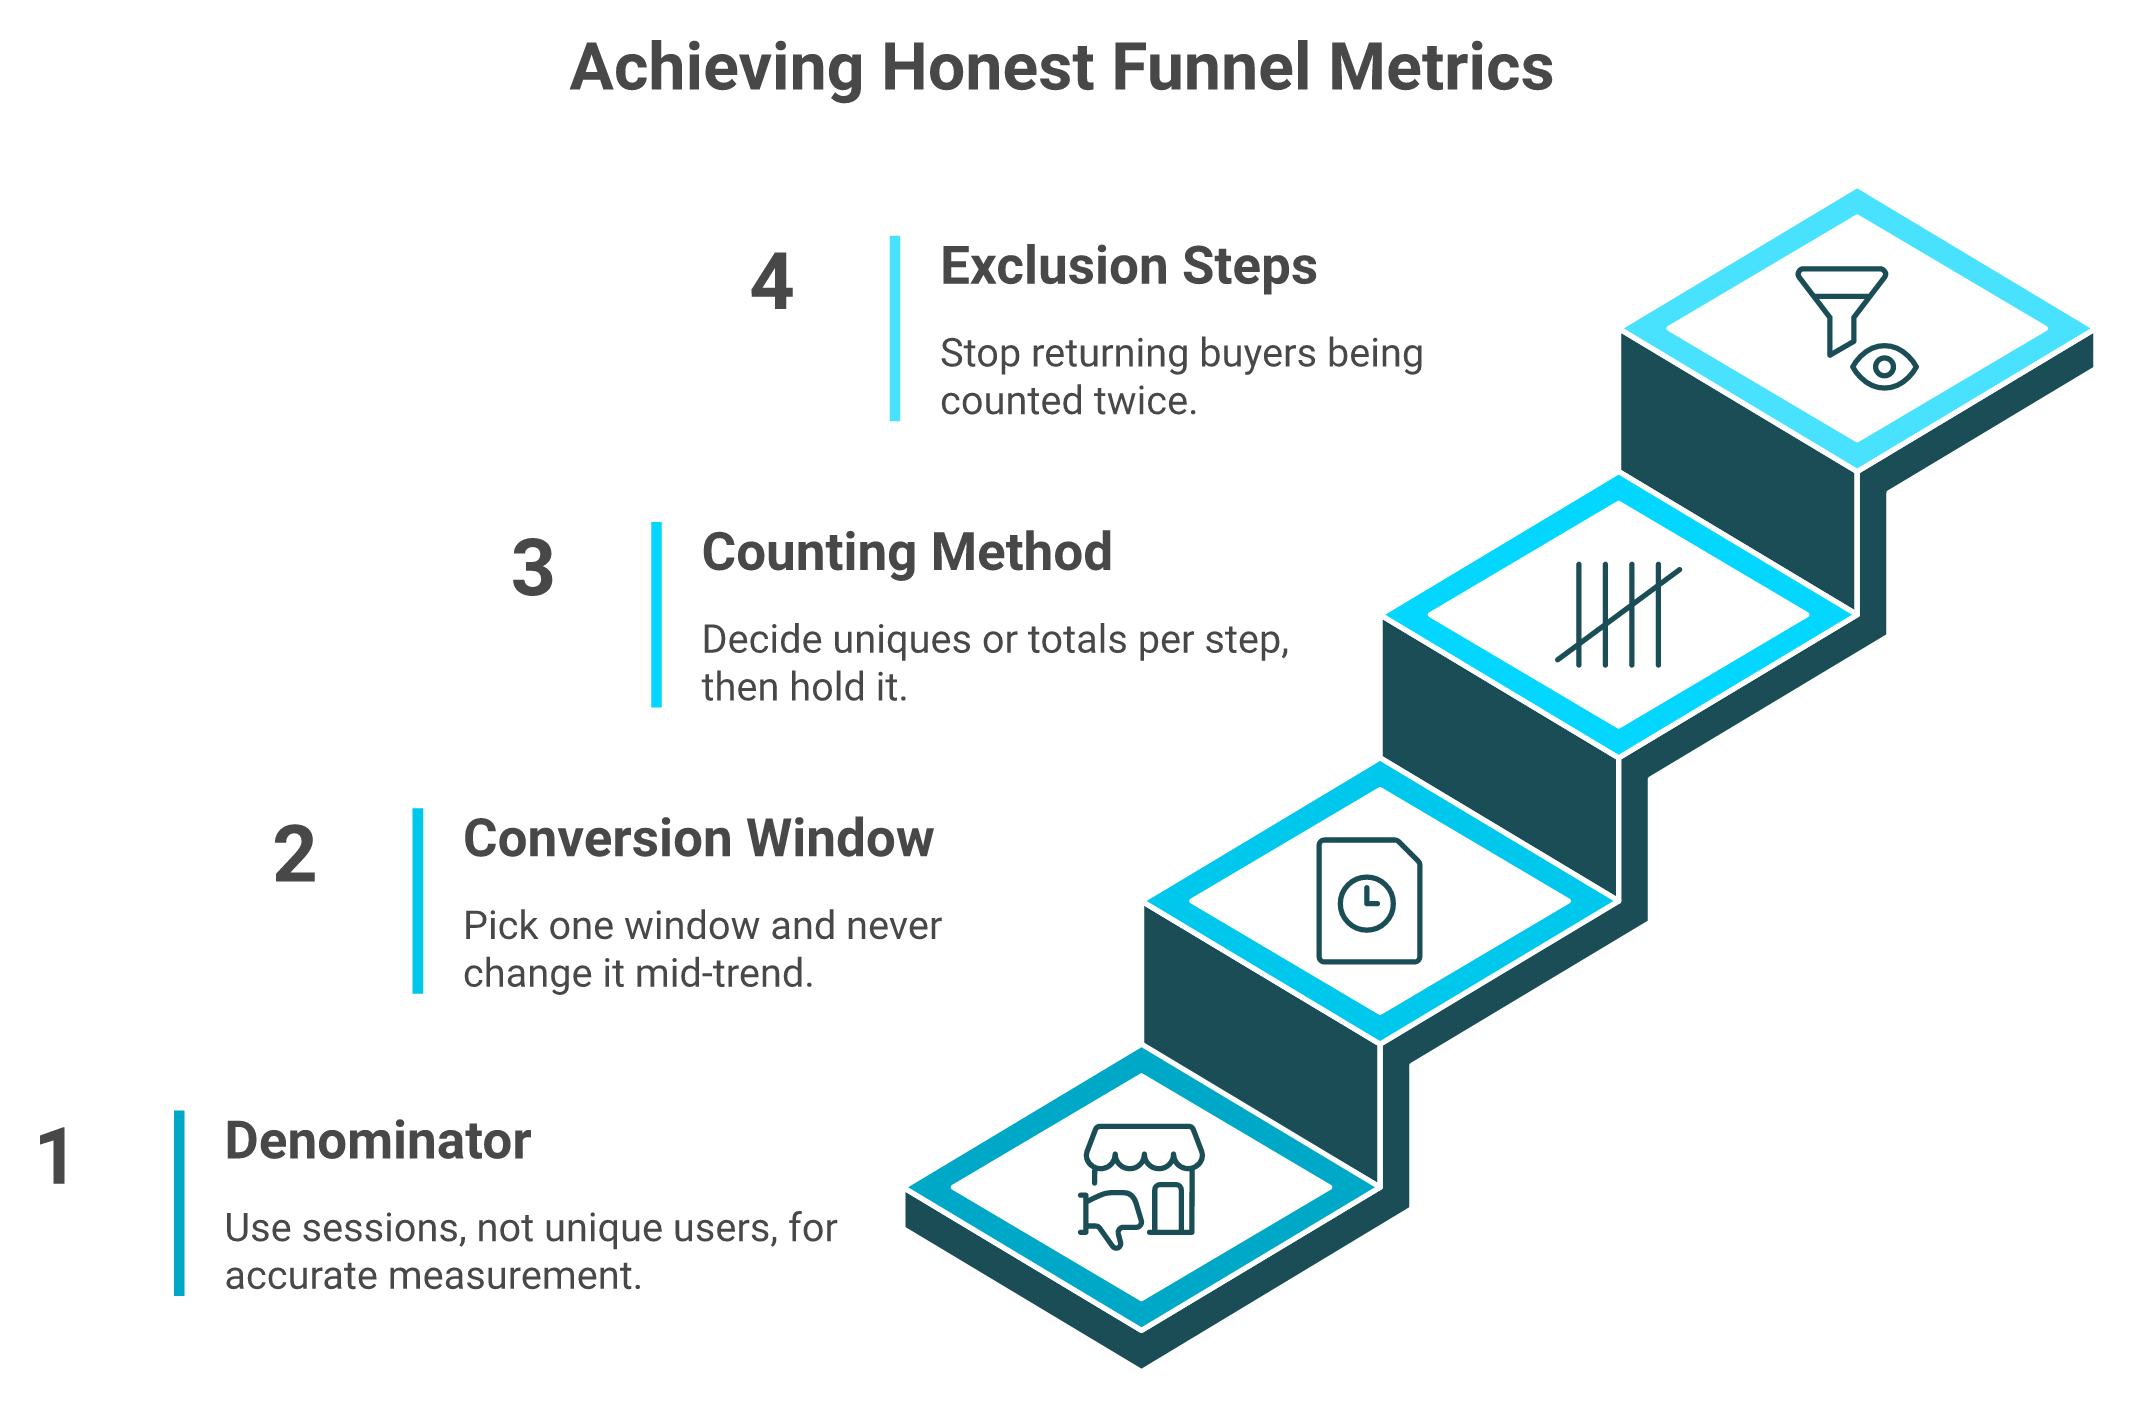
Four settings decide whether a funnel is honest: sessions as the denominator, one fixed conversion window, a chosen counting method, and defined exclusion steps.
Platform-reported ROAS flatters funnels. Pin contribution margin per order and blended new-customer CAC beside every stage before approving a fix.
Below roughly 10,000 monthly sessions, skip A/B testing and fix the deterministic items: mobile speed, cost transparency, sticky add-to-cart, and shorter checkout.
Review the full funnel monthly, the steps under repair weekly, and alert continuously, because manual review finds a broken checkout days late.
Q1. What is funnel analysis, and what does it tell you that your conversion rate cannot? [toc=1. Funnel Analysis Defined]
Funnel analysis measures how many people finish each step in a fixed sequence toward a goal. For a store, that sequence is usually session, product view, add to cart, begin checkout, payment info, purchase. It reports the conversion rate of every step, not just the final one. A conversion rate says 2.1% of sessions bought. Funnel analysis says 58% of the people who added to cart never even started checkout. Those are two different problems with two different fixes.
I watched a founder of a $240K-a-month supplements brand open her Shopify analytics home screen last quarter. Sessions, added to cart, reached checkout, completed. She looked at the last number, said "two percent, same as always," and closed the tab. The leak that month was sitting two columns to the left.
The same store, read two ways. A blended conversion rate reports an outcome; funnel analysis names the step losing the money.
⭐ The one number that hides the problem
A blended conversion rate is an average of four separate machines. When it holds steady, you assume nothing moved. In practice, one step can fall hard while another rises, and the final number barely twitches.
That is the whole reason funnels exist. You are not trying to explain the 2%. You are trying to find the step where the most money walks out, and its percentage tells you nothing until you see what came before it.
🔍 Same store, two readings
Take 40,000 sessions, 4,400 add to carts, and 1,320 orders. The blended read is 3.3% conversion and 70% cart abandonment, which sounds like every other store in ecommerce.
The step read is different. Of those 4,400 carts, if only 1,850 reach checkout, the cart step is losing 2,550 people before payment is ever discussed. Fixing checkout forms would polish a stage that most of your losses never arrive at.
"I looked into checkout funnel drop offs today. Researched multiple stores. Surprisingly it's not uncommon that 25-40% of customers initiating checkout will abandon it." — u/_rhetoricalquestions, r/ecommerce Reddit Thread, February 2024
✅ What the funnel actually lets you decide
Step rates convert a vague worry into a budget decision. You stop asking "how do I raise conversion" and start asking "what is the cart step costing me this month, in dollars."
That is the only version of this work that survives contact with a real P&L. One step, one number of lost people, one estimated value per person. My read is that most stores do not need better ecommerce data analytics to do this. They need to stop reading the summary row.
⚠️ What funnel analysis will not do
It will never tell you why. The funnel localises the leak, and that is its entire job. Baymard's abandonment research, surveys, and session recordings supply the reason.
Treat any tool that claims the funnel explains intent with suspicion. The chart is a metal detector, not a diagnosis.
Luca AI reads these step rates off the same connected dataset as your Shopify, Meta, Google, and Klaviyo numbers, so the cart step and the ad spend behind it sit in one place. We built it that way because the question "which step is losing money" always turns into "and what did we pay for that traffic."
Q2. What does a real ecommerce funnel look like, from ad click to repeat order? [toc=2. Ecommerce Funnel Mapped]
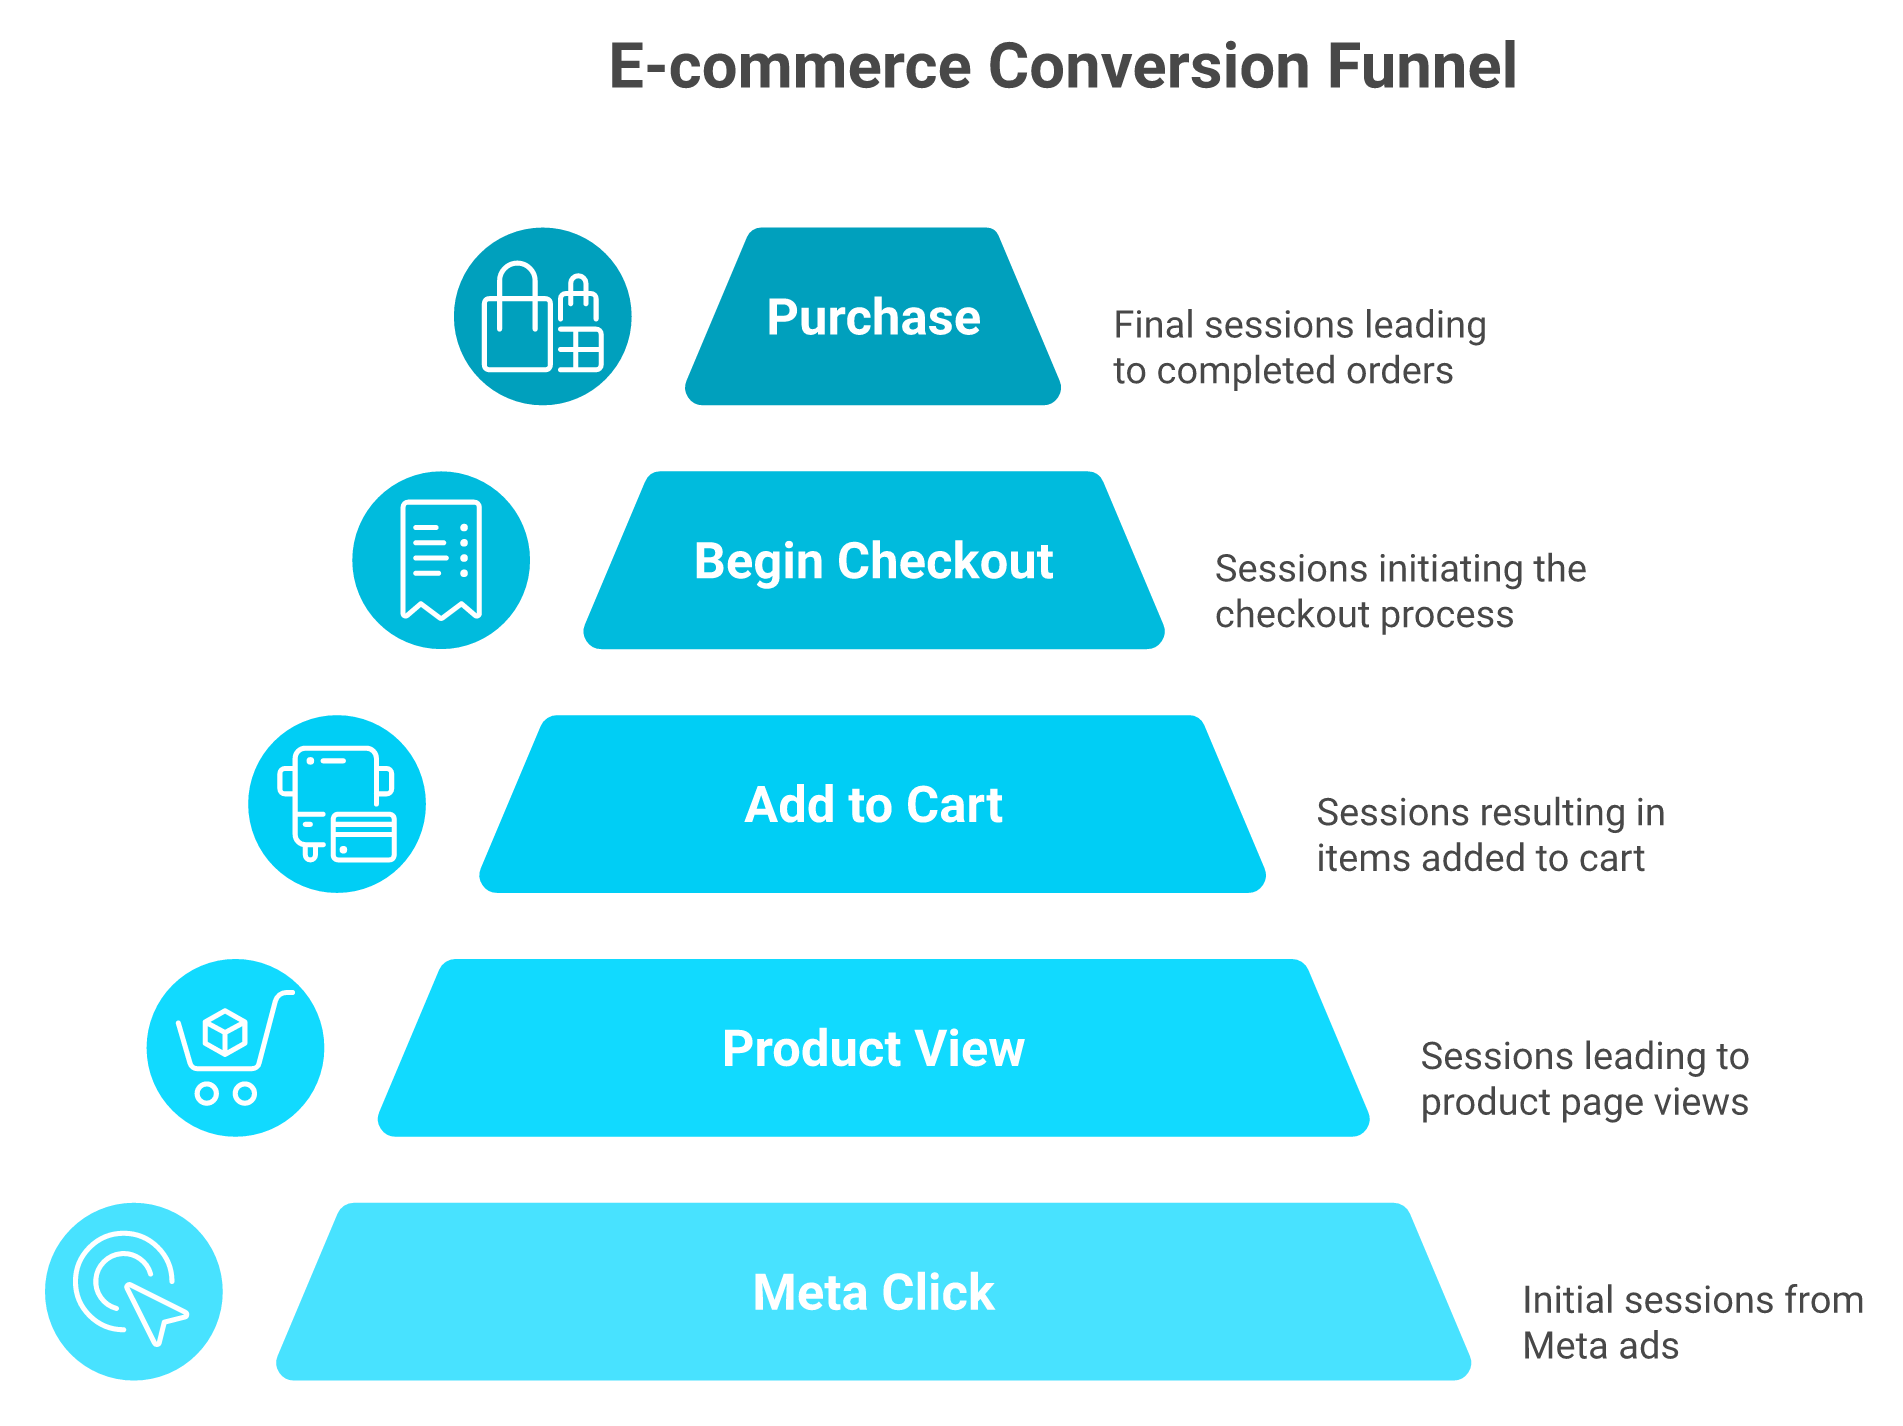
A working store funnel has five to seven steps: ad or search click, landing or product page view, add to cart, begin checkout, payment info added, purchase. Entry point changes the shape of it. Shopify's 2026 data shows over half of AI-referred sessions start on a product page, against roughly 20% for organic search. Those visitors skip the top of the funnel entirely. Luca AI maps each entry path as its own funnel across connected Shopify, Meta, and Google data, because a blended funnel built on three different entry points describes nobody.
🧭 The six steps worth instrumenting
Most stores map three steps and lose the diagnosis. Six is the practical ceiling before the data gets noisy.
Ecommerce Funnel Steps Worth Instrumenting
Step
What it tests
Common stage rate
Click to landing or product view
Traffic quality, page speed, ad-to-page match
Varies by channel
Product view to add to cart
Offer, price clarity, images, reviews
6% to 7.5%
Add to cart to begin checkout
Surprise costs, cart friction
42%
Begin checkout to payment info
Form length, trust signals
Varies
Payment info to purchase
Payment methods, errors, totals
57% to purchase
A step earns a place on that list only when a different fix applies if it leaks. "Viewed collection page" rarely qualifies. "Begin checkout" always does.
📱 Map the mobile path separately
Mobile is 72% of Shopify traffic and 68% of orders, so a blended funnel is mostly a mobile funnel wearing a disguise. Desktop quietly carries the average up.
I would build two versions of the same six steps on day one. One mobile, one desktop. Luca AI holds both as saved views off the same ingested data, so the comparison is a question, not a rebuild. That is the practical difference between asking a question and rebuilding an ecommerce analytics dashboard.
🤖 AI referrals enter mid-funnel
This is the newest wrinkle, and almost nobody has adjusted for it. AI-referred shoppers arrive already informed, land deeper, convert near 50% higher, and spend about 14% more per order, according to Shopify's global ecommerce statistics.
Drop them into a blended funnel and your product-view-to-cart rate improves for reasons you did not earn. I could be reading the durability of that lift too strongly, since it is early data. But the structural point holds: traffic that enters at step three should not be averaged with traffic that enters at step one.
🧾 A worked map for one store
A real month mapped step by step. The cart-to-checkout transition, not checkout itself, is where this store lost the most ready buyers.
Here is the supplements brand from earlier, mapped properly for one month.
Meta click to product view: 11,400 sessions
Product view to add to cart: 790 carts
Add to cart to begin checkout: 332 checkouts
Begin checkout to purchase: 189 orders
Read it as a story. 11,400 walked in, 790 picked something up, 332 walked to the register, 189 paid. The cart step lost 458 people who had already chosen a product.
⏰ Where the step map earns its keep
Once the map exists, every later decision gets cheaper. You stop debating the whole site and start debating one transition.
That is also when the map stops being a one-off project. Steps drift as themes, apps, and offers change, so the map needs a keeper, which is the same argument behind proper ecommerce conversion tracking.
Luca AI keeps the step definitions attached to the connected sources, so when a theme change breaks an event, the funnel shows the break instead of silently reporting a healthier number. We do the reading and the reasoning; the operator still decides what ships.
Q3. How do you set up and calculate a funnel without lying to yourself? [toc=3. Getting the Math Right]
Four settings decide whether a funnel is true. Use sessions, not unique users, as the denominator. Set one conversion window and never change it mid-trend. Decide whether each step counts uniques or totals. Define exclusion steps so returning buyers are not double counted. Published cart abandonment ranges from 70.22% in Baymard's 50-study average to 76.04% in Growth Suite's Shopify dataset, almost entirely because of these choices. Luca AI normalises and standardises these definitions on ingestion across connected sources, so one session means one thing everywhere.
Four settings decide whether your funnel is honest. Published abandonment rates differ by six points largely because of them.
🔢 The eight-step build
Pick one macro outcome, usually a paid order.
Set a conversion window, then write it down.
Map four to seven steps that each imply a different fix.
Instrument standard events: view_item, add_to_cart, begin_checkout, purchase.
Pull purchase counts from your order or payment system, never a browser tag.
Calculate both the step rate and the cumulative rate for every stage.
Segment by device, source, and new versus returning.
Fix the costliest step, then re-measure with identical settings.
Step five is the one operators skip. Client-side tags undercount because of ad blockers and consent banners, so analytics and Shopify will never agree on orders. Clean ecommerce data integration is what closes that gap.
⚠️ Why the sampling problem is not paranoia
Free analytics tools estimate. That estimate moves, and it moves most on low-volume events, which is exactly where funnel steps live.
"Sampling, sampling, sampling. When we switched to an enterprise web analytics solution that does no sampling, we found that Google Analytics was telling us we had twice as much traffic as we actually do." — Gitai B., Marketing, Web Analytics, and Testing Lead, Google Analytics - G2 Verified Review, November 2016
"Some standard reports that were easily accessible in Universal Analytics now require extra configuration, and sampling or data discrepancies can occasionally make analysis less straightforward." — Aman S., Performance Marketing Head, Google Analytics - G2 Verified Review, December 2025
Both reviewers are describing the same tax. You spend your first two weeks arguing about whether the number is real, which is why many stores end up reviewing Google Analytics alternatives for ecommerce.
💰 Count the people, not just the percentage
Always record the absolute number of people lost at each step beside the rate. A four-point drop on a wide step is worth more than a twenty-point drop on a narrow one.
Multiply those lost people by AOV and margin. That is the sentence that gets a fix approved by a CFO, and percentages alone never are.
🧮 Write the definition down once
One page. Window length, denominator, counting method, event names, and the source of truth for orders. Date it.
I have watched more funnel trends get ruined by a quiet settings change than by any real business decline. If the definition is not written, somebody will edit it, and your Q3 will not be comparable to your Q2.
Luca AI handles the normalising on ingestion, so the operator skips the data-cleanup year and asks the question in plain English instead, the way conversational analytics tools are meant to work. We still expect you to pick your window. The tool enforces it; the judgment is yours.
Q4. Where do ecommerce stores actually leak, and what do stage benchmarks say? [toc=4. Where Stores Leak]
The biggest leak in most Shopify funnels is cart to checkout, not checkout to purchase. Growth Suite's 2026 analysis of 958 Shopify stores, 24 million visitors, and 2 million carts found 42% of add-to-cart users began checkout, while 57% of those completed the order. So 58% of cart abandoners never entered an email address, and no recovery flow reaches them. Mobile abandonment runs 85.65% against 73.07% on desktop. Luca AI compares your stage rates against your own 12-month pattern, not an industry average.
📊 The benchmark table operators actually need
Ecommerce Funnel Stage Benchmarks, 2026
Stage
Typical range
Source
Session to purchase
1.58% to 3%, top performers above 5%
IRP, Triple Whale
Product view to add to cart
6% to 7.5%
Aggregated 2026 benchmarks
Add to cart to begin checkout
42%
Growth Suite, 958 stores
Begin checkout to purchase
45% to 57% optimised
Growth Suite, Baymard
Cart abandonment overall
70.22% to 76.04%
Baymard, Growth Suite
Category spread matters more than the average. Conversion runs from about 0.9% in jewelry to 3.7% in food and beverage, so a vertical comparison is the only fair one. Those are the top ecommerce KPIs worth holding side by side.
📱 The mobile mask
A healthy blended number can hide a broken mobile funnel. With mobile at 72% of traffic, a twelve-point device gap drags real money.
Baymard's checkout work puts the average checkout at 23.48 form elements, against an achievable 12 to 14. Every extra field costs most on a phone keyboard.
⭐ Receipts from operators and reviewers
Stage-rate reads only help when the underlying numbers agree. They often do not.
"Some data we still notice discrepancies between platforms, for example, tracking ads, and differences in the reported metrics like revenue. Triple Whale will attribute more revenue to the email that was sent out, but the platform will attribute more revenue to the SMS." — Verified user, 4/5, Triple Whale - G2 Verified Review, April 2023
"Sometimes it does not update the numbers correctly and has errors with synchronisation." — Verified user, 3/5, Triple Whale - G2 Verified Review, April 2023
"80 sessions 10 add to cart and 8 initiated to checkout but 0 conversions (and 1 add payment). I don't understand why im getting this and i have tried checking out myself and it perfectly works fine." — u/elcarOehT, r/shopify Reddit Thread, August 2022
That last post is the whole problem in four lines. Healthy cart and checkout rates, zero purchases, and no way to tell whether it is bots, region settings, or a payment method. Operators comparing Triple Whale alternatives usually start from exactly this confusion.
❌ What benchmarks cannot do
They cannot tell you whether your own number moved. A 42% cart step is fine for a $38 AOV impulse catalogue and alarming for a $180 considered purchase.
A one-second load delay can cut conversions by about 7%, which is enough to move a stage rate without any benchmark ever flagging it.
Luca AI tracks each stage against your store's own history and flags the deviation with the correlated components attached, so you see which step moved and what moved alongside it, closer to ecommerce monitoring tools than to a static report. Benchmarks place you on a scale. The pattern break is what you act on.
Q5. Why does your funnel look healthy in Meta and broken in your bank account? [toc=5. Margin Over ROAS]
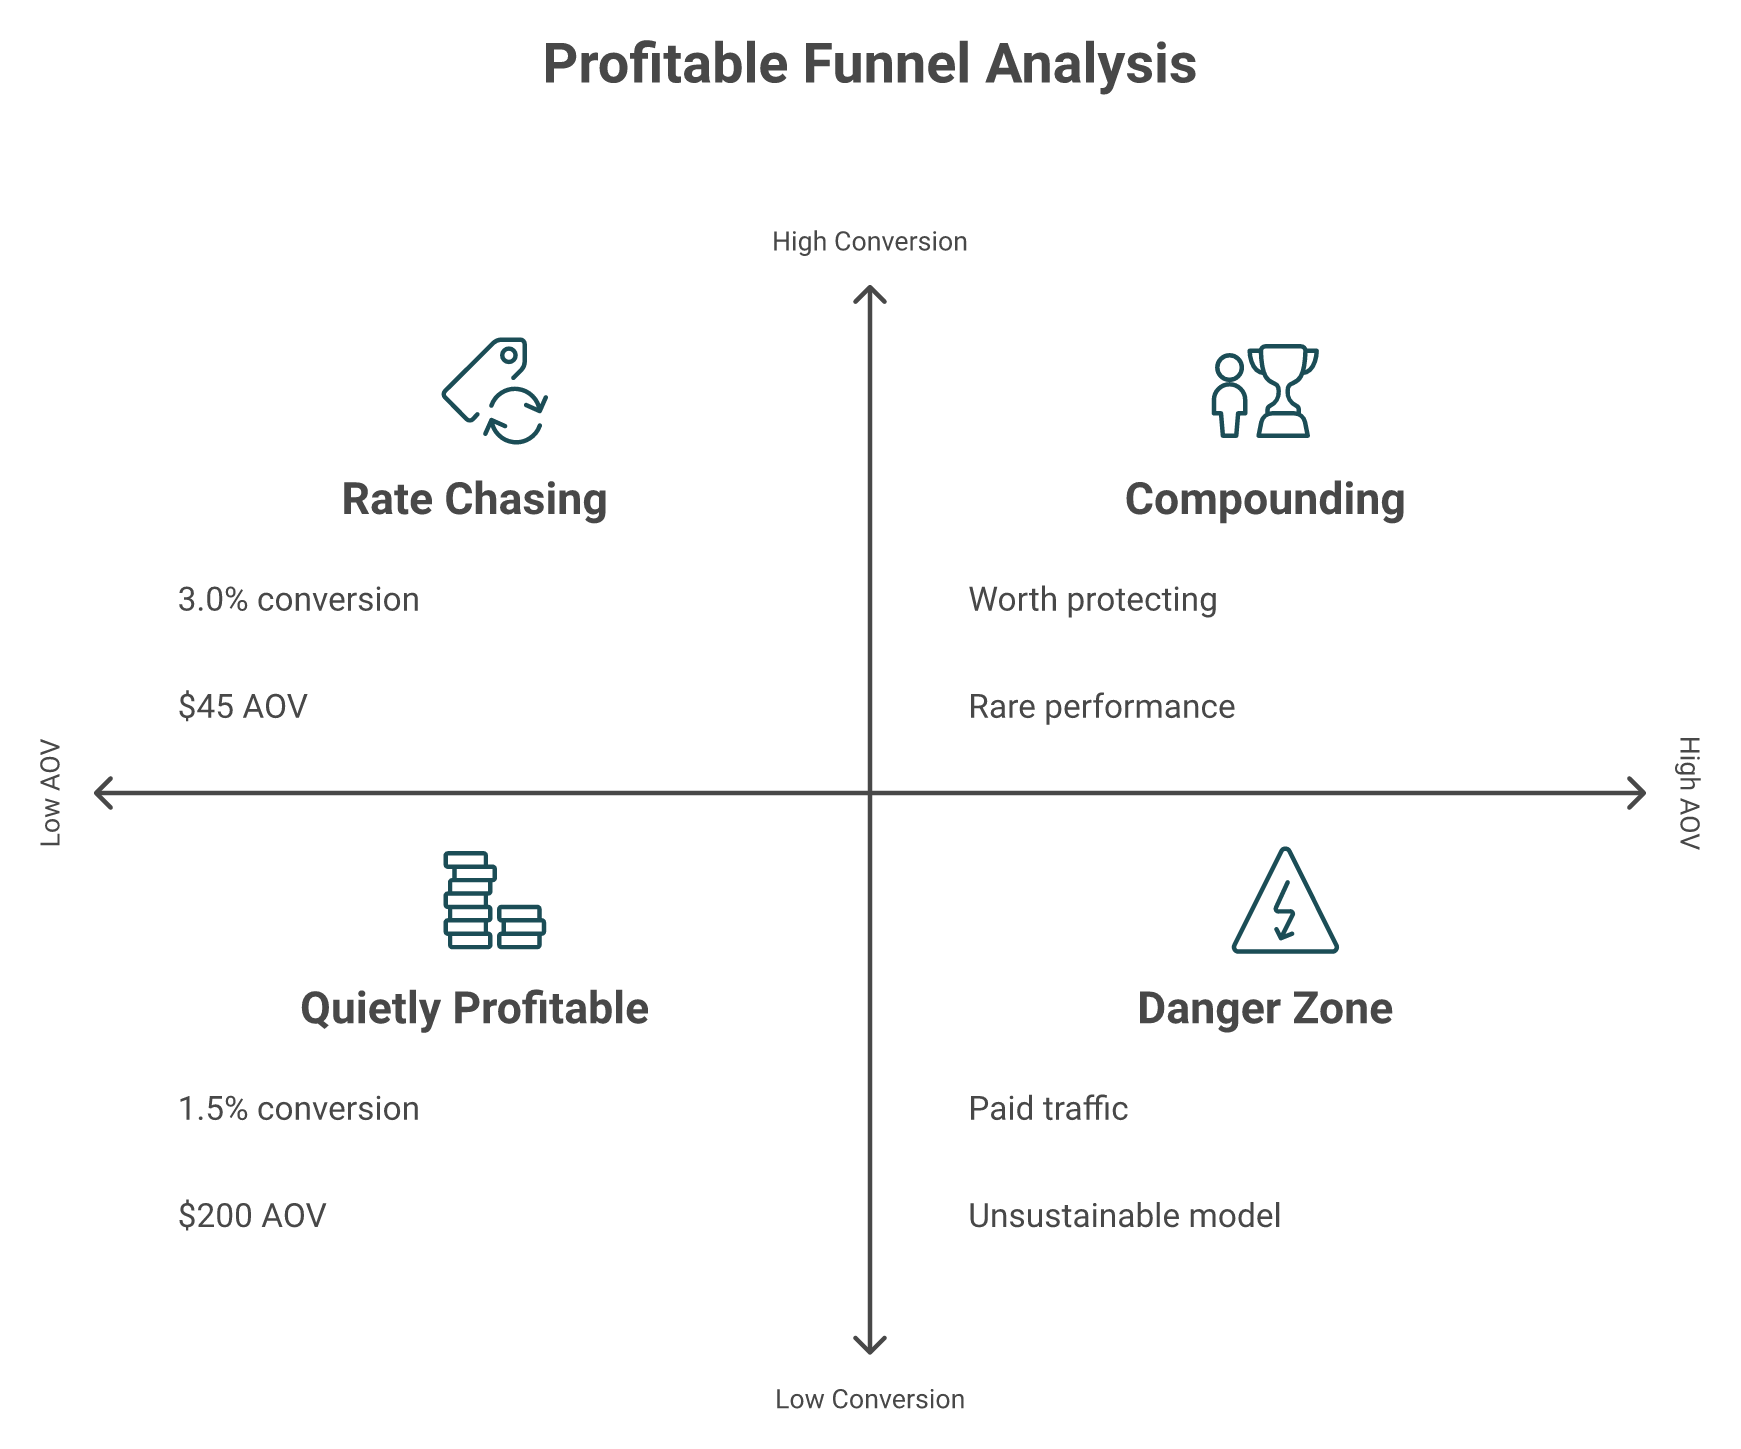
Meta attributes conversions to itself even when other touchpoints did the work, and GA4 defaults to last click. A funnel built on platform-reported numbers double counts the top and flatters the middle. Judge funnel health on contribution margin per order and blended new-customer CAC instead. A 1.5% conversion rate at $200 AOV beats 3.0% at $45 AOV on every line that matters. Luca AI reads funnel steps against order-level margin from connected Shopify, ad platform, and accounting data, so a stage improvement and a profit improvement are checked in the same question.
💸 The scene every operator recognises
A head of growth shows me a Meta dashboard with 4.1x ROAS. Finance shows me a month that lost money. Both are reading real numbers.
Nothing in that stack reasons across the two. The founder becomes the integration layer, pasting figures into a sheet on Sunday night, which is exactly the gap declining platform ROAS versus true profitability covers in detail.
"I love how seamlessly it connects our ad platforms and CRM data, showing exactly where our conversions come from. Occasionally, metrics between sources need a quick manual check to ensure alignment." — Verified user, 5/5, Triple Whale - G2 Verified Review, October 2025
"It often isn't close to accurate for conversion rate, number of orders, or revenue." — Verified user in Information Technology and Services, 1.5/5, Google Analytics - G2 Verified Review, May 2019
That second quote is the honest version of this category. Even satisfied users budget time for manual reconciliation, which is why so many teams end up auditing their ecommerce analytics platforms twice a year.
✅ What changed
Dashboards showed you numbers and stopped. Agentic AI can now hold the whole dataset in context, compare a stage rate to the margin behind it, and explain the gap.
The shift is not prettier charts. It is that the reasoning step moved out of your spreadsheet, which is the premise behind agentic BI.
💰 The two numbers to pin beside every step
Stage rates alone mislead. Pin contribution margin per order and blended new-customer CAC beside every funnel step before approving a fix.
Luca AI's read is that the standard funnel advice gets this backwards. It optimises the rate and assumes the profit follows.
Contribution margin per order: revenue minus COGS, shipping, payment fees, and ad cost.
Blended new-customer CAC: total spend divided by new customers, not platform-claimed CAC.
Run a 10% discount to lift checkout completion and both numbers can fall while your funnel chart improves. I have watched that trade get approved more than once because nobody checked the second line, which is the whole argument in contribution margin versus gross margin.
⚠️ One honest limit
Luca AI is not an attribution tool, and it will not settle whether email or SMS deserves a given order. That dispute needs a pixel or an incrementality test.
What Luca AI does is cross-functional reasoning over the ingested data. Ask why checkout conversion rose while operating profit fell, and the intelligence layer traces the discount, the shipping promo, and the channel mix that moved with it. GA4 reviewers describe the same month as "really difficult to trust 100%".
"It is becoming very opaque, it doesn't have real-time, the sampling is increasingly wild, and now it applies a threshold. To make decisions based on grounded data, it is really difficult to trust it 100% and it complicates decision-making." — Verified user in Retail, 1.5/5, Google Analytics - G2 Verified Review, February 2024
Luca AI connects Shopify, Meta, Google, and your accounting data, then answers funnel questions with margin attached. The analysis and the recommended next step come from us; the decision and the execution stay with you. A dashboard's output ends at a chart. Ours ends at a reasoned next move.
Q6. How do you find the why behind a drop-off, not just the where? [toc=6. Diagnosing Drop-Offs]
Segment before you theorise. Split the leaking step by device, traffic source, and new versus returning, because a blended drop-off usually resolves into one segment breaking. Then measure friction on that step: form field count, load time, and when total cost first appears. Baymard's survey work puts extra costs at 48% of abandonment reasons and forced account creation at 26%. Luca AI performs this segmentation on request across connected Shopify and ad-platform data, returning the segment, the correlated variables, and the size of the loss.
🔍 Step one is always segmentation
A six-point drop at the cart step is rarely a six-point drop everywhere. It is usually a twenty-point drop in one slice, averaged into something that looks mild.
Ask Luca AI which segment drove the decline and the intelligence layer isolates the slice instead of making you build four comparison reports. That is the part that used to cost a junior analyst a full afternoon, and it is the core use case behind customer segmentation in ecommerce.
🧰 The old way of getting this answer
Default reports used to carry you most of the way. Then they did not.
"Almost all of the super popular, easy-to-use, out-of-the-box reports now have to be manually created." — Verified user in Computer Software, 2/5, Google Analytics - G2 Verified Review, December 2022
I think that review explains half the funnel confusion I see. Operators are not lazy. They are being asked to build reporting infrastructure before they can ask a question, which is the problem self-service analytics tools were supposed to solve.
📉 Three friction checks on the broken step
Once the segment is named, the diagnosis gets physical.
Time the page on a real phone. Roughly a 7% conversion loss per added second is the working figure.
Find the moment total cost appears. Late shipping costs are the single most cited abandonment reason.
Luca AI will not watch a session recording for you. It narrows where to watch, which is the expensive part of the work.
😵 The confusion tax
Most drop-off is not a broken button. It is a shopper who cannot answer "what is this, why does it help me, how do I get it" without effort.
When a visitor has to burn thinking energy on a product page, they leave and blame nothing. Store owners read that as a tracking problem. Operator threads are full of the same confusion from the other side, and better customer behavior analytics is usually the cheaper answer.
"Hello everyone, I'm experiencing an issue where customers are adding items to their cart and clicking check out, but there are 0 sales." — u/elcarOehT, r/shopify Reddit Thread, March 2019
✅ The diagnosis sequence, in order
Name the step with the largest dollar loss, not the worst percentage.
Segment it by device, source, and customer type.
Check field count, speed, and cost visibility on that segment.
Watch ten session recordings of that exact path.
Write one sentence stating the suspected cause before you touch anything.
Luca AI handles the first three with a plain-English question against the connected dataset, including the correlated metrics that moved alongside the drop. We do the analysis and outline the likely cause; you still watch the recordings and decide the fix. That split has been the reliable one in my experience.
Q7. Which funnel fix should you run first at your traffic level? [toc=7. Fix Order by Stage]
Funnel analysis is the diagnosis, and conversion rate optimization is the treatment. Below roughly 10,000 monthly sessions, skip A/B testing entirely, because the test will not reach significance before the season turns. Fix the deterministic items first: mobile load under two seconds, a sticky add-to-cart button, total cost shown before the cart, a comparison table on the product page, and checkout fields cut from 23 toward 14. Luca AI ranks funnel steps by revenue at risk using connected Shopify and ad data, so the fix order comes from your own numbers.
🚦 The stage gate
Funnel Fix Priority by Monthly Session Volume
Monthly sessions
Run this
Skip this
Under 10,000
Speed, mobile layout, cost transparency, offer clarity
A/B tests, personalization engines
10,000 to 50,000
One test at a time on the worst step, plus all of the above
Multivariate tests, full-site redesigns
50,000 and up
Structured testing program with a roadmap
Guessing, and copying enterprise playbooks
A small store with a $2,000 monthly marketing budget cannot justify $1,000 a month on testing software. That math has not changed, and no AI layer fixes it.
❌ Buying tooling before you can feed it
Tools get bought to avoid a decision. Then the data problem arrives anyway.
"We were hoping to automate our suite of 25+ clients reporting, but unfortunately, it has caused more of a headache than it has provided any substantial value." — Verified user, 0/5, Supermetrics - G2 Verified Review, November 2021
I am not using those to dunk on anyone. They are the predictable result of buying a reporting layer before the underlying question is clear, a pattern that shows up constantly when operators compare Polar Analytics alternatives.
💰 Order the fixes by money, not by effort
Rank every candidate fix by people lost at the step multiplied by AOV and margin. Then divide by days to ship.
Luca AI produces that ranking from the ingested data, including which steps are already well optimised so you stop spending attention there. In my experience, that second half saves more time than the first.
A comparison table against the real alternative on the product page.
Checkout fields reduced toward 14.
None of these need statistical significance. They are known losses, and operators ask about them constantly, as in this r/ecommerce Reddit Thread on improving add-to-cart conversion from February 2020.
⚠️ Where I would hedge
Luca AI's data points toward offer clarity beating checkout mechanics at the sub-$1M stage, though I might be reading that too strongly. The sample of small stores skews toward Meta-led traffic.
Luca AI is also the wrong purchase for a store with a few hundred daily visitors. There is not enough history to reason against yet, and saying otherwise would waste your money. At that stage, a simpler ecommerce tech stack beats another subscription.
Luca AI ranks the steps, quantifies the loss, and outlines the sequence. The operator ships it. That boundary is deliberate, because nothing writes to your live store but you.
Q8. How often should you check the funnel, and what watches it when you are not? [toc=8. Cadence and Alerts]
Review the full funnel monthly, check the two steps you are actively fixing weekly, and alert on everything else continuously. Manual review finds a broken checkout days late. On a $200,000-a-month store, a week of spend behind a dead step costs more than any tool in this category. Luca AI scans connected Shopify, Meta, Google, and Klaviyo data on an ongoing basis and pushes alerts to Slack, email, or the mobile app when a stage rate, ROAS, or CAC moves outside the store's learned pattern.
⏰ The cadence, stated plainly
Daily: nothing, unless an alert fires.
Weekly: the two steps under active repair, plus spend.
Monthly: the full funnel, segmented by device and source.
Quarterly: step definitions, event health, and benchmark comparison.
That is it. I have never seen a daily funnel review change a decision that an alert would not have caught earlier, which is why ecommerce monitoring tools beat a standing meeting.
❌ Why the Sunday-night ritual fails
The old pattern was a dashboard per tool and a founder stitching them together by hand. The newer pattern is worse in one specific way. Automated reports arrive, and nobody acts on them.
A founder told me he was receiving around twenty executive summaries, each roughly twenty-five pages, covering email, ads, analytics, and AOV. His reaction was the honest one. All that intel, and no idea what to actually do with it. That failure mode is the reason automated data reporting in ecommerce has to end in a recommendation.
⚠️ Alerts are only as good as the pipe
An alert on broken data is worse than no alert. It trains you to ignore the channel.
"The syncing of data is not very reliable. Even though it's the same format but a different date." — Verified user, 1.5/5, Supermetrics - G2 Verified Review, November 2021
"Sometimes it does not update the numbers correctly and has errors with synchronisation." — Verified user, 3/5, Triple Whale - G2 Verified Review, April 2023
Luca AI normalises and standardises data on ingestion for this reason. An anomaly alert is only trustworthy when one session means one thing across every source, which is the whole point of real ecommerce data management.
🔔 The four thresholds worth setting first
Add-to-cart to begin-checkout rate, alert on a 15% relative drop week over week.
Begin-checkout to purchase rate, same threshold.
Blended new-customer CAC, alert on a 20% rise.
Mobile conversion rate, tracked separately from desktop.
Ask Luca AI to monitor each of these and it watches continuously, then reports the deviation with the reasoning and the correlated metrics attached. That is the difference between catching a break on the second of the month and the twenty-ninth.
✅ What changed, and what did not
Tools used to show you data and wait. Luca AI's agentic layer keeps the context, studies the pattern across months, and tells you what moved and what to look at next.
What did not change is ownership. Luca AI does the analysis and outlines the steps. We never write to your live store, and the call stays yours.
Luca AI replaces the junior analyst shift, not the operator. Connect the sources once, set the thresholds, and the monitoring runs while you work on the product. The output is reasoning and a next step, not another twenty-five-page summary.
Q9. Funnel analysis vs cohort analysis vs customer journey analytics: which answers which question? [toc=9. Funnel vs Cohort]
Funnel analysis measures one process inside a time window and answers where people drop off. Cohort analysis follows one group of people over time and answers whether a change held. Customer journey analytics maps how someone interacts with a brand beyond click-level touchpoints. Use the funnel to find the leak, the cohort to prove the repair, and journey analytics when the purchase takes months instead of minutes. Luca AI runs funnel, cohort, and root-cause analysis over the same connected Shopify, ad platform, and email data, so the three questions are asked in one place.
🧭 The one-line split
Funnel Analysis vs Cohort Analysis vs Journey Analytics
Method
Unit of measurement
Question it answers
Funnel analysis
Sessions in a date range
Which step loses the most people and money
Cohort analysis
A group of people over time
Did the fix hold, and do these customers come back
Journey analytics
One customer across channels
What path did this person actually take
The unit column is the part operators miss. A funnel counts sessions, while a cohort counts humans, so the two will never reconcile by design. That distinction sits underneath most ecommerce customer journey analytics confusion.
⚠️ Why the session unit matters
"Sessions are a vague statistic that do not help define the quality or quantity of your web traffic. Far too often, people rely on the free version as a main hub for their website traffic reporting. It's a mistake." — Verified user in Marketing and Advertising, 0.5/5, Google Analytics - G2 Verified Review, August 2018
That reviewer is harsh, and partly right. Sessions are fine for comparing steps against each other. They are poor for asking whether a customer came back, which is the job of ecommerce customer analytics.
🔁 Where the funnel goes blind
Subscription and repeat-purchase brands break this clearly. The checkout funnel can look excellent while churn eats the business one renewal later, which is why customer churn analysis belongs beside the funnel.
Brez, the functional beverage brand, found a danger zone a few weeks after the second renewal. A giveaway for anyone staying subscribed past day 27 moved churn from 24% down to 17%. No funnel chart would have found that, because the funnel ends at purchase.
✅ Using them as a loop
Run them in sequence, not in parallel. The funnel finds the step, you ship a fix, then the cohort tells you whether the people who came through the fixed step behaved differently.
Funnel: cart step converts at 38%, worst in six months.
Fix: shipping cost surfaced before the cart.
Cohort: April buyers versus May buyers, repeat rate and AOV at day 60.
Ask Luca AI for the before-and-after cohort on the segment that moved, and the intelligence layer builds the comparison from the ingested data. Cohort-level vigilance, without building a cohort dashboard first. That is the same reasoning behind proper ecommerce customer segmentation.
🕰️ When journey analytics earns its place
Slow buyers are real. Some shoppers take three to six months to decide, especially on considered purchases above $300.
For those brands, click-level attribution is not journey tracking. It is campaign math. Operators asking why their cart abandonment looks broken, like this r/ecommerce Reddit Thread from December 2023, are often looking at a long consideration cycle rather than a leak.
My read is that most sub-$5M stores need the funnel and the cohort, and can skip journey analytics for another year. Luca AI's data leans that way, though the sample is weighted toward Meta-led brands.
Luca AI holds all three analyses against one normalised dataset, so the question "did my fix hold" does not require a second tool or a new report build. The reasoning and the next step come from us. The decision stays with the operator.
Q10. Which tools do funnel analysis for an ecommerce store, and where does each one break? [toc=10. Tools Compared]
Five categories cover ecommerce funnel analysis. Luca AI is an AI layer over a connected data warehouse that answers funnel questions in plain English across Shopify, Meta, Google, Klaviyo, and accounting sources, then pushes alerts when a stage rate moves. GA4 is free and workable for stage counts. Mixpanel and Amplitude are strong and built for apps. Shopify's native reports are the fastest to open and the shallowest. A BI stack like Power BI gives full control plus a build project and an analyst.
Not an attribution pixel, needs enough history to reason against
Stores with a few hundred daily visits, enterprises with data teams
GA4
Free stage counts, traffic sources
Sampling, thresholds, manual report building
Operators who need order-accurate revenue
Mixpanel / Amplitude
Event-level product funnels, conversion windows
App-shaped, weak on margin and inventory
Stores wanting profit in the same view
Shopify analytics
Instant four-step view, zero setup
No cross-channel context, no root cause
Anyone past the first diagnosis
Power BI / Tableau
Total control, any model you want
SQL, modelling, maintenance, an analyst
Teams without a data hire
❌ The reporting-layer tax
Connector tools promise automation and deliver maintenance. That is the recurring complaint in this category, and it drives most searches for Supermetrics alternatives for ecommerce.
"They're very slow to update their existing connectors. As a result, they're missing lots of features and updates within their connectors." — Verified user, 1.5/5, Supermetrics - G2 Verified Review, April 2024
"The company is so lazy in their use of AI that Faizan J will use Mike S's email to send a pitch email to you addressing it to Mike, which isn't my name. If that is their modus operandi, how can you trust their results?" — Matthew Wong, Verified reviewer, Polar Analytics - TrustPilot Verified Review, May 2025
I include the second one because trust in this category is earned on small things. Operators notice sloppiness before they notice features, which is worth remembering while shortlisting Shopify analytics apps.
✅ What actually changed
The old stack was a dashboard per tool, plus a Sunday spreadsheet, plus a junior analyst to explain the gaps. The output always stopped at a chart.
Luca AI's data layer connects the sources and normalises them on ingestion, so the cleanup year disappears. The intelligence layer then answers the funnel question, names the likely cause, and outlines the next step, which is what separates an AI-native data platform from a reporting tool.
💰 How to choose in one pass
Need free stage counts only? Use GA4 and accept the sampling.
Need funnel plus margin plus alerts, with no analyst? Luca AI.
Need custom modelling and have a data hire? Power BI or Tableau.
Need attribution settled? Buy an attribution tool, not an analytics layer.
⚠️ Where Luca AI is the wrong answer
Luca AI is not a fit for marketplace-only sellers, pure B2B catalogues, or stores below meaningful data volume. There is nothing to reason against yet, and the honest advice at that stage is to fix the deterministic items first.
Luca AI replaces the junior analyst shift, not the operator. Connect the sources once, ask the funnel question in plain English, and the answer arrives with the reasoning and a recommended step attached, the way an AI data analyst for ecommerce should work. The monitoring then runs continuously. Nothing writes to your live store, and the decision stays yours.
FAQ's
What is funnel analysis, and why is it better than tracking conversion rate alone?
Funnel analysis measures how many people complete each step in a fixed sequence toward a goal. For a store, that sequence is usually session, product view, add to cart, begin checkout, payment info added, and purchase.
A conversion rate reports one outcome. Funnel analysis reports the economics of every transition, which is what makes it actionable.
Conversion rate says: 2.1% of sessions bought this month.
Funnel analysis says: 58% of the people who added to cart never even started checkout.
Those are two different problems that need two different fixes.
A blended conversion rate is an average of four separate machines. One step can fall hard while another rises, and the final number barely twitches. That is how an operator can look at a steady 2% for three months while a specific stage quietly bleeds ad spend.
Luca AI reads these step rates off the same connected dataset as your Shopify, Meta, Google, and Klaviyo numbers, so the leaking step and the money spent to fill it sit in one place. We built it that way because the question "which step is losing money" always turns into "and what did we pay for that traffic." If you want the broader metric picture first, start with our breakdown of the top ecommerce KPIs worth tracking weekly.
How do you run a funnel analysis on a Shopify store step by step?
Eight steps cover it, and the order matters more than the tooling.
Pick one macro outcome, usually a paid order.
Set a conversion window, then write it down and leave it alone.
Map four to seven steps where each one implies a different fix.
Instrument the standard events: view_item, add_to_cart, begin_checkout, and purchase.
Pull purchase counts from your order or payment system, never from a browser tag.
Calculate both the step rate and the cumulative rate for every stage.
Segment by device, traffic source, and new versus returning.
Fix the costliest step, then re-measure with identical settings.
Step five is the one most operators skip. Client-side tags undercount because of ad blockers and consent banners, so your analytics tool and your Shopify order list will never agree.
Record the absolute number of people lost at each step beside the percentage. A four-point drop on a wide step is worth more than a twenty-point drop on a narrow one, and multiplying lost people by AOV and margin is what gets a fix approved.
Luca AI normalises and standardises data on ingestion across connected sources, so one session means one thing everywhere before you start comparing stages. Clean ecommerce data integration is what makes the rest of this reliable.
What is a good funnel conversion rate for an ecommerce store?
There is no universal number, and chasing a blended benchmark is how stores end up discounting their way to worse margins.
Useful 2026 reference points by stage:
Session to purchase: roughly 1.58% to 3%, with strong performers above 5%.
Product view to add to cart: about 6% to 7.5%.
Add to cart to begin checkout: around 42% across a dataset of 958 Shopify stores.
Begin checkout to purchase: 45% to 57% when the checkout is optimised.
Overall cart abandonment: 70.22% to 76.04%, depending entirely on how it is measured.
Category spread matters more than the average. Conversion runs from roughly 0.9% in jewelry to 3.7% in food and beverage, so only a vertical comparison is fair. Device matters too, since mobile abandonment runs near 85.65% against 73.07% on desktop.
The more useful question is whether your own number moved. A 42% cart step is healthy for a $38 AOV impulse catalogue and alarming for a $180 considered purchase.
Luca AI compares each stage against your store's own twelve-month pattern and flags the deviation with the correlated components attached. Benchmarks place you on a scale; the pattern break is what you act on. For margin context behind those rates, see our guide to ecommerce profit margins.
What is the difference between funnel analysis, cohort analysis, and customer journey analytics?
They answer three different questions, and the unit of measurement is what separates them.
Funnel analysis measures one process inside a time window, counted in sessions, and answers where people drop off.
Cohort analysis follows one group of people over time, counted in humans, and answers whether your fix held and whether those customers came back.
Customer journey analytics maps how one person interacts with your brand across channels, and earns its place when the purchase takes months rather than minutes.
Because a funnel counts sessions and a cohort counts people, the two will never reconcile. That is by design, not a tracking bug.
Run them as a loop rather than in parallel. The funnel finds the step, you ship the fix, then the cohort proves whether the people who came through the repaired step behaved differently at day 60.
Subscription brands show the limit most clearly. A checkout funnel can look excellent while churn eats the business one renewal later, because the funnel ends at purchase.
Luca AI runs funnel, cohort, and root-cause analysis over the same normalised dataset, so proving a fix held does not require a second tool or a new report build. Pair this with our work on ecommerce customer journey analytics when your consideration cycle runs long.
Which funnel fix should you run first, and when is A/B testing a waste of money?
Funnel analysis is the diagnosis. Conversion rate optimization is the treatment. Sequence them by traffic volume, not by enthusiasm.
Below roughly 10,000 monthly sessions, skip A/B testing entirely. A test will not reach significance before the season turns, and a $1,000-a-month testing program on a $2,000 marketing budget is a bad trade.
Fix the deterministic items first, in this order:
Mobile page load under two seconds, since mobile is about 72% of traffic.
Shipping and tax visible before the cart step, because extra costs drive 48% of abandonment.
Guest checkout enabled and forced account creation removed.
A sticky add-to-cart button on mobile product pages.
Checkout fields cut from an average 23.48 elements toward 14.
A comparison table against the real alternative on the product page.
None of these need statistical significance. They are known losses with known fixes.
Rank the remaining candidates by people lost at the step multiplied by AOV and margin, then divide by days to ship. Luca AI produces that ranking from the ingested data, including which steps are already well optimised so you stop spending attention there. We outline the sequence; the operator decides and ships it. For the spend side of that decision, read our view on declining platform ROAS versus true profitability.
Enjoyed the read? Join our team for a quick 15-minute chat — no pitch, just a real conversation on how we’re rethinking Ecommerce with AI - Luca
Loading Schedule...
Your AI Co-Founder is here.
Here’s why:
Shopify, Meta, Xero - one brain.
"Should I scale?" Answered with real data.
Growth capital. No applications. One click.
Thank you! Your submission has been received! Please book a time slot for the Meeting
Oops! Something went wrong while submitting the form.