Marketing Mix Modeling for E-commerce: Budget, ROAS and Predictive Audiences
13
mins read
TL;DR
Marketing mix modeling uses two to three years of weekly sales and spend to estimate what each channel adds above baseline sales.
Move budget by marginal return, not average ROAS; a channel averaging 3.0x can return 1.2x on its next $5,000.
Use attribution for daily optimization, MMM for budget, and holdout tests to calibrate both, since platforms double count sales.
Not ready for MMM? Track weekly MER and aMER, run one holdout a quarter, and start a promotions and stockout log.
Meridian and Robyn are free, but the analyst hours are not; calibrate any platform-built model with your own tests.
GA4 predictive audiences need 1,000 purchasers and 1,000 non-purchasers; below that, build segments from order history instead.
It is Monday morning, and the founder of a Shopify skincare brand has three numbers open. Meta Ads Manager says last month's campaigns drove $210,000 in purchases. Google Ads claims another $95,000. Shopify shows $250,000 in total sales, including email, organic, and repeat customers. The CFO asks one plain question: if we add $10,000 to ads next month, where should it go?
Nobody in the room can answer it with confidence. That gap is what marketing mix modeling exists to close. Marketing mix modeling (MMM) uses your weekly sales and spend history to estimate what each channel truly adds, so budget follows real return instead of platform claims. Read the bigger picture of predictive analytics for e-commerce first if you want the full map. This guide stays on the budget question and on the customers that budget should reach.
What is marketing mix modeling, and what does it actually tell an e-commerce store?
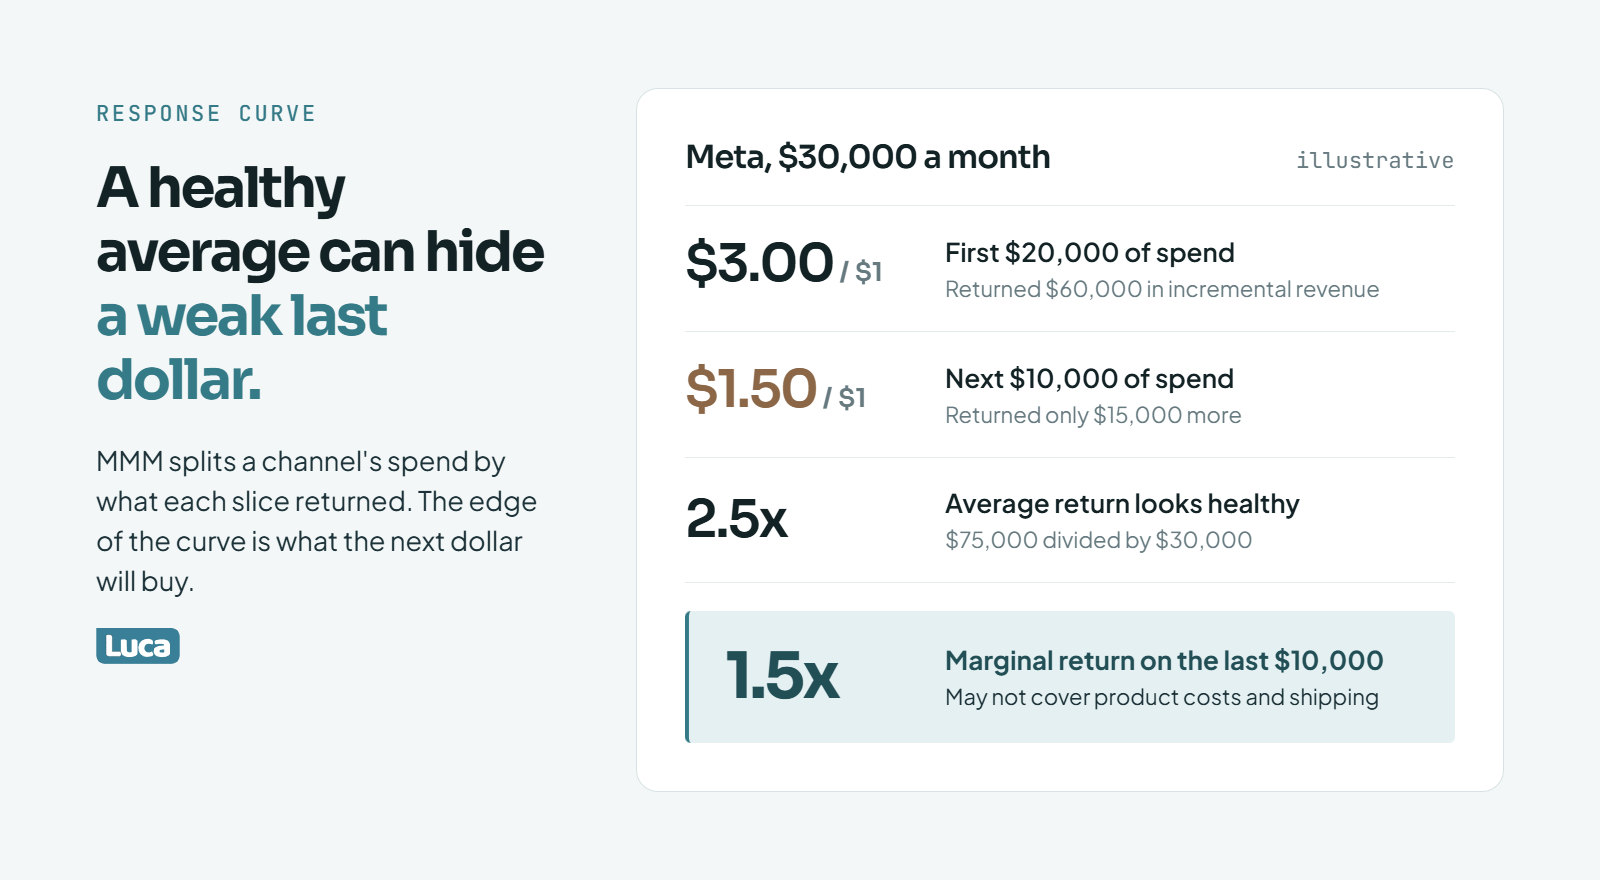
A healthy average return can hide a last $10,000 that barely covers product costs and shipping.
Marketing mix modeling is a statistical method that reads two to three years of weekly sales and marketing spend. It estimates how much revenue each channel adds above baseline sales, meaning the sales you would get with no ads at all. For an online store, the output is a response curve per channel. That curve shows what the last dollar returned and what the next dollar will probably return. MMM answers budget questions, not "who clicked what" questions.
🧮 Baseline, carryover, and saturation in plain words
Every MMM splits your revenue into two piles. The first is baseline: repeat buyers, organic search, word of mouth, and brand demand that would show up anyway. The second is incremental revenue, the extra sales each channel caused on top of that baseline.
Two ideas shape how the model reads ads. Adstock (or carryover) means an ad keeps working after the week you paid for it, so a YouTube push in March still nudges April sales. Saturation means each extra dollar buys a little less than the one before, because you start reaching the same people again.
📈 What a response curve looks like for a store
Here is an illustrative example, not real client data. Picture the skincare brand spending $30,000 a month on Meta. The model estimates the first $20,000 returned $60,000 in incremental revenue, which is $3.00 per dollar. The next $10,000 returned only $15,000 more, which is $1.50 per dollar.
The average return across all $30,000 is $75,000 divided by $30,000, or 2.5x. That average looks healthy. The marginal return on the last $10,000, at 1.5x, may not cover product costs and shipping. That single gap is the most useful thing MMM tells a store.
⚠️ What MMM cannot tell you
MMM works on weekly totals, so it never sees individual customers. It cannot say which ad a buyer clicked or which creative won on Tuesday. It also needs history, so a channel you launched last month barely registers. Shopify's own guide notes MMM generally needs two to three years of weekly data with real variation in spend (Shopify).
💡 Why I read MMM as a finance tool
Luca AI's view is that MMM is a finance tool wearing a marketing name. A response curve means little until you hold it against contribution margin, which is revenue left after product, shipping, and ad costs. Nick Shackelford put the operator version bluntly: "CTR and ROAS are meaningless. Your marketing has to marry finance as well as forecasting". I agree with him. A 2.5x average that hides a 1.5x margin-losing tail is how profitable-looking months empty the bank account.
How is MMM different from e-commerce attribution and incrementality testing?
E-commerce attribution assigns credit for individual orders using tracked clicks, so it breaks when tracking breaks and often double counts across platforms. MMM uses aggregate weekly data, so it survives tracking loss but answers slowly. Incrementality tests switch spend off for a holdout group and measure the drop, which is the closest thing to proof. Use attribution for daily optimization, MMM for budget, and tests to calibrate both.
🔍 The double-count problem in your own dashboards
Add up what Meta, Google, and TikTok each say they sold. At most stores, that total is higher than Shopify revenue. Each platform credits itself for any order its pixel touched, so one customer can be "sold" three times. Shero Commerce frames this exact mismatch as the signal that you need MMM (Shero Commerce).
The opposite failure also happens. One Shopify store owner on The Ecom Zone found Meta tracked only about 20% of the sales Shopify recorded. In their words, they were "in the dark winging it almost". Over-counting and under-counting both come from the same root: pixel-based attribution sees clicks, not causes.
📊 Which method answers which question
Which measurement method answers which question
Method
Data it uses
Question it answers
Speed
Blind spot
Platform attribution
Pixel clicks and views
Which ad or campaign got the order
Daily
Double counts, breaks with privacy limits
Multi-touch attribution (MTA)
Tracked touchpoints per user
How credit splits across clicks
Daily
Misses untracked channels and views
Marketing mix modeling
Weekly spend and sales totals
Where the next dollar should go
Monthly or quarterly
No user-level detail, needs history
Incrementality test
Holdout vs exposed group
Did this channel cause sales
Two to six weeks per test
Tests one thing at a time
Luca AI
All connected sources, normalized
Why the numbers disagree and what changed
Continuous
Not a pixel, does not track clicks
Kunle Campbell makes a point most attribution vendors skip: MTA "is not customer-centric, and it is not customer-journey tracking". It tracks what people click and assigns credit mathematically.
🧪 How to run a simple holdout test
Pick one channel and two comparable groups of regions, or two matched time periods.
Turn that channel off, or cut it sharply, in one group for two to four weeks.
Compare total Shopify sales in both groups, not platform-reported sales.
The drop in the paused group is that channel's incremental lift.
"Atributtion is the most helpful thing, I can see big differences between what Triple Whale says an ad sold and what Meta says... on the dashboard I get overestimated sales and ROAS." Verified User, Triple Whale - G2 Verified Review, April 20, 2023, rated 4/5
"Some data we still notice discrepancies between platforms, for example, tracking ads, and differences in the reported metrics like revenue." Verified User, Triple Whale - G2 Verified Review, April 20, 2023, rated 4/5
"The attribution system is consistently buggy and unreliable, causing more harm than good." Verified User, Triple Whale - G2 Verified Review, September 27, 2025, rated 0/5
Do you have enough data for marketing mix modeling yet?
You are ready for MMM when you have about two years of weekly sales and spend data. You also need at least three channels with meaningful spend, and weeks where spend moved independently of seasonality. If spend never varied, the model cannot separate your channels from Black Friday. Below that bar, track blended MER weekly, run one holdout test each quarter, and start logging promotions now.
📋 The readiness checklist
Score yourself honestly on each line:
✅ Weekly sales: at least 104 weeks of revenue and orders, ideally split by new and returning customers.
✅ Spend by channel: weekly spend for Meta, Google, TikTok, email, affiliates, and any offline activity.
✅ Promotions log: dates and depth of every sale, bundle, or free-shipping push.
✅ Price changes: when list prices moved and by how much.
✅ Stockouts: weeks your best sellers were unavailable.
✅ Seasonality markers: holidays, launches, and any viral moment.
Shopify's guide sets the same bar of two to three years of weekly data (Shopify). Sellforte adds campaign-level impressions and clicks as useful inputs (Sellforte).
⚠️ The spend-variation trap
This is where most stores fail without knowing it. If you raised Meta and Google together every November and cut both every January, the model sees two lines moving in lockstep. It cannot tell which one drove sales, and it cannot separate either from holiday demand.
The fix is deliberate. Vary spend by channel on purpose, in some weeks that are not peak season. Even a few months of planned variation make the next model far more useful.
🛟 What to do if you are not ready
Do not buy an MMM tool yet. Kunle Campbell's case for MER fits this stage: unlike ROAS, it "takes into account long lead times and repeat purchases," and "in a cookieless world... MER a more consistent choice". Common Thread Collective goes one step further with aMER, which is first-time customer revenue divided by total ad spend (Common Thread Collective).
Start the promotions log today, because MMM will need it later.
💡 My honest read
Luca AI sees this mistake often in its work with operators. Stores push into expensive attribution or MMM before they have clean UTMs or a weekly MER line. I could be wrong for some categories, but I would fix the basics first.
✅ Where Luca AI fits
Luca AI can answer "how much did weekly spend per channel actually vary over the last 24 months?" in plain English. That is the readiness question most stores never check. Luca AI pulls it from connected Shopify and ad accounts, so you know whether a model will be worth running.
Can you run MMM with free tools like Google Meridian and Meta Robyn?
Yes, if someone on your team writes Python or R. Google Meridian is a Bayesian model that can work at geographic level. Meta Robyn uses ridge regression with automated tuning. Both are free and documented. The real cost is people: data prep, model tuning, and explaining output to finance. Calibrate either one with holdout tests, because each is built by a platform you buy ads from.
🧰 How the free options compare
Free open-source MMM tools compared
Tool
Built by
Approach
Language
Best fit
Meridian
Google
Bayesian, geo-level, accepts prior test results
Python
Teams with a data scientist and regional sales data
Robyn
Meta
Ridge regression with automated hyperparameter search
R (Python beta)
Teams comfortable in R who want fast iterations
PyMC-Marketing
PyMC Labs community
Bayesian, highly customizable
Python
Analysts who want full control
Shopify's guide points merchants to Meridian and Robyn as the open-source starting points (Shopify).
💸 The code is free, the hours are not
MarTech summed up the trade-off in one headline: open source made MMM cheaper, not easier (MarTech). You still need clean weekly data, sensible priors, and someone to judge whether a curve makes sense. Forrester notes Meridian's materials are not executive-friendly, so someone must translate output for a CFO (Forrester).
"If you don't pay for BigQuery, you're really tied hand and foot." Verified User in Retail, Google Analytics - G2 Verified Review, February 14, 2024, rated 1.5/5
"Power BI can become slow with very large datasets, and complex DAX formulas have a steep learning curve." Verified User, Microsoft Power BI - G2 Verified Review, December 18, 2025, rated 5/5
⚖️ Grading their own homework
AdExchanger raised the uncomfortable question directly: are platform-built models a gift or a Trojan horse (AdExchanger)? I do not think Google or Meta rig the code. Still, defaults and inputs can favor the channels they know best. Forrester's answer is to layer incrementality tests into the model (Forrester), which is also mine.
Output your finance lead can read without a translator.
✅ Where Luca AI fits
Luca AI is not an MMM package. As an AI layer over the store's connected data, Luca AI handles the data layer and the questions around the model. You can ask whether last month's budget shift matched the curve, and get the reasoning back in plain English.
How should you allocate your marketing budget across channels using MMM?
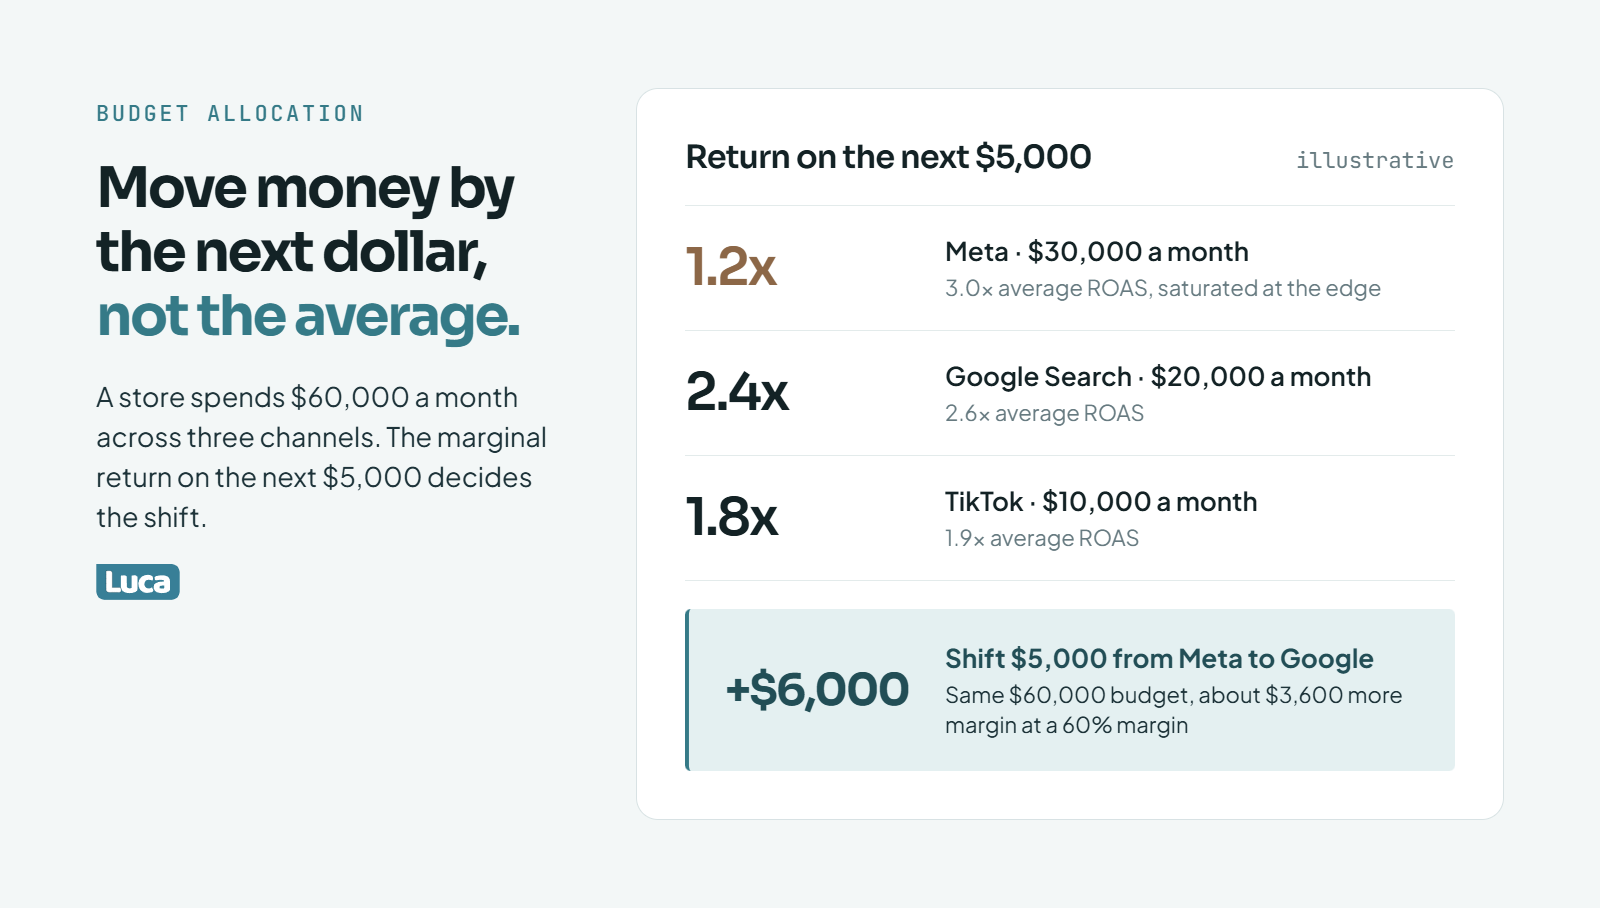
Same $60,000 budget: shifting $5,000 to the higher marginal return adds about $3,600 of margin.
Marketing budget allocation with MMM means moving money by marginal return, not average ROAS. Marginal return is what the next dollar earns, while average ROAS blends every dollar already spent. A channel can show 3x on average while its next $5,000 returns 1.2x because it is saturated. Shift spend from the flattest response curve to the steepest until marginal returns roughly match, then check the result against contribution margin, not revenue.
📉 Why average ROAS misleads
Average ROAS is a blended number. It mixes your cheapest, best-converting dollars with the expensive ones you added last. The first $10,000 on Meta often reaches warm buyers. The last $10,000 reaches people who have already seen the ad six times.
This example is illustrative, not client data. The skincare store spends $60,000 a month: $30,000 on Meta, $20,000 on Google Search, and $10,000 on TikTok. Its model estimates the marginal return on the next $5,000 in each channel:
Average vs marginal return by channel (illustrative)
Channel
Monthly spend
Average ROAS
Marginal return on next $5,000
Meta
$30,000
3.0x
1.2x
Google Search
$20,000
2.6x
2.4x
TikTok
$10,000
1.9x
1.8x
Move $5,000 from Meta to Google Search. Meta loses about $6,000 in revenue ($5,000 x 1.2). Google gains about $12,000 ($5,000 x 2.4). Total spend stays at $60,000, and revenue rises by roughly $6,000.
That is why I never sign off a budget shift on revenue alone. The extra $6,000 in revenue above is worth about $3,600 in margin. That number is what the CFO should see.
⚖️ Keep a test budget, and know when to tighten it
Response curves only cover what you have already tried. So keep a test tranche. One rule from Digital Darts is 70% on proven winners and 30% on tests. When performance dips, shift to 90/10 or even 100% winners.
Fixed monthly budget windows also cost money. One media buyer put it plainly: sticking to a fixed target means you "miss the opportunity of when your media is the cheapest". Luca AI's read is that budgets should move weekly with marginal return, inside guardrails finance agrees to in advance.
How do you forecast ROAS by channel before you spend?
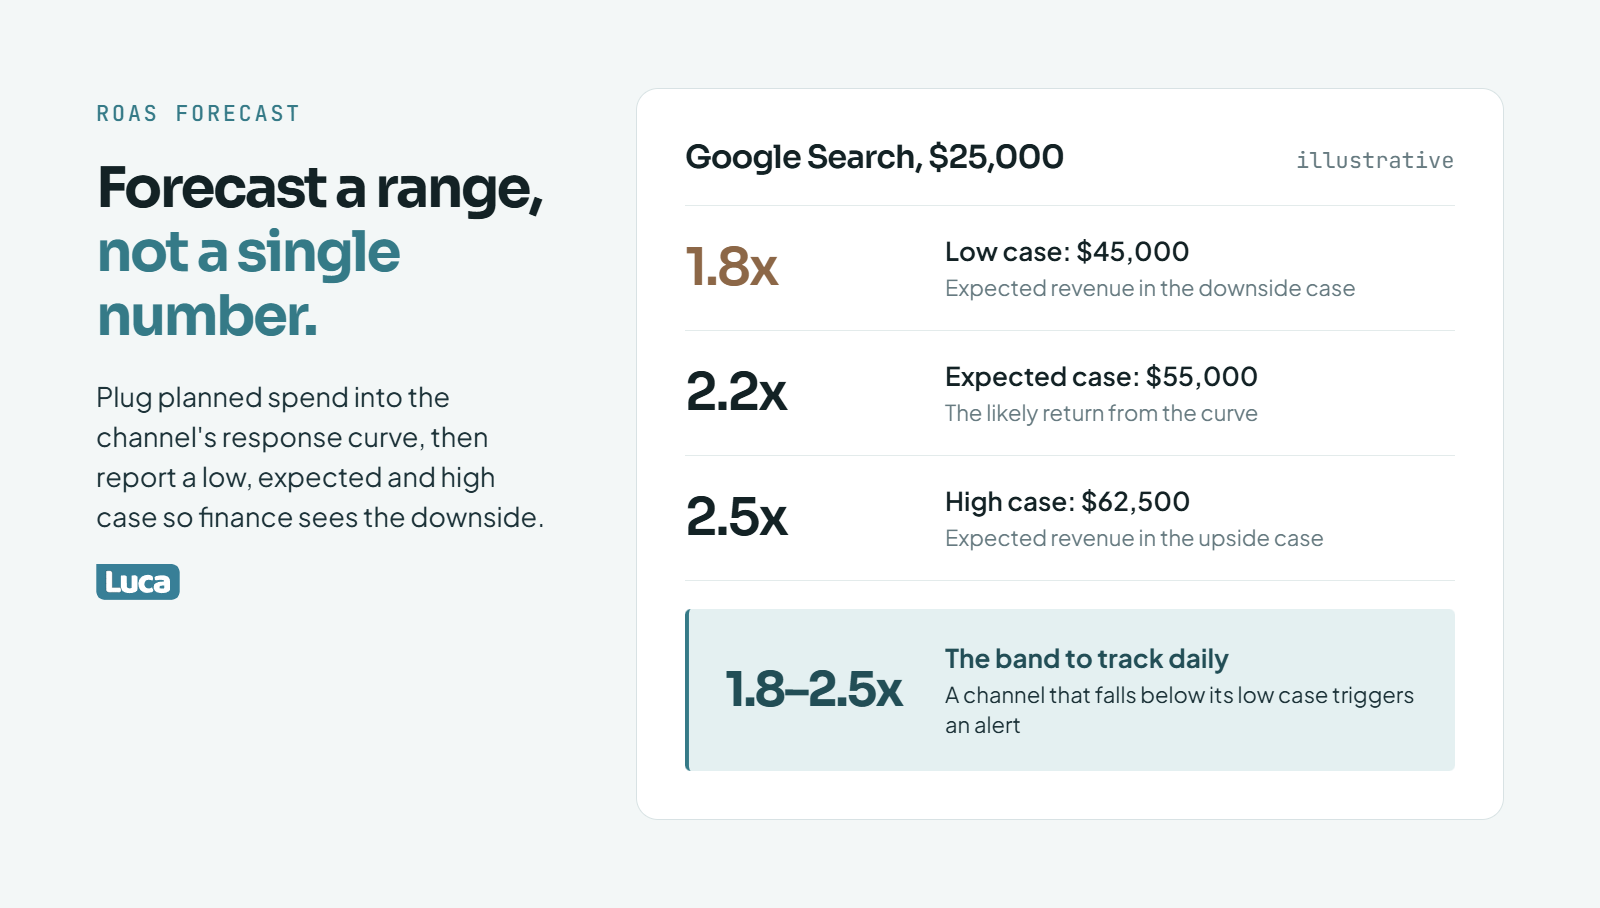
Forecast a low, expected and high case so finance can see the downside before you spend.
Forecast ROAS as a range, not a single number. Take each channel's response curve, plug in planned spend, and report a low, expected, and high case so finance sees the downside. Then adjust for seasonality, promotions, and long buying cycles. Luca AI tracks actual results against that range daily and alerts the team when a channel leaves its band, so slumps are caught in days.
📏 Build the forecast with an upper and lower bound
Kunle Campbell's rule for pricing decisions works for ad budgets too. Finance and marketing should model results "with an upper and lower bound so that finance can see the likely best- and worst-case scenarios". One shared range beats two departments arguing over one number.
Here is an illustrative example. The store plans $25,000 on Google Search next month. Its curve suggests a likely return of 2.2x, with a band from 1.8x to 2.5x.
Google Search ROAS forecast range (illustrative)
Case
Return
Expected revenue
Low
1.8x
$45,000
Expected
2.2x
$55,000
High
2.5x
$62,500
⏰ The long-window problem for high-priced products
Attribution windows hide slow buyers. One automotive parts founder described customers researching "a $2,000 set of shocks" for 60, 90, or even 150 days. A 7-day click window will call that campaign a failure while the curve says it works.
So match your forecast window to your buying cycle. For a $40 moisturizer, a monthly view is fine. For a $2,000 product, judge the channel over a full quarter.
⚠️ Benchmarks have moved, so anchor to your own curve
Old ROAS benchmarks no longer hold. Kunle Campbell notes a good ROAS benchmark used to sit between 2.5 and 5, while Facebook ROAS had declined to around 1.5 to 3. If your plan assumes last decade's numbers, the forecast is wrong before it starts.
Some weeks break any model. Blenders Eyewear saw a spike when Deion Sanders wore its glasses at a conference. One media strategist described pitching an extra $50,000 into a category during a heat wave because media and demand lined up.
Re-forecast when any of these happen:
A viral moment or press hit lifts baseline sales.
Weather or news shifts demand for a category.
An ad account changes, such as a ban or a new campaign structure.
A stockout removes a best seller.
✅ Where Luca AI fits
Luca AI checks actual spend and revenue against the forecast range every day. When a channel falls below its low case, Luca AI sends an alert on Slack, email, or the app. Luca AI also points to the related metrics that moved, such as CAC, conversion rate, or stock levels.
What are GA4 predictive metrics and predictive audiences, and who qualifies?
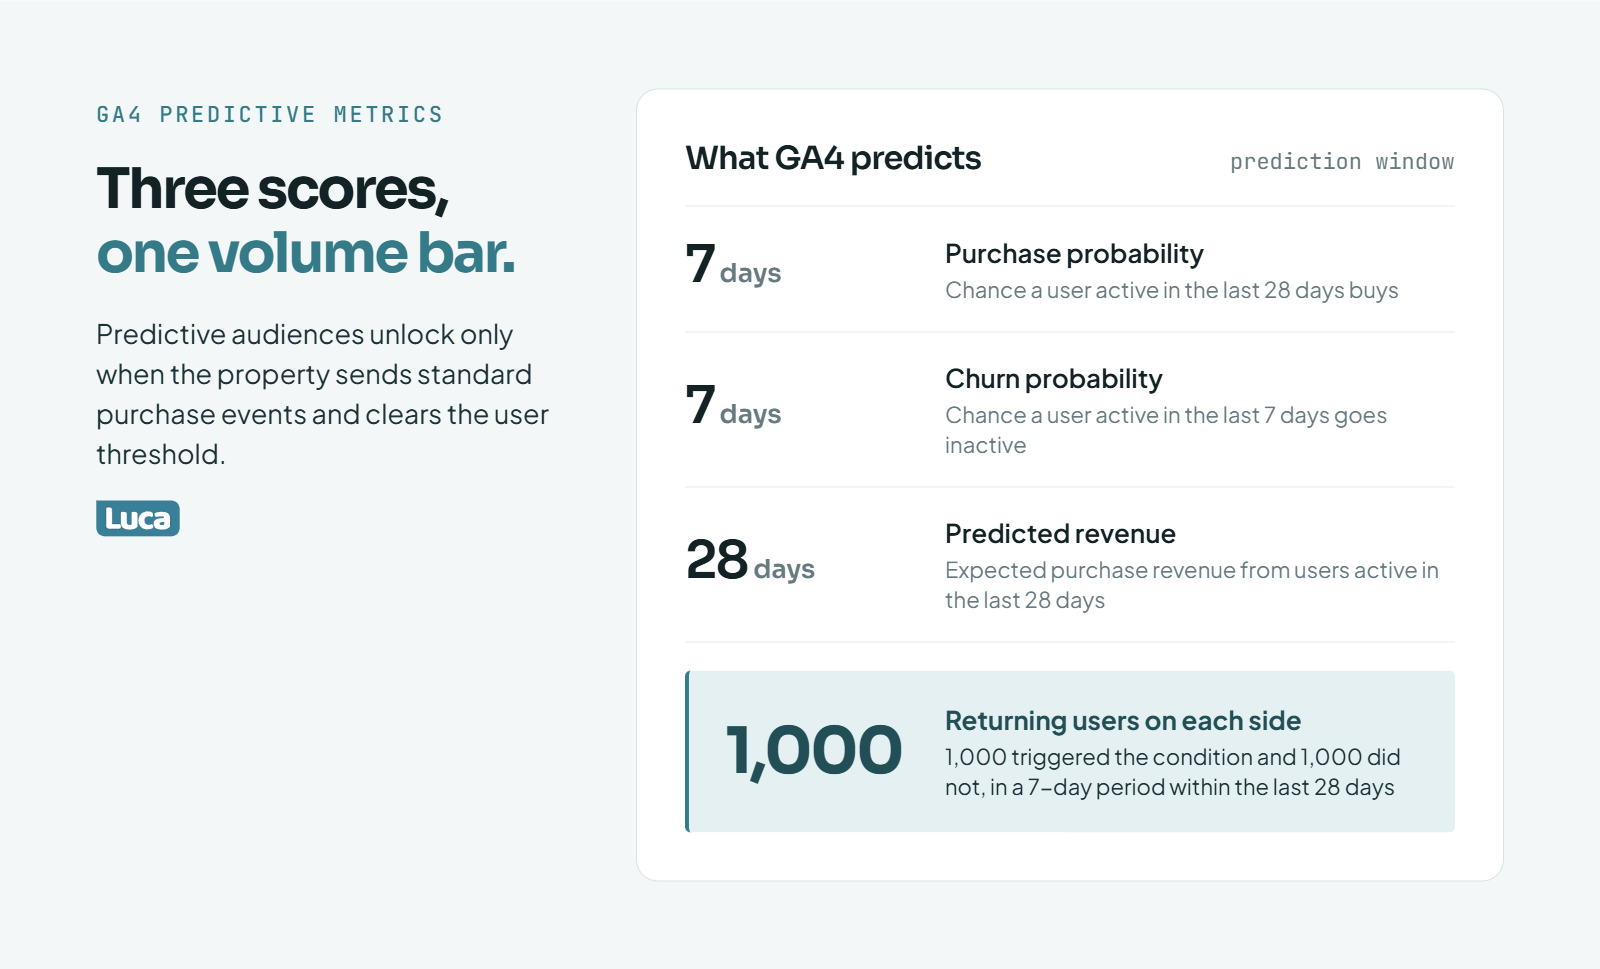
Predictive audiences unlock only after 1,000 returning users trigger the condition and 1,000 do not.
GA4 predictive metrics are three model-based scores: purchase probability, churn probability, and predicted revenue. Predictive audiences are user lists built on those scores, such as "likely 7-day purchasers." They unlock only when the property sends standard purchase events and, over a seven-day period in the last 28 days, at least 1,000 returning users triggered the condition and 1,000 did not (Google Analytics Help).
Purchase probability: the chance that a user active in the last 28 days logs a purchase in the next 7 days.
Churn probability: the chance that a user active in the last 7 days will not be active in the next 7 days.
Predicted revenue: expected revenue from all purchases in the next 28 days by users active in the last 28 days.
GA4's suggested audiences use percentile cutoffs. For example, "likely 7-day purchasers" means purchase probability above the 90th percentile (Google Analytics Help).
✅ How to check whether you qualify
Open Admin, then Audiences, then New audience.
Open the Predictive tab of suggested audiences.
Look for a "Ready to use" label on each audience.
Each metric has its own status. Purchase probability can be ready while predicted revenue is not.
❌ Why most smaller stores fail the test
The volume bar is the usual blocker. You need 1,000 returning purchasers and 1,000 returning non-purchasers in a seven-day period within the last 28 days (Google Analytics Help). Plenty of stores doing $1 million a year never get there.
The second blocker is setup. Purchase probability and predicted revenue need the standard purchase or in_app_purchase event, with value and currency parameters (Google Analytics Help). A renamed checkout event means the model never trains. Model quality must also hold over time, so eligibility can lapse.
Visit patterns matter too. Research by Peter Fader, cited by Kunle Campbell, found changes in visit frequency predicted conversion. A customer whose visits are rising is more likely to buy than one whose visits are fading.
💡 Why this belongs in a budget article
MMM tells you how much to spend by channel, from the top down. Predictive audiences tell you who that money should reach, from the bottom up. Luca AI's view is that stores need both answers, or the budget lands on people who would have bought anyway.
✅ Where Luca AI fits
Luca AI builds customer-level views from Shopify and Klaviyo order history. Those views do not depend on GA4's thresholds. You can ask Luca AI which customers are overdue for a repeat order, and get the list with the reasoning.
How do you use predictive audiences in Google and Meta ads without wasting budget?
Use predictive audiences mainly for exclusions, bid signals, and lookalike seeds, not micro-targeting. Exclude likely buyers from costly prospecting, send likely churners into win-back, and seed lookalikes from high-value customers. GA4 audiences flow into Google Ads when the accounts are linked (Google Analytics Help). Meta needs first-party customer lists. Then prove lift with a holdout, or you are paying to reach people who would buy anyway.
🔗 The Google Ads path
Link GA4 to Google Ads in GA4 Admin, under Product links.
Build the predictive audience in GA4 once it shows "Ready to use."
Use "likely 7-day purchasers" as an exclusion on prospecting campaigns.
Use "likely 7-day churning purchasers" as a target for a win-back offer.
Use "predicted 28-day top spenders" as a signal in Performance Max.
Exclusions often save more money than targeting earns. Every likely buyer you remove from prospecting is a sale you stop paying for twice.
📱 The Meta path
Meta does not read GA4 audiences directly. Upload first-party lists instead, built from Shopify or Klaviyo segments. Kunle Campbell's advice is to find lookalikes "for specific segments of your consumer, like your VIPs".
Do not over-slice. Digital Darts says "audience hacks are dead," and the move now is "letting your creative do the targeting". So keep targeting broad, and use your lists for exclusions, seeds, and retention.
Still, a high conversion rate is not the same as lift. Many of those buyers would have returned anyway.
🧪 Prove the lift with a holdout
Split your audience randomly. Show ads to 80% and hold back 20%. After four weeks, compare purchase rates between the two groups in Shopify. The difference is what the campaign actually caused.
💬 What GA4 users say about the setup
"The downside of GA is its learning curve, especially with GA4... finding specific metrics or building custom reports can take time." Aman S., Performance Marketing Head, Google Analytics - G2 Verified Review, December 24, 2025, rated 2/5
"Almost all of the super popular, easy-to-use, out-of-the-box reports now have to be manually created." Verified User in Computer Software, Google Analytics - G2 Verified Review, December 9, 2022, rated 2/5
"I love how seamlessly it connects our ad platforms and CRM data, showing exactly where our conversions come from." Verified User, Triple Whale - G2 Verified Review, October 9, 2025, rated 5/5
✅ Where Luca AI fits
Luca AI identifies VIP and at-risk segments from order history, ready to export as customer lists. Luca AI then reports whether a seeded campaign brought in customers with better repeat rates. That closes the loop between who you targeted and what they were worth.
What does MMM look like for a real store? A worked example
Here is an illustrative walkthrough, not client data. A Shopify skincare store makes $250,000 a month and spends $60,000 across Meta, Google Search, and TikTok. Its model shows Meta's next dollar earns less than Google Search's. So the store shifts budget in steps, keeps a test tranche, excludes likely buyers from prospecting, and checks contribution margin every week. The lesson is a loop: model, shift, test, and recheck.
🏪 The situation
Meet Priya, the founder in this example. Her store sells a $48 serum and a $32 cleanser. About 40% of revenue comes from returning customers. Meta reports a 3.0x ROAS, so her media buyer wants to raise Meta again for spring.
Priya had 26 months of weekly data and three channels with real spend. She had also varied Google spend on purpose for two summers. That passed the readiness test from earlier in this guide.
The model, run in Robyn by a freelance analyst, returned the curves in the Q5 table. Meta's marginal return on the next $5,000 was 1.2x. Google Search's was 2.4x. TikTok's was 1.8x. Baseline sales, meaning sales with no paid media, were about 45% of revenue.
💰 The shift and the math
Priya did not move everything at once. She moved $5,000 a month from Meta to Google Search for six weeks:
Meta: $30,000 down to $25,000.
Google Search: $20,000 up to $25,000.
TikTok: held at $10,000, still treated as the test tranche.
Using the curves, Meta should lose about $6,000 in revenue and Google should gain about $12,000. At her 60% margin after product cost and shipping, that is about $3,600 more margin a month on the same $60,000 budget.
She also excluded GA4's "likely 7-day purchasers" from Google prospecting. Her store had just cleared the 1,000-user threshold. That cut spend on people who were about to buy anyway.
🔍 The recheck, and what went wrong
Six weeks later, Shopify revenue was up, and weekly MER rose from 4.2x to 4.3x. Those numbers are illustrative, chosen to match the math above. The margin gain was smaller than forecast, about $2,500 a month, not $3,600.
She then ran a four-week geo holdout on Meta to check the model. Sales dropped in the paused regions, though by less than Meta's own reports implied. The model's lower Meta estimate held up.
🧭 What Priya took from it
Digital Darts calls early test spend "buying learnings before earnings." Brez reportedly spent $75,000 to $100,000 just to learn what worked. Priya's TikTok budget plays the same role. It is not judged on this month's ROAS.
What should you set up this week, whatever your stage?
Under $1 million a year, master one channel and track weekly MER. Between $1 million and $10 million, log promotions, vary spend on purpose, run a holdout each quarter, and try Robyn or Meridian once you have two years of data. Above that, run MMM monthly, calibrate it with tests, and connect predictive audiences to Google and Meta. Luca AI fits stores past the single-channel stage with enough data to reason against.
🌱 Under $1 million a year
Focus beats spread at this stage. Digital Darts advises putting 100% of your effort into one channel, Meta or Google, until it works. Splitting a small budget across four platforms just spreads your data thin.
Your setup list this week:
Track weekly MER, which is total revenue divided by total ad spend.
Tag every link with clean UTMs.
Start a simple promotions and stockout log in a spreadsheet.
Skip MMM and attribution software for now.
🚀 Between $1 million and $10 million
This is where single-channel growth turns risky. Digital Darts warns that "Meta-only growth is fragile. One account ban, one algorithm update, and your entire growth engine disappears overnight". Treat Meta as one of several "Plan A" channels.
It helps to split channels by job. Demand generation, like Meta and TikTok, puts ads in front of people who are not searching yet. Demand capture, like Google Search, meets people already looking. You need both, and MMM will show how they feed each other.
Your setup list this week:
Add aMER, first-time customer revenue divided by ad spend, beside MER (Common Thread Collective).
Plan one channel's spend to vary outside peak season.
Try Robyn or Meridian once you reach about two years of weekly data (Shopify).
🏢 Above $10 million
At this size, a small error in budget is a big number in dollars. Run MMM at least monthly. Feed each holdout result back into the model so it stays honest. Connect predictive audiences to both Google Ads and Meta, mostly as exclusions and seeds.
Bring finance into the loop. The forecast should carry a low, expected, and high case that the CFO signs off before the month starts.
Monday: check MER, aMER, and margin by channel against the forecast range.
Look for anything odd: stockouts, viral spikes, or account changes.
Decide one budget move, or decide to hold.
Write it in the log, so next quarter's model can see it.
✅ Where Luca AI fits
Luca AI fits stores past the single-channel stage that have enough data to reason against. It connects Shopify, ad accounts, and email, then sends the weekly review as a report with charts and reasoning. You make the call. If you are working through this right now, tell us which number you trust least, and we will tell you what we would check first.
How long does it take to set up marketing mix modeling for an e-commerce store?
For most stores we work with, the model itself is the fast part. The slow part is the data. Sellforte puts implementation for small and mid-sized e-commerce brands at about two to four weeks, and that matches what we would expect once the inputs are clean.
Here is where the time usually goes:
Week 1: pulling 104 or more weeks of sales and spend by channel into one table.
Week 2: adding the promotions log, price changes, stockouts, and holidays.
Weeks 3 to 4: fitting the model, checking whether the curves make sense, and comparing them with any holdout tests you have run.
If your spend sits in five tools with different date formats and currencies, add weeks, not days. Luca AI shortens that first step because it connects Shopify, Meta, Google, and Klaviyo and normalizes the data on ingestion, so the weekly table already exists. You can read more about how that works in our guide to e-commerce data integration.
Our honest advice is to start the promotions log today, even if the model is a year away. It is the input stores most often wish they had kept.
How often should you rerun a marketing mix model?
We recommend a full refresh at least monthly once you rely on the model for budget decisions, and quarterly at minimum for smaller stores. Weekly reruns rarely help, because MMM reads aggregate weekly data and needs several new weeks before anything meaningful changes.
Rerun sooner when something breaks the pattern:
A new channel gets meaningful spend for the first time.
A holdout test result disagrees with the model.
A viral moment, stockout, or account ban distorts several weeks of sales.
Your prices or margins shift.
Between refreshes, the job is monitoring, not modeling. Luca AI checks actual spend, revenue, and MER against the forecast range every day and sends an alert when a channel drifts outside its band. That way you know when the curve has gone stale instead of discovering it at month end. Our guide to e-commerce monitoring tools covers how to set those alerts up.
One caution from our side: do not rerun the model just because you dislike its answer. Run a holdout test instead. A test settles an argument that another model run only restarts.
Can marketing mix modeling measure email, SMS, and organic social?
Yes, with a caveat. MMM can include any activity you can express as a weekly number, such as emails sent, SMS sends, influencer posts, or podcast spots. That is one of its real advantages over pixel-based e-commerce attribution, which only sees tracked clicks.
The caveat is that owned channels behave differently from paid ones:
Email and SMS mostly reach existing customers, so they overlap heavily with baseline sales. The model may struggle to separate them.
Organic social has no spend, so you need a volume measure like posts or reach.
Influencers and podcasts often run in bursts, which actually helps the model read their effect.
We suggest reading owned-channel results as directional and checking them with a simple holdout, such as pausing one email flow for a random 20% of customers. Luca AI can compare repeat purchase rates between those groups from your Shopify and Klaviyo data, which is often more reliable than the model's estimate for email. For the wider picture, see our piece on AI marketing analytics for e-commerce.
What is a good MER for an e-commerce store?
There is no universal good MER, because the right number depends on your margin. MER, or marketing efficiency ratio, is total revenue divided by total ad spend. What matters is whether it clears your break-even point.
Here is the simple way we calculate it:
Find the share of revenue left after product cost, shipping, and payment fees. Say it is 60%.
Divide 1 by that share. One divided by 0.6 is about 1.67.
Any MER below 1.67 means ads cost more than the margin they bring in, before overhead.
Most stores need a buffer well above break-even to cover salaries, software, and rent. A store with 40% margins needs an MER of 2.5 just to break even on ads, so benchmarks borrowed from higher-margin brands mislead.
We also recommend tracking aMER, which is first-time customer revenue divided by ad spend, because repeat buyers can flatter blended MER. Luca AI reports MER, aMER, and contribution margin by week, so you see the trend rather than a single number. Our guide to contribution margin vs gross margin explains which costs to include.
What should you do if GA4 predictive audiences never become eligible?
This is common, so do not treat it as a setup failure. GA4 needs at least 1,000 returning users who purchased and 1,000 who did not, over a seven-day period in the last 28 days, plus the standard purchase event with value and currency. Many stores below a few million in annual revenue never clear that bar.
First, rule out fixable problems:
Confirm your checkout fires the standard purchase event, not a renamed one.
Check that value and currency are passed with every purchase.
Look for consent or tag issues that drop purchase events.
If volume is the real limit, build the audiences from order history instead. Score customers on recency, frequency, and spend, then export segments such as lapsed repeat buyers or top spenders as customer lists for Google and Meta. Luca AI builds these segments from Shopify and Klaviyo data, which does not depend on GA4 thresholds, and can tell you which customers are overdue for a repeat order. Our guide to e-commerce customer segmentation walks through the scoring.
Whichever route you take, prove lift with a holdout group before scaling spend on the audience.
Enjoyed the read? Join our team for a quick 15-minute chat — no pitch, just a real conversation on how we’re rethinking Ecommerce with AI - Luca
Loading Schedule...
Your AI Co-Founder is here.
Here’s why:
Shopify, Meta, Xero - one brain.
"Should I scale?" Answered with real data.
Growth capital. No applications. One click.
Thank you! Your submission has been received! Please book a time slot for the Meeting
Oops! Something went wrong while submitting the form.