The Complete Guide to AI Product Analytics: Tools, Metrics, and Benefits
mins read
TL;DR
AI product analytics answers product questions in plain English, flags anomalies against your own history, and recommends a next step instead of handing you another chart.
Gross margin hides eight variable costs. One hero SKU showing 72% gross margin ran at 8% contribution margin, and negative once acquisition cost was allocated.
Keep contribution margin per order per day, SKU-level CAC, MER, stripped AOV, return rate by SKU, category diversity, and inventory-to-cash coverage. Drop blended averages.
AI referrals deserve their own channel. Shopify data shows roughly 50% higher conversion and 14% higher AOV, before AI commerce take rates of around 4%.
Normalize schemas at ingestion rather than funding a warehouse cleanup year. Definition fights over retail calendars and invoiced versus demand sales stall most projects.
Keep humans on QA, taste, and relationship selling. Score any AI system on override rate, traceability, and whether its totals reconcile to your books.
Q1. What is AI product analytics, and what does it change for a store owner rather than a product manager? [toc=1. Defined for Operators]
AI product analytics applies machine learning and language models to product-level data so you can ask questions in plain English, get anomalies pushed to you, and receive a recommended next step. Web analytics measures traffic. Product analytics measures behavior inside the product. For a software team, "product" means a feature. For a store owner, "product" means a SKU carrying a landed cost, a return rate, and an acquisition cost. Luca AI connects Shopify, Meta, Google, Klaviyo, accounting tools, and 3PL data into one layer so product questions get answered across all four of those cost lines at once.
The scene every operator recognizes
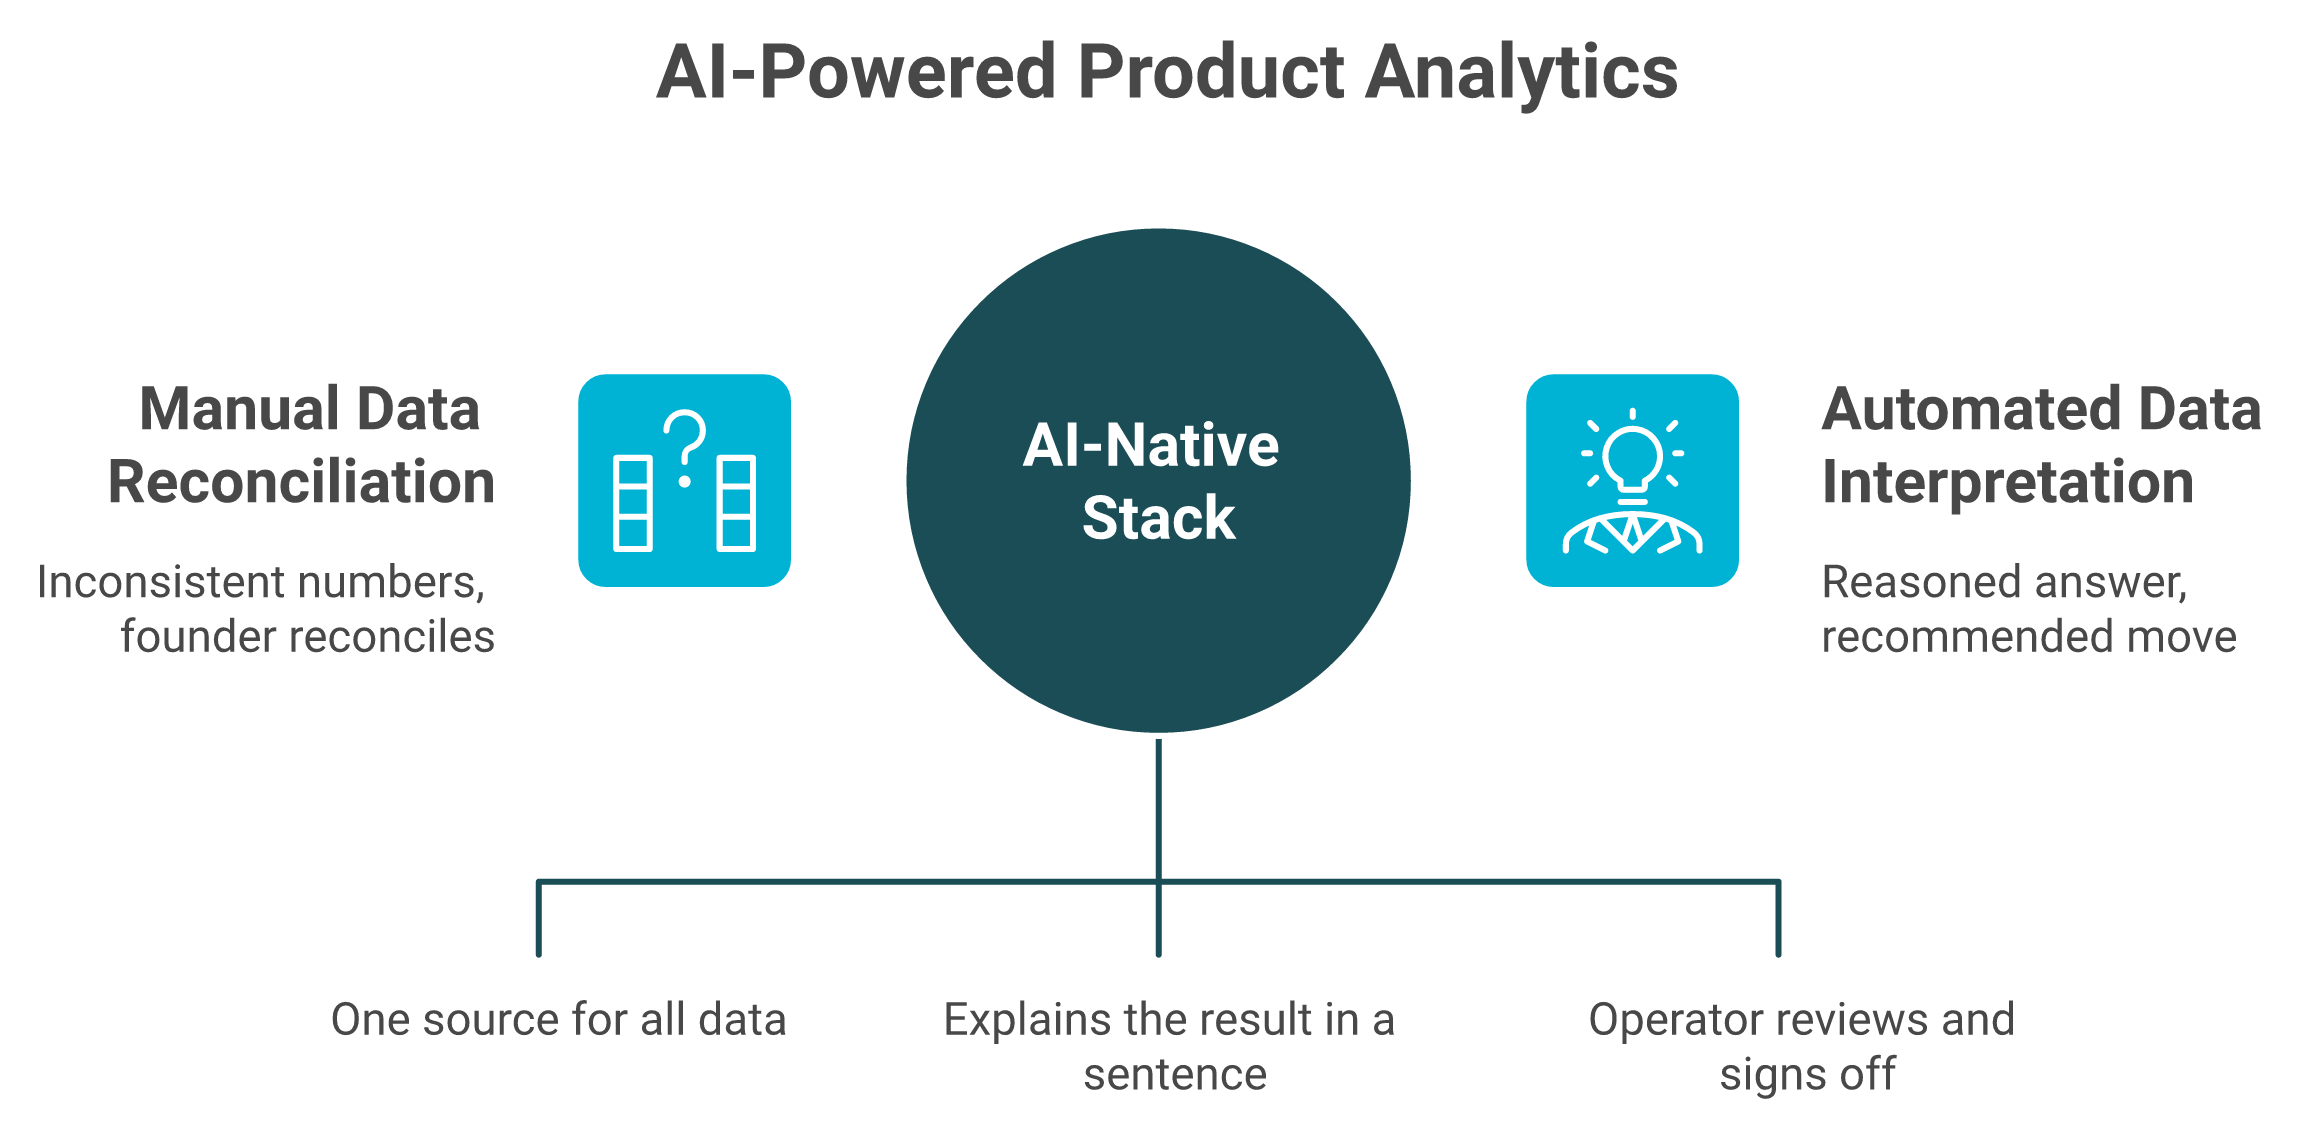
It is Sunday night. You have four tabs open. Shopify says one revenue number, Meta claims another, and your accountant's P&L says a third.
You are not analyzing. You are reconciling. That is the job most tools quietly hand back to you.
❌ What the old stack actually costs
Platform-reported numbers disagree by design, and operators say so in public. Review evidence is blunt about it.
"Some data we still notice discrepancies between platforms, for example, tracking ads, and differences in the reported metrics like revenue." — Verified user, Mid-Market, Triple Whale G2 Verified Review, 4/5, April 2023
"Sampling, sampling, sampling... When we switched to an enterprise web analytics solution that does no sampling, we found that Google Analytics was telling us we had twice as much traffic as we actually do." — Gitai B., Marketing, Web Analytics, and Testing Lead, Google Analytics G2 Verified Review, 1/5, November 2016
Both reviewers are describing the same defect. The tool shows data. Nothing reasons across it.
What actually changed
Dashboards were built to display. Language models can read the whole pool, hold context across sources, and explain a result in a sentence.
That shift matters because scale is no longer the constraint. Mixpanel's 2026 State of Digital Analytics covers 3.7 trillion events, including 290.8 billion AI events, which tells you the plumbing is mature. The bottleneck is interpretation, not collection.
The category change is not prettier charts. It is a different output: the reasoning and the next step instead of a number you still have to interpret.
⭐ Why "product" means SKU here
Every ranking guide on this keyword assumes you have an event taxonomy and a data analyst. You have neither. You have inventory.
A SKU decision is simultaneously a marketing decision, an inventory decision, and a cash decision. Luca AI is built around that joint, which is why it reads accounting and 3PL data alongside ad platforms rather than stopping at the storefront, the same principle behind ecommerce business intelligence that spans functions.
✅ What you should expect from the category
Three capabilities separate real AI product analytics from a dashboard with a chat box bolted on.
You ask a product question in plain English and get a reasoned answer, not a chart you still have to interpret.
The system watches your own history and flags the outlier before you go looking.
It names the cause and the influencing components, then outlines the step.
Luca AI measures that last part by tracing a result back through the connected sources, so a margin drop on one SKU gets attributed to returns, shipping, or spend rather than left as "revenue is down."
💰 The honest limit
I will say the unpopular part. This category does nothing for you below a few thousand orders of history, because there is no pattern to reason against.
Luca AI is a poor fit for pure B2B sellers, marketplace-only operators, and enterprises that already employ a data team. It fits stores sitting on years of unused data with nobody to read it.
Luca AI is the AI operating system layer over your store's data, not another dashboard beside it. Our read is that the useful question was never "what happened," it was "which product should I stop pushing on Monday," and that question needs cost data in the same system as click data.
Q2. What can AI actually do with your product data beyond charting it? [toc=2. Capability Map]
Six capabilities carry real weight in AI product analytics: plain-English querying with no SQL, anomaly detection against your own history, prediction from past performance, scenario simulation, root-cause analysis that names influencing components, and scheduled reports pushed to you. Map them onto four layers. Descriptive says what happened, diagnostic says why, predictive says what is next, prescriptive says what to do. Luca AI runs all four layers over connected Shopify, Meta, Google, Klaviyo, and accounting data, and delivers output as dashboards, graphs, plain text, or a weekly report in Slack or email.
The four layers, and where most tools stop
Most products marketed as AI analytics stop at diagnostic. They will tell you ROAS fell and let you work out the rest.
The Four Layers of AI Product Analytics
Layer
The question it answers
What you get
Descriptive
What happened?
Revenue, orders, spend
Diagnostic
Why did it happen?
Channel and SKU breakdown with cause
Predictive
What happens next?
Demand, reorder points, sales forecast
Prescriptive
What do I do?
A recommended move with the reasoning
⚠️ Reporting labor is the real cost
Operators keep describing the same gap. The data arrives, the decision does not.
"Shortly after onboarding we were assigned an account manager. About a month later, she was laid off and we were never assigned a new account manager... it can take up to a week to hear back from the Polar team." — Ben S., Director of Commercial Operations, Polar Analytics G2 Verified Review, 4/5, September 2025
Neither tool is bad. Both leave the synthesis with you, which is why operators keep hunting for Polar Analytics alternatives.
From monitoring to recommending
One operator I listened to this year put the shift better than any vendor page. "No more descriptive analytics. Give me more prescriptive analytics. We are supposed to tell a brand you go right and that's better than going left."
That is the whole test. If the output is a prettier chart, nothing changed. It is the gap between a dashboard and decision intelligence tools.
📊 Pretty charts are a courtesy
Here is the part the category avoids saying. The visualization is not the substance.
The model reads the database, draws the conclusion, and tells you what matters. Charts exist to reassure you the conclusion is sound. Luca AI serves both, dashboards and graphs for verification, reasoning and recommendation as the actual output.
⏰ The failure mode on the other side
Text dumps are not insight either. I have watched founders receive twenty 25-page AI summaries across Klaviyo, Meta, Google, and analytics, then ask the obvious question: how do I actually use this?
Volume is not clarity. A useful system answers one question at the altitude you asked it.
✅ Capabilities you can put to work this week
Ask which SKUs lost contribution margin last month, with returns and support costs allocated.
Set an alert for inventory below a threshold or a CAC spike against your own baseline.
Request a weekly CAC report with graphs, reasoning, and your attribution model applied.
Ask for the blockers against a revenue goal, then review the steps it outlines.
Luca AI handles each of these as a standing instruction rather than a one-off query, which is the difference between a chatbot and an analyst seat.
Luca AI runs one orchestrating chain: connect the sources, analyze, surface the insight, recommend the move, then push it. Most analytics tools added AI on top of a dashboard. Luca is AI with the data layer underneath it, and the operator still decides what ships.
Q3. Why is gross margin lying to you about your best-selling product? [toc=3. True SKU Economics]
Gross margin tells you what it costs to make a product, not what it costs to sell it. Eight variable costs sit between the supplier invoice and real profit: landed cost, storage, pick and pack, shipping, payment processing, allocated returns, allocated customer service, and SKU-level acquisition cost. One kitchenware brand showed 72% gross margin on its hero knife set. Line by line it was 8%, and negative once acquisition cost was included. Luca AI allocates these eight lines to the SKU by reading returns, support volume, landed cost, and ad spend from the connected sources rather than from one platform's report.
The $49.99 product losing $21.31 an order
A founder running a $2.3M kitchenware brand built her business on a ceramic knife set. Fourteen dollars FOB, $49.99 retail, 72% gross margin on the dashboard.
Then we walked the costs line by line, the way any honest unit economics review has to run.
True Unit Economics of One Hero SKU
Line item
Per unit
Revenue
$49.99
Landed cost
$17.75
Storage
$0.65
Pick, pack, fulfill
$4.10
Shipping
$8.40
Payment processing
$1.75
Returns allocated (18% rate)
$6.20
Customer service allocated
$1.45
Acquisition cost
$31.00
Total cost
$71.30
⚠️ The allocation almost nobody runs
That $1.45 is the line most operators never calculate. This single product generated 42% of all customer service tickets.
Support volume is a product cost. If one SKU eats your inbox, that SKU is paying for the inbox, and your margin report should say so.
Why the dashboard never showed it
The data was sitting in her systems the whole time. Returns lived in Shopify, tickets in the help desk, landed cost in accounting, spend in Meta.
Nothing joined six sources to one product line. That is an architecture problem, not an effort problem, and reviewers describe the same wall.
"I've also reported an issue with inventory levels, as our inventory is multiplied with 6, since we have 6 different shopify stores connected to the same warehouse. Not really rocket science. But it has taken them closer to 1,5 month, and I've still not received a solution." — Maja, Verified buyer, Polar Analytics TrustPilot Verified Review, November 2025
Daily profit at the store level is useful. Daily profit at the SKU level is where the decision lives, and that distinction sits at the heart of contribution margin versus gross margin.
💸 What the audit changed
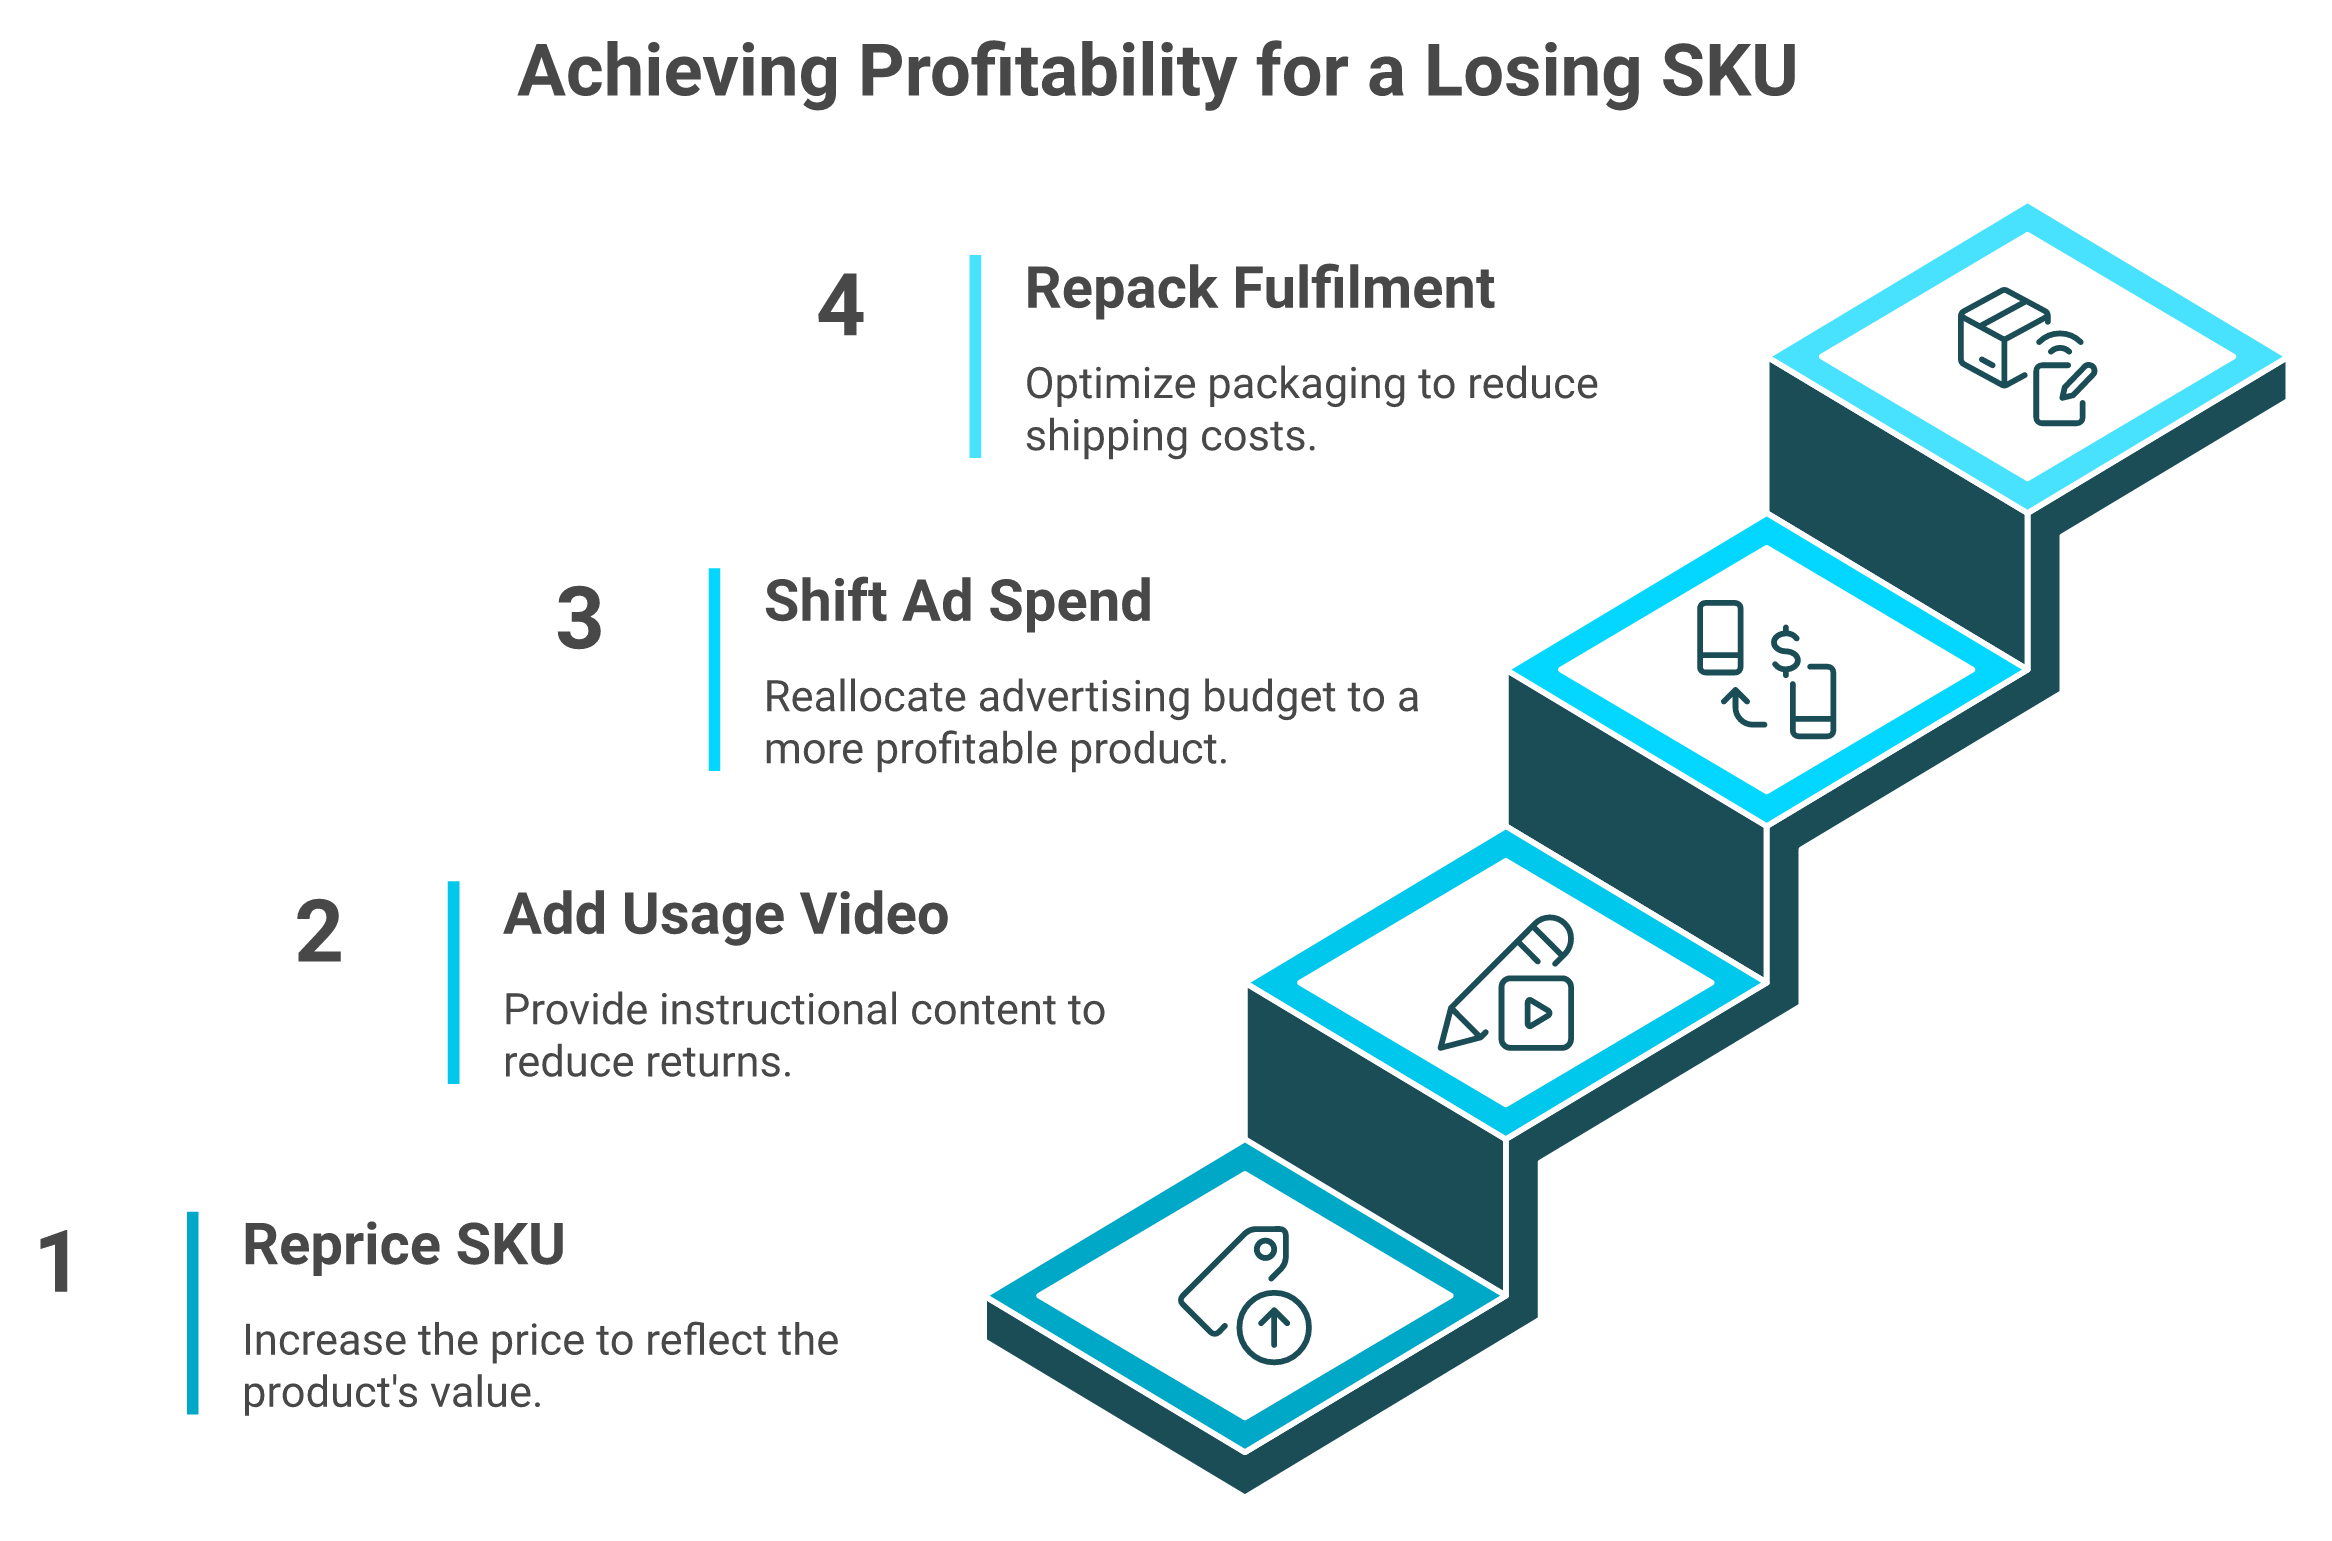
She did not kill the product. She repriced to $59.99, added an instructional usage video that cut returns from 18% to 9%, moved hero ad spend to a cutting board set, and repackaged to save $0.80 per unit.
Six months later, it ran at 23% contribution margin. Same product, different math.
A hero SKU showing 72% gross margin was losing money on every order. Four sequenced moves rebuilt it into a 23% contribution margin product.
⭐ The argument about acquisition cost
Some accountants will tell you acquisition cost belongs in marketing overhead, not unit economics. I disagree, and I will own it.
If you must spend money to acquire a customer to sell that unit, it is a variable cost of that sale. Argue about the P&L line all you want. You cannot make a product decision without it.
❌ Three averages to stop using
Blended AOV, which hides discounts and shipping you never keep.
Blended acquisition cost, which hides the SKU you are subsidizing.
Catalog-wide return rate, which hides the one product generating the tickets.
Luca AI reasons at the SKU level because averages are where underwater products hide, and it studies the pattern across months rather than one reporting window, which is how ecommerce profit margins get read correctly.
Luca AI assembles this eight-line view from the sources you already pay for, then flags SKUs whose contribution margin drifts. The analysis and the steps come from Luca. The repricing call stays yours.
Q4. Which product metrics deserve a dashboard, and which ones are theatre? [toc=4. Metrics That Matter]
Seven product metrics earn attention: contribution margin per order per day, SKU-level acquisition cost, marketing efficiency ratio, stripped average order value, return rate by SKU, product category diversity, and inventory-to-cash coverage. Three should go: platform ROAS, blended acquisition cost, and blended average order value. Luca AI monitors this set against a store's own history and sends an alert through Slack, email, or app notification when ROAS dips, acquisition cost spikes, or inventory falls below a set threshold.
The keep list, with the reason
Product Metrics Worth Tracking, and Why
Metric
What it tells you
Why it survives
Contribution margin per order per day
Profit after all variable costs
The only number that reflects a decision
SKU-level acquisition cost
What each product costs to sell
Blended numbers hide the loser
Marketing efficiency ratio
Total revenue divided by total ad spend
Survives long lead times and repeat purchase
Stripped AOV
Order value minus shipping, handling, discounts
Measures money you keep
Return rate by SKU
Product-level friction
Returns are a product cost, not a fee
Category diversity
How many verticals a customer buys
Strongest lifetime value lever I have seen
Inventory-to-cash coverage
Weeks of cash tied up in stock
Keeps reorders solvent
✅ How to strip your AOV, step by step
Pull order-level revenue for the period.
Subtract shipping and handling collected.
Subtract discounts and credits applied.
Divide by order count.
Compare the stripped figure to your platform-reported AOV.
The gap between those two numbers is the size of the lie you have been planning against.
The metric to retire first
Platform ROAS. Every ad account reports a number that flatters itself, and reviewers have been saying so for years.
Marketing efficiency ratio fixes the structural part. Revenue divided by total ad spend cannot be gamed by an attribution window, which is why declining platform ROAS keeps misleading growth teams.
📊 The benchmark worth planning against
One finding changed how I think about product reporting. Category diversity, not purchase frequency, drove lifetime value in the cohort work I have seen, with buyers who crossed into a second category jumping 50% to 100% in lifetime value.
That reorders your priorities. Cross-sell beats frequency campaigns, and your product report should show category crossover as a tracked metric, the same way ecommerce customer lifetime value work should.
⏰ Two numbers that set the stakes
Shopify's 2026 commerce data shows AI-referred shoppers converting roughly 50% higher than organic search with about 14% higher average order value. Triple Whale's 2025 benchmark report, built on $18.4 billion in ad spend across 33,000+ brands, is the widest DTC dataset published.
Use both as context, not gospel. Vendor data has a direction.
⚠️ The setup tax nobody prices in
Most of these metrics require definitions your tools do not share. Reviewers flag the learning curve honestly.
"Mobile limitations and the platform isn't a plug-and-play solution, it requires time and effort to learn its advanced features and capabilities." — Charlene R., Head of Operations, HR & Culture, Polar Analytics G2 Verified Review, 5/5, November 2024
Luca AI normalizes and standardizes data on ingestion, so the definitions are settled before you ask the first question. Connect the sources once, then ask for contribution margin by SKU in plain English rather than building the report yourself.
Q5. How do you measure AI-referred shoppers as their own channel? [toc=5. AI Channel Measurement]
AI-referred traffic should be split out of direct and organic, then judged on contribution margin rather than session volume. Shopify's 2026 data shows AI-referred sessions converting roughly 50% higher than organic search, with about 14% higher average order value, and AI-attributed orders growing close to 13 times year over year. Triple Whale recorded AI-driven orders up 1,481% across its 2025 benchmark set, with ChatGPT accounting for around 97% of that traffic. Luca AI tracks AI referrals as a separate cohort inside its connected Shopify and ad-platform data, so the channel's margin is reported after fees rather than before.
Step 1: Isolate the traffic before you judge it
Most stores bury AI referrals inside direct traffic. That single default makes the channel invisible.
Pull referrer data for ChatGPT, Perplexity, Copilot, Gemini, and Claude domains.
Create a dedicated channel group for them in your reporting layer.
Backfill 12 months so you have a trend, not a snapshot.
Report orders, conversion rate, and average order value against your organic baseline.
⚠️ Why platform reports will not do this for you
Session-based tools lose referrer context, and reviewers have been flagging that trust gap for years.
"To make decisions based on grounded data, it is really difficult to trust it 100% and it complicates decision-making." — Verified user, Mid-Market, Google Analytics G2 Verified Review, 1.5/5, 2023
That second quote comes from a five-star review. Even satisfied users are reconciling by hand, which is the exact friction that pushes operators toward cross-channel analytics tools.
Step 2: Price the channel honestly
High conversion is not the same as high profit. AI commerce channels carry their own take rate.
Based on what operators are reporting this year, transaction fees on AI shopping surfaces can add roughly 4% on top of card and platform fees. Stack that on a 30% contribution margin product and the channel's economics shift fast.
💸 The margin math to run
Organic Search Versus AI Referral Economics
Input
Organic search
AI referral
Conversion rate
Baseline
About 1.5x baseline
Average order value
Baseline
About 1.14x baseline
Extra channel fee
0%
Around 4%
What you report
Revenue
Contribution margin after fees
Luca AI measures this by applying your own cost inputs, including fees, landed cost, and returns, to the AI-referred cohort before it reports performance.
⭐ My read, with the hedge attached
Luca AI's data points toward AI referrals behaving like a high-intent channel rather than a new acquisition engine. I might be reading it too strongly this early.
Here is the caution. These visitors arrive pre-qualified, which inflates conversion rate without proving the channel scales. Treat the lift as evidence of intent, not of volume you can buy.
✅ What to do on Monday
Split AI referrals into their own channel this week, before Q4 planning.
Report the cohort on margin after fees, never on revenue.
Watch whether repeat purchase rate matches your organic cohort over 90 days, the way any customer journey analytics review should.
Ask for a weekly report on that cohort so the trend builds while you work.
Luca AI holds AI-referred orders as a standing cohort and pushes the weekly read to Slack or email with the reasoning attached. The analysis and the recommended next step come from Luca. Whether you shift budget toward that surface stays your call.
Q6. What does it take to get your product data AI-ready, and can you skip the cleanup year? [toc=6. Data Readiness]
Schema normalization at ingestion is what makes AI product analytics usable. Most projects stall because sources name things differently, retail calendars run 5-5-4 or 4-4-5 across vendors, and nobody agrees whether "sales" means invoiced or demand. Luca AI connects to over 200 native data sources and normalizes and standardizes the data on ingestion, which removes the manual cleaning, tagging, and SQL maintenance that reverse ETL and data activation stacks require. Raw warehouse logs are not a shortcut, because telemetry with no business logic still needs custom queries before anyone can decide anything.
Step 1: Settle your definitions first
Write these down before you connect a single source. Five lines on a page will save you a quarter.
Does revenue mean invoiced sales or demand sales?
Does your calendar run 5-5-4 weeks or 4-4-5?
Is landed cost per unit or per shipment?
Is a return counted at request or at refund?
Which attribution model is the house standard?
⚠️ Connector rot is the hidden tax
Pipelines age badly, and the people maintaining them notice first.
"They're very slow to update their existing connectors (beyond just making sure that they work). For example, their Meta connector is still called 'Facebook' despite that company being renamed in 2021." — Verified user, Supermetrics G2 Verified Review, 1.5/5, April 2024
Coverage gaps hurt the same way, and they are a recurring theme among Supermetrics alternatives. One operator's only complaint was the source he could not connect.
I have watched founders fund a warehouse build because somebody told them AI needs clean data first.
One health brand founder spent about $10 million and ten developers building a proprietary data engine. He abandoned it once language models outperformed it, then rebuilt on a connected stack over Shopify, Amazon, and session data. That is an expensive lesson available for free, and it is why ecommerce data integration decisions deserve more scrutiny than tool demos.
❌ Why raw logs disappoint
Cloud warehouses store everything and interpret nothing. An ex-AWS operator put it plainly: you look at it and it is just logs and logs of data you cannot make a decision from.
The work is not storage. The work is business logic, and that is the part teams underestimate.
✅ The readiness checklist
AI Product Analytics Data Readiness Checklist
Requirement
Who owns it
Failure if skipped
Source coverage
Your tool
Blind spots in margin
Normalized schemas
Ingestion layer
Permanent reconciliation
Identity resolution
Ingestion layer
Double-counted customers
Calendar alignment
You
Reports nobody trusts
Cost inputs loaded
You
Revenue reporting only
Luca AI handles the first three in the backend, including the cleaning, tagging, and normalizing that traditional warehousing makes you staff for.
⏰ How long this honestly takes
Luca AI's deployments start producing answers in days rather than quarters, though I will be straight about the variable. Stores with messy cost data still need a week of their own work loading landed cost and fee inputs.
Luca AI's read is that the standard advice gets this backwards. You do not clean data to get ready for AI. Connect the sources, let the ingestion layer normalize, then ask the question and fix definitions as they surface.
Q7. How do you ask an AI analytics system a product question that returns something usable? [toc=7. Asking Better Questions]
Context loading comes before prompting. An AI analytics system knows statistics but not your commercial rules, so margin targets, return thresholds, channel definitions, and reorder lead times have to be loaded first. Structure the request with CLEAR: clarity, logic, examples, adaptation, and results. Luca AI accepts plain-English questions with no SQL, no analyst, and no dashboard building, and it also accepts standing instructions, such as a weekly CAC report with graphs, reasoning, and a specified attribution model applied.
Treat it like a new hire, not a search box
Picture hiring someone with a PhD who knows everything about statistics and nothing about your store. First day, no context, no rules.
You would not hand that person a keyboard and expect a good decision. Same principle here.
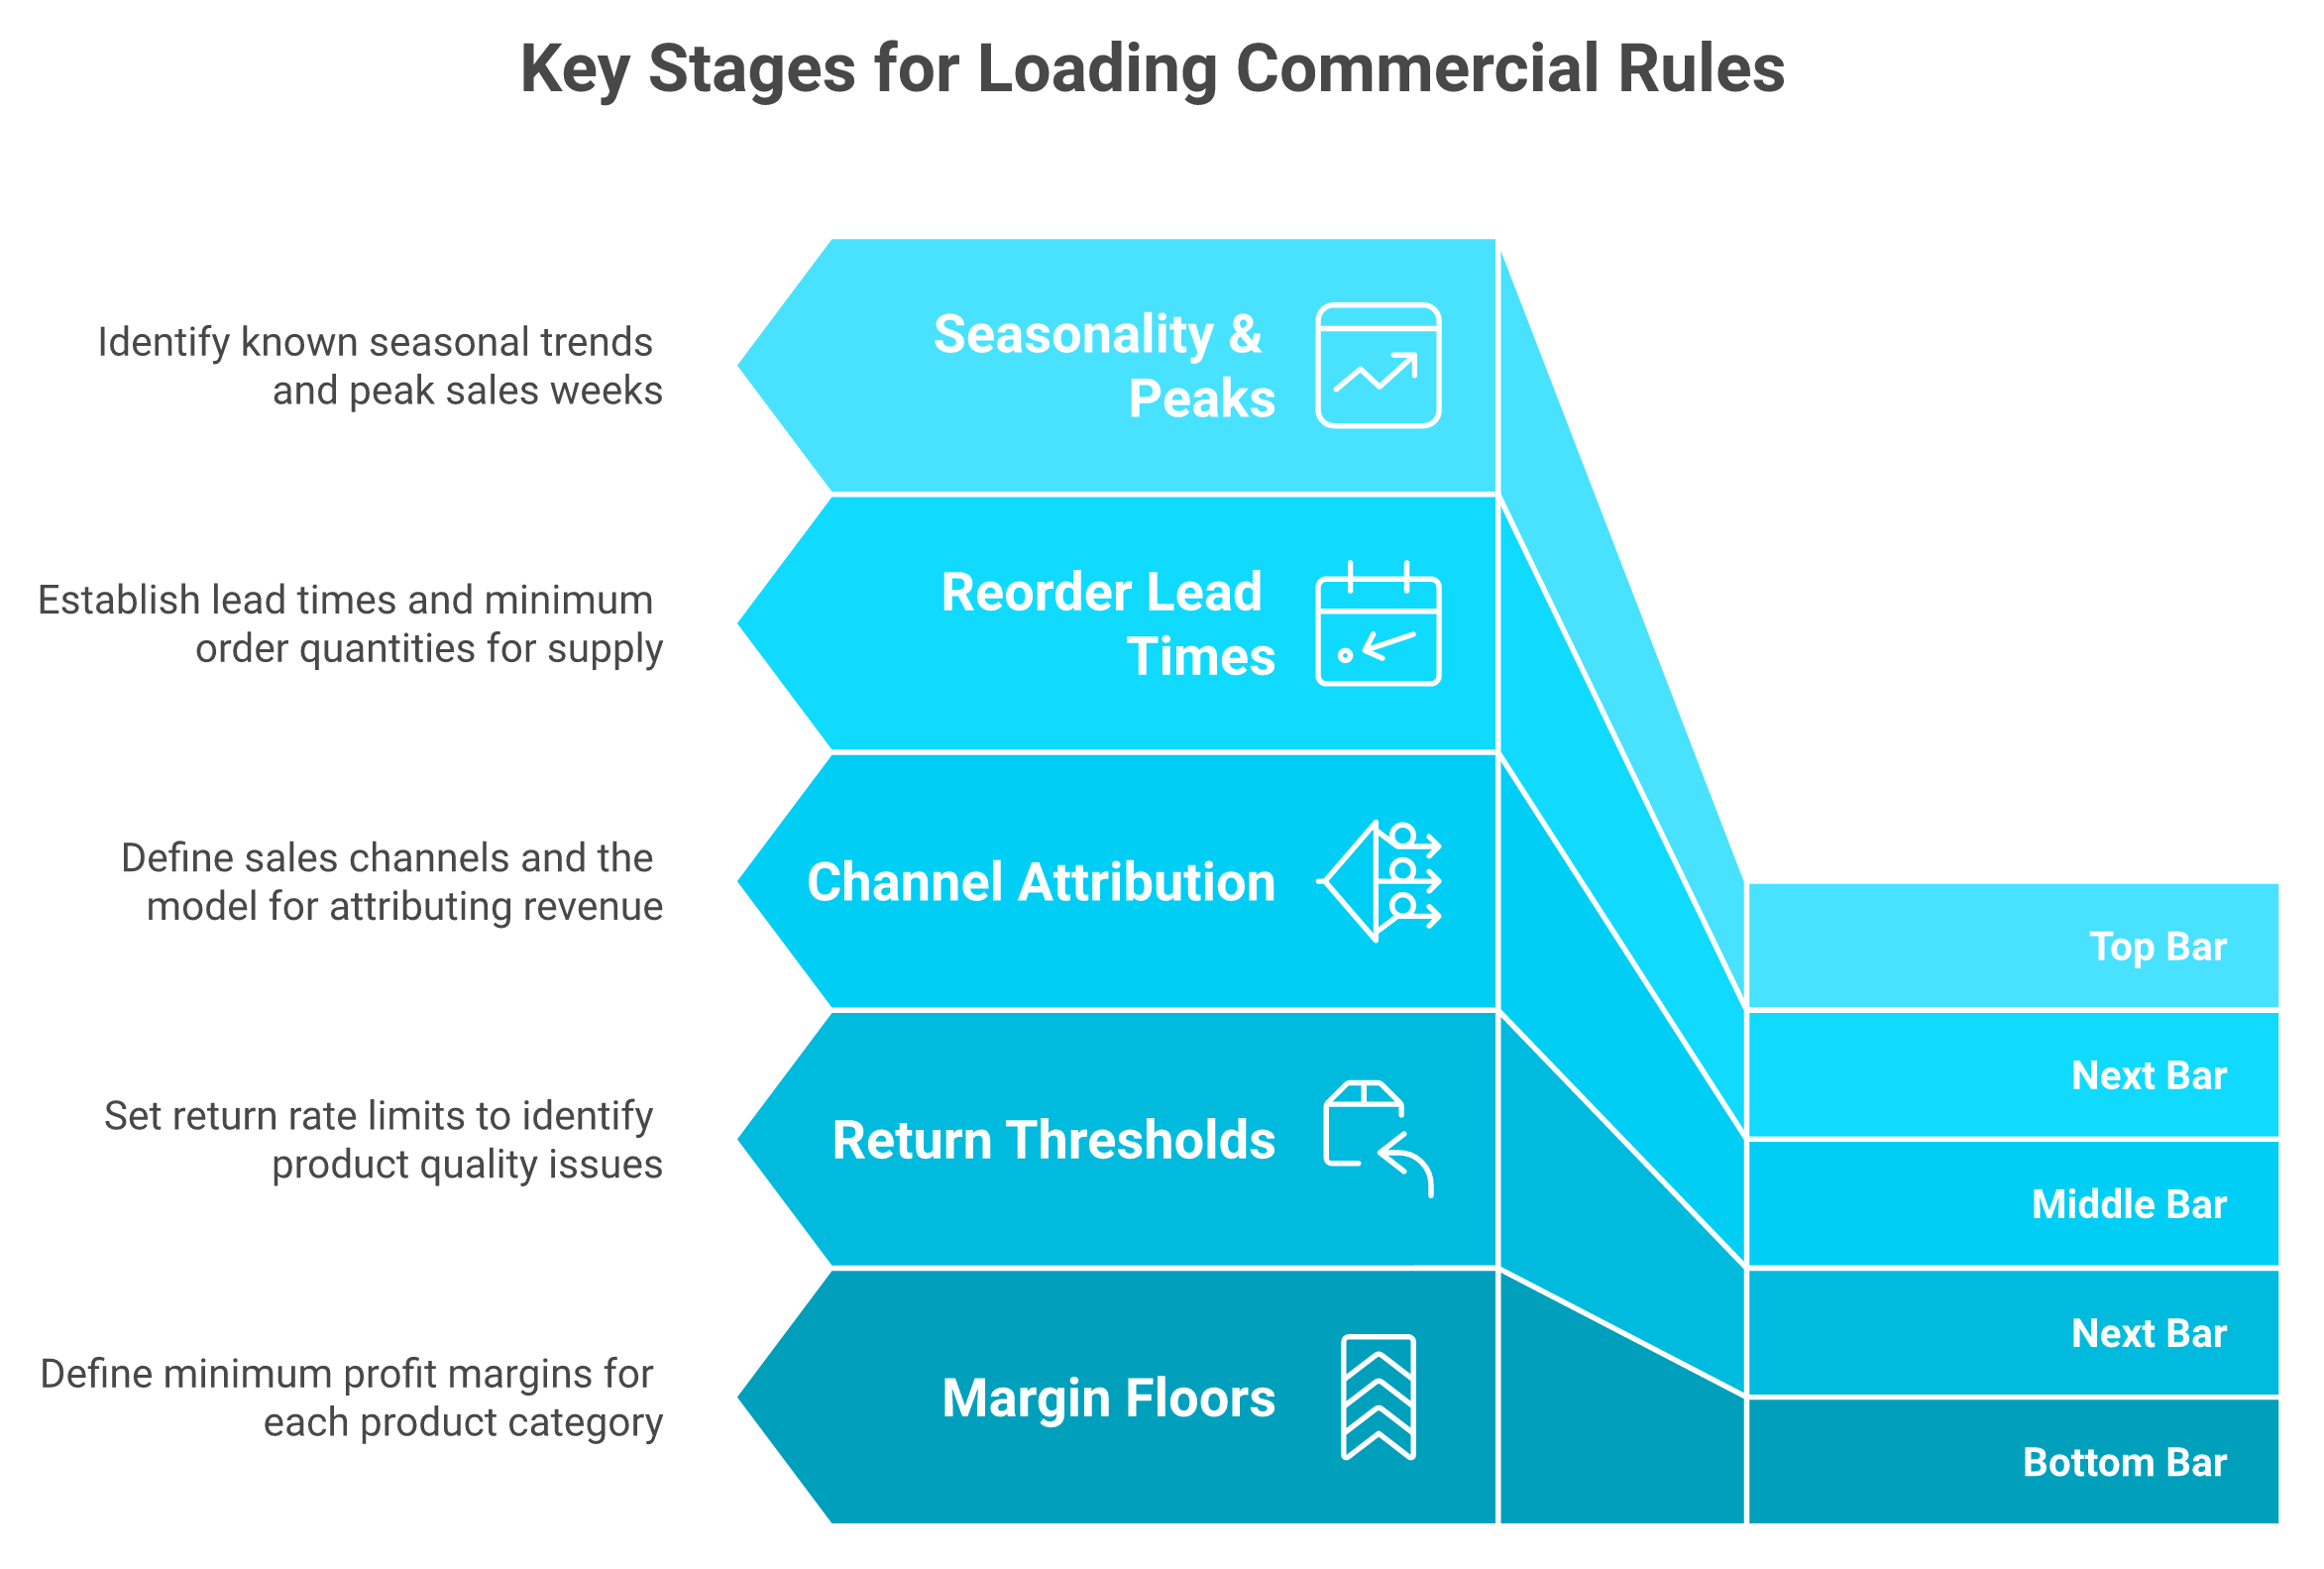
⭐ Load context in this order
Margin floor by category, so recommendations respect your economics.
Return rate thresholds that signal a product problem.
Channel definitions and your house attribution model.
Reorder lead times and minimum order quantities.
Seasonality you already know about, including your peak weeks.
Vague questions return essays. Load these five layers of commercial context first, and the same question returns an action.
Luca AI holds this in its context layer, which is why its answers reference your thresholds instead of generic benchmarks.
Weak version: "How are my products performing?" Strong version: "Which SKUs lost contribution margin last month after allocating returns and support costs, and what should I reprice?"
✅ Five questions worth saving
Which SKUs are below a 20% contribution margin after returns and fulfillment?
What drove the CAC increase last week, by channel and by product?
Which products do first-time buyers purchase before they cross into a second category?
What is my reorder point on the top 20 SKUs given current sell-through?
Which cohort from Q2 has the weakest 90-day repeat rate, and why?
Ask Luca AI any of these in plain English and the output includes the reasoning path, not just the figure, which is what separates conversational analytics tools from a search box.
❌ Why the old way punished curiosity
Legacy reporting made every question a project. Reviewers describe exactly that friction.
"The interface and reporting structure are not very intuitive at first, and finding specific metrics or building custom reports can take time." — Aman S., Performance Marketing Head, Google Analytics G2 Verified Review, 2/5, December 2025
When a question costs an hour, you stop asking. That is the real damage, and it is the case for self-service analytics tools over report tickets.
⏰ The scale shift nobody mentions
A marketer might watch five session recordings a week. One founder I listened to reframed it: what if the system reads 5,000 a day and reports what no person on your team could ever catch?
Luca AI applies that same logic to numbers rather than video, scanning connected sources around the clock and flagging the outlier against your own pattern.
⚠️ One guardrail on tooling
I ban free AI tiers for anything touching customer or sales data, and I think most operators should too. Free tools can train on what you paste.
Luca AI's conversational layer answers product questions directly on your connected store data, so the analysis happens inside the system holding the context. Luca does the reasoning and outlines the steps. You decide which one ships.
Q8. Which AI product analytics tools are worth paying for, and what do they really cost? [toc=8. Tools and Pricing]
Tool choice follows the question you need answered and the pricing shape you can absorb. Luca AI fits ecommerce operators between roughly $1M and $40M in revenue who need product, profit, and channel questions answered across Shopify, Meta, Google, Klaviyo, and accounting data in one place. Triple Whale and Northbeam serve marketing attribution. Polar Analytics and Saras Analytics serve reporting breadth. Mixpanel, Amplitude, and PostHog serve software product teams with an event taxonomy. Event, session, and monthly-tracked-user pricing all scale with traffic rather than with value delivered.
What each tool is actually for
AI Product Analytics Tools Compared by Job and Pricing Shape
Tool
Core job
Pricing shape
Weak spot
Luca AI
Cross-functional intelligence over store data, with recommendations
Subscription tiers
Needs trading history to reason against
Triple Whale
Marketing attribution and media efficiency
Revenue-banded
Does not read your ledger
Polar Analytics
Unified DTC reporting and dashboards
Revenue-banded
Learning curve, support variability
Saras Analytics
Pipelines plus ecommerce reporting
Source and volume based
Pipeline work stays with you
Mixpanel or Amplitude
In-product behavior for software
Event or MTU based
No SKU or margin concept
PostHog
Autocapture, self-hosting
Per event
Technical setup required
⭐ Where the siloed model breaks
Attribution tools answer which ad worked. They cannot answer whether the product was profitable, because cost data lives elsewhere. That gap is the reason buyers keep shortlisting Triple Whale alternatives.
That is architecture, not laziness. A marketing tool without your accounting feed will always report revenue, never contribution margin.
What operators actually say about scope and setup
"Actually, Mixpanel is mainly for analytics and for naming events. When I used it, there was no support for session replays or feature management flags." — Verified user, Mixpanel G2 Verified Review, April 2026
"The pricing communicated when installing the app via Shopify was completely different from the one provided by sales after the installation (which was much higher)." — Maja, Verified buyer, Polar Analytics TrustPilot Verified Review, November 2025
💰 Budget three layers, not one
The subscription, which is the number you compare on a pricing page.
Variable AI cost, because each model interaction carries a per-call cost.
Channel take rates, including the roughly 4% that AI commerce surfaces can add.
Luca AI is a poor fit for pure B2B sellers, marketplace-only operators, stores under roughly $1M in revenue, and enterprises that already employ a data team. I would rather lose that deal than watch a founder pay for pattern recognition with no pattern underneath it.
✅ The comparison that matters
Luca AI's read is that seat pricing is the wrong lens. Price the job instead, because the realistic alternative is a junior ecommerce analyst at a salary, plus the tools that analyst would need.
Luca AI replaces that seat rather than adding another dashboard beside it, reasoning across sales, marketing, product, profit, customer, and operational data in one layer, the way an AI data analyst for ecommerce should. Capital access sits inside the same intelligence when a funding decision surfaces, as one output rather than a separate product.
Q9. How do you know the AI's answer is right, and what stays human? [toc=9. Trusting the Output]
Three tests establish whether an AI analytics answer can be trusted: how often you override the recommendation, whether the system shows the underlying data, and whether its totals reconcile to your accounting records. Human review stays on quality assurance, brand taste, and relationship selling. Luca AI returns the reasoning path and the supporting data alongside each recommendation, which is the condition that makes an override possible. Falling engagement with an AI feature can signal maturity rather than failure, so usage drops need interpretation before anyone calls the tool a loss.
The night a founder stopped trusting the dashboard
A founder doing about $400K a month told me he had quietly stopped opening his reporting tool. Not because it broke. Because he had been burned once and never found out why.
That is how trust dies in this category. Silently, after one wrong number.
❌ The old way made verification impossible
Legacy stacks hand you a figure with no audit trail. Reviewers describe the consequence plainly.
"The free version is not reliable, Google even says though themselves in their privacy policy. 'Sessions' are a vague statistic that do not help define the quality/quantity of your web traffic." — Verified user in Marketing and Advertising, Mid-Market, Google Analytics G2 Verified Review, 0.5/5, August 2018
When you cannot see the work, you cannot check the work. You just develop a feeling about the tool, which is why evaluating AI data agents has to start with traceability.
What changed with reasoning systems
Older tools output a number. Reasoning systems can output the number, the path, and the sources it crossed.
That difference is the whole trust story. Luca AI measures confidence by exposing the chain, so a margin alert shows which cost line moved and in which connected source, rather than asserting that margin fell.
✅ Your three-test scorecard
Three Tests for Trusting an AI Analytics Answer
Test
What you check
Pass condition
Override rate
How often you reject the advice
Trending down over 90 days
Traceability
Can you see the data behind it
Every answer, not some
Reconciliation
Does the total match your books
Within your tolerance
Luca AI's deployments make the second test routine, since the reasoning ships with the answer by default, the way data storytelling tools should work.
⚠️ The QA rule I will not bend
A major bike brand published a $20,000 road bike on its homepage with the rear derailleur rendered on the front wheel. Automated workflow, no human check.
Do not remove the QA step. Do not let the AI be the QA. That holds for creative assets, and for the numbers in your Monday meeting.
AI can hold the analyst seat. Quality assurance, brand taste, and relationship selling still belong to a person.
⭐ Where data logic should lose
Luca AI's read is that the category oversells quantitative certainty. I have watched brands over-index on numbers and sand down the thing people actually bought.
One apparel operator put it well. Fashion is not a one or a zero, it is how the product makes someone feel. Keep your taste. Also keep the phone answered, because older customers hear kindness and buy more, which is a lesson no ecommerce customer analytics report will hand you.
⏰ Reading a usage drop correctly
Mixpanel's 2026 benchmark set recorded AI engagement depth falling 38% year over year in North America, even as AI events grew. Less time in the tool can mean the answer arrived faster.
I could be reading that too strongly. My current view is that declining session time plus stable decision quality equals maturity, not abandonment.
Luca AI operates as the analyst seat, not the approver. It finds the outlier, names the influencing components, explains the cause, and outlines the move. The sign-off stays with you, and that boundary is deliberate.
Q10. When is borrowing against a product decision cheaper than waiting for cash? [toc=10. Funding the Decision]
Borrowing makes sense when the contribution margin on inventory you cannot currently fund exceeds the all-in cost of capital across your cash-conversion cycle. Four metrics decide the comparison: total fee expressed as an annualized rate, time from request to disbursal, whether repayment flexes with revenue, and what the underwriting is secured against. Luca AI surfaces capital access inside the same conversation where the inventory or spend decision appears, priced against observed business performance rather than a point-in-time application, and without equity dilution.
Step 1: Run the borrow or wait test
Five inputs settle this. Write them on one line before you talk to anyone.
Contribution margin per unit on the product you want to stock.
Units you cannot fund from current cash.
Days from purchase order to cash collected, which is your cash-conversion cycle.
Total fee on the capital, annualized.
Probability the product sells through at full price.
💰 The commitment nobody models
Physical inventory is lumpier than founders plan for. One multi-door retailer described picking up a single denim style as a $6,000 commitment across sizes 23 to 32.
That is before a unit sells. Get the sell-through assumption wrong and the margin never arrives, which is the hard edge of ecommerce inventory management.
Step 2: Compare offers on capital metrics only
Flat fees hide the real cost. A 6% fee repaid in 90 days is not a 6% cost of money.
How to Compare Capital Offers on Capital Metrics
Comparison metric
What to ask for
Why it matters
Annualized cost
Fee converted to an APR equivalent
Makes short terms comparable
Time to disbursal
Request to funds in your account
Determines whether you catch the buy window
Repayment structure
Fixed schedule or revenue share
Protects you in a slow month
Underwriting basis
Static application or ongoing performance
Decides whether good months help you
Dilution
Equity taken, if any
Non-dilutive capital keeps the cap table clean
Advance providers price convenience, and their incentive is to deploy the largest amount they can justify. Ask for the annualized figure in writing, and read the structure the way this revenue-based financing breakdown lays it out.
⚠️ Inventory accuracy decides your borrowing power
Lenders underwrite what they can see, and inventory data is where stores are weakest. Retailers lose over $1.1 trillion annually to revenue distortion caused by poor inventory accuracy.
Operators keep running into that same data wall in their own tools.
"I've also reported an issue with inventory levels, as our inventory is multiplied with 6, since we have 6 different shopify stores connected to the same warehouse." — Maja, Verified buyer, Polar Analytics TrustPilot Verified Review, November 2025
Store-level daily profit is a starting point. A funding decision needs SKU-level sell-through and a reliable stock count, which is why cash flow forecasting and inventory data belong in the same system.
❌ When not to borrow
Your product has not proven sell-through at full price.
Your return rate above 15% is unexplained.
You are funding ad spend on a channel with unproven incremental lift.
Your cash-conversion cycle is longer than the repayment term.
I will say the quiet part. Most stores that get into trouble with advances borrowed to scale paid media, not to buy inventory.
✅ The two tracks that have to stay parallel
Inventory runs on one track, cash on the other. When those two diverge, the business derails regardless of how healthy the top line looks.
Luca AI's predictive layer watches reorder points and sell-through against your own history, so the funding question arrives with the numbers already attached.
Luca AI treats capital as one output of the intelligence, not a separate product. Funding is requested inside the conversation where the decision surfaced, underwritten against observed performance over time, and non-dilutive. Luca is not a lender by trade, and I would rather you compare it line by line on rate, speed, and repayment flex, as this Luca AI versus Wayflyer comparison does, than take that on faith.
FAQ's
What is AI product analytics, and how is it different from web analytics or BI?
AI product analytics applies machine learning and language models to product-level data so you can ask questions in plain English, receive anomaly alerts, and get a recommended next step.
The difference sits in the unit of analysis:
Web analytics measures sessions, traffic sources, and conversion rate.
Traditional BI renders whatever you model into dashboards and charts.
Product analytics for software measures feature adoption and retention.
AI product analytics for commerce measures the SKU, with landed cost, return rate, support load, and acquisition cost attached.
For a store, a product decision is simultaneously a marketing, inventory, and cash decision. That means the system has to read accounting and fulfilment data alongside ad platforms, or it will only ever report revenue.
Luca AI connects Shopify, Meta, Google, Klaviyo, accounting tools, 3PL, and support data into one layer, then answers product questions across all of those cost lines at once. We built it that way because no dashboard we tested could join six sources to a single product line. If you want the longer version, our guide to ecommerce business intelligence walks through where the old category stops.
Why does gross margin mislead you on your best-selling product?
Gross margin tells you what a product costs to make. It says nothing about what it costs to sell. Eight variable costs sit between the supplier invoice and real profit.
Landed cost, storage, and pick, pack, and fulfilment
Shipping and payment processing
Returns allocated by SKU return rate
Customer service allocated by ticket volume
SKU-level customer acquisition cost
In one kitchenware audit, a $49.99 knife set showed 72% gross margin. Line by line, the true cost was $71.30 per unit, a $21.31 loss on every order. The allocation almost nobody runs mattered most: that single product drove 42% of all support tickets, which worked out to $1.45 per unit.
The fix was not killing the product. Repricing to $59.99, adding a usage video that cut returns from 18% to 9%, and repackaging to save $0.80 per unit produced a 23% contribution margin within six months.
Luca AI allocates these eight lines to the SKU by reading returns, support volume, landed cost, and spend from your connected sources rather than one platform's report. Our breakdown of contribution margin versus gross margin shows the full calculation.
Which product metrics should we actually track, and which should we drop?
Seven metrics earn a place in a product report, and three should go.
Keep these:
Contribution margin per order per day
SKU-level customer acquisition cost
Marketing efficiency ratio, which is total revenue divided by total ad spend
Stripped average order value, with shipping, handling, and discounts removed
Return rate by SKU
Product category diversity
Inventory-to-cash coverage
Drop these: platform ROAS, blended acquisition cost, and blended average order value. Averages are exactly where an underwater SKU hides.
One cohort finding reordered our own priorities. Category diversity, not purchase frequency, was the leading driver of lifetime value, with buyers who crossed into a second category jumping 50% to 100% in lifetime value. That makes cross-sell sequencing more valuable than another frequency campaign.
Luca AI monitors this metric set against a store's own history and pushes an alert through Slack, email, or app notification when ROAS dips, acquisition cost spikes, or inventory crosses a threshold. For why platform-reported numbers keep flattering themselves, see our analysis of declining platform ROAS versus true profitability.
How much data cleanup is required before AI analytics is useful?
Less than most vendors imply, and in a different order than you have been told. The binding constraint is not volume. It is agreement on definitions.
Settle five questions before connecting anything:
Does revenue mean invoiced sales or demand sales?
Does your retail calendar run 5-5-4 weeks or 4-4-5?
Is landed cost per unit or per shipment?
Is a return counted at request or at refund?
Which attribution model is the house standard?
Raw warehouse logs are not a shortcut. Storing everything and interpreting nothing still leaves you writing custom queries before a decision is possible. We have also watched founders fund multi-million dollar in-house data engines that language models later outperformed.
Luca AI normalizes and standardizes data on ingestion across more than 200 native sources, which removes the manual cleaning, tagging, and SQL maintenance that reverse ETL stacks require. Our honest caveat: stores with messy cost data still owe a week of their own work loading landed cost and fee inputs. Our comparison of reverse ETL tools for ecommerce explains what that older architecture costs to maintain.
How do we know an AI analytics answer is right, and what should stay human?
Three tests settle trust, and they are cheap to run.
Override rate. How often do you reject the recommendation? It should trend down over 90 days.
Traceability. Can you see the underlying data on every answer, not just some?
Reconciliation. Do the totals match your books within your tolerance?
Keep humans on quality assurance, brand taste, and relationship selling. A major bike brand published a $20,000 road bike with the rear derailleur rendered on the front wheel because an automated workflow had no human check. Do not let the AI be the QA.
Read usage drops carefully too. Mixpanel's 2026 benchmark set recorded AI engagement depth falling 38% year over year in North America even as AI events grew, which can mean answers arrived faster rather than that the tool failed.
Luca AI returns the reasoning path and supporting data alongside each recommendation, which is the condition that makes an override possible. We operate as the analyst seat, not the approver: Luca finds the outlier, names the influencing components, and outlines the move, while you sign off. Our framework for evaluating AI data agents covers the full scorecard.
Enjoyed the read? Join our team for a quick 15-minute chat — no pitch, just a real conversation on how we’re rethinking Ecommerce with AI - Luca
Loading Schedule...
Your AI Co-Founder is here.
Here’s why:
Shopify, Meta, Xero - one brain.
"Should I scale?" Answered with real data.
Growth capital. No applications. One click.
Thank you! Your submission has been received! Please book a time slot for the Meeting
Oops! Something went wrong while submitting the form.