Predictive Analytics in Retail and E-commerce, by Industry
13
mins read
TL;DR
Predictive analytics in retail serves four cash decisions: what to buy, how to price, where to place stock, and which customers to keep.
IHL Group puts the global cost of out-of-stocks and overstocks at about $1.73 trillion a year, roughly 6.5% of retail sales.
Amazon forecasts ranges, not single numbers, and reports a 15-fold accuracy gain from moving to quantile neural networks. Smaller stores can copy the range method today.
Each industry predicts something different: size curves in apparel, reorder windows in beauty, daily demand in grocery, end of life in electronics, churn in subscription, and accounts in B2B.
Marketplace sellers must also predict the platform itself: regional placement, aged inventory past 90 days, and fees taken before payout.
Start with one monthly decision, forecast a low, likely, and high range, and test it against actuals for one cycle before trusting any tool.
Predictive analytics in retail uses your past sales, customer behavior, and outside signals to estimate what happens next, so you can buy, price, and place stock before the money is spent. The models are similar everywhere. What you predict, and which signal matters most, changes sharply by industry.
It is the second week of August. A founder selling women's apparel on Shopify and Amazon has a spring purchase order open in one tab and last year's sales export in another. The factory wants a deposit by Friday. Her ops manager asks the only question that matters: "How many of the wide-leg jeans in size 27, and how sure are we?"
That question is what this guide answers, industry by industry. If you want the broader foundations first, start with our guide to predictive analytics for e-commerce. Here, we stay on retail categories: what Amazon actually does, what fashion, beauty, grocery, electronics, subscription, B2B, and marketplace sellers should predict, and how to start without getting burned.
What does predictive analytics actually decide in a retail business?
Predictive analytics in retail uses past sales, customer behavior, and outside signals to estimate what happens next: how many units each SKU (stock keeping unit, one sellable variant) will sell, which customers will return, which orders will come back, and what price clears stock. Its value is the decisions it changes before money is committed, mainly purchase orders, markdowns, and marketing spend.
The cost of guessing wrong
💸 Why retailers care at all
IHL Group's September 2025 study puts the global cost of "inventory distortion" (out-of-stocks plus overstocks) at about $1.73 trillion a year, roughly 6.5% of global retail sales. Out-of-stocks are the larger share. That is money lost to empty shelves and money frozen in boxes nobody wants.
For a small brand, the same problem feels personal. One operator put it bluntly: "forecasting was basically a group chat and a gut feeling" (TaxCloud and Settle, ecommerce ops session). I have heard some version of that line from most founders I sit with.
The four decisions prediction changes
✅ Buy, price, place, keep
Strip away the math, and predictive analytics answers four questions:
The four retail decisions predictive analytics changes
Decision
The question it answers
The cash it protects
Buy
How many units of each SKU should I order, and when?
Cash tied up in stock
Price
When should I mark down, and by how much?
Margin on slow sellers
Place
Which warehouse, store, or channel should hold the stock?
Shipping cost and lost sales
Keep
Which customers are about to leave, and who will reorder?
Repeat revenue and ad spend
Everything else, from dashboards to machine learning models, is plumbing for those four decisions.
⚠️ Inventory and cash run on the same rails
One operator framework I keep coming back to is the "two train tracks." Inventory is one track and cash is the other. If they drift apart, the business derails (TaxCloud and Settle). A forecast that ignores your cash position is only half a forecast.
What data you already have
⭐ You do not need a data team to start
Most Shopify stores already hold the inputs: 12 to 24 months of orders, refunds, product variants, customer IDs, ad spend, and supplier lead times. The problem is that these sit in separate tools. One Shopify merchant on Reddit described the gap plainly:
"Shopify has built-in reports you can export, but on the lower-tier plans you only get the basics and you'll need to log in and pull them manually." Reddit user, r/shopify Reddit Thread
Luca AI's view is that the bottleneck for small retailers is rarely the model. It is getting clean, joined data in front of the person placing the order.
Why the answer changes by industry
⏰ Same math, different clock
A grocery forecast cares about tomorrow's weather. An apparel forecast cares about size curves six months out. A subscription brand cares more about who cancels than about units. That is why the rest of this guide goes industry by industry instead of listing generic use cases.
How is predictive analytics different for store retail and pure e-commerce?
Store retailers predict demand per location and allocate stock between shelves, so local weather, events, and foot traffic dominate. Pure e-commerce brands forecast one pooled inventory across channels, so ad spend, promotions, returns, and marketplace fees dominate. Online sellers get richer behavioral data, such as sessions, carts, and searches, but face longer feedback loops from ocean freight lead times.
What store retailers predict
🏬 Location is the unit of forecasting
A chain with 40 stores does not forecast "how many units." It forecasts how many units per store, per week. The model has to account for a heat wave in one city, a school holiday in another, and a local event that doubles traffic for a weekend.
The hard decision is allocation. Stock sitting in the wrong store is almost as bad as no stock, because moving it costs freight and time.
What pure e-commerce brands predict
💰 One pool, many channels pulling on it
An online brand usually holds one pool of inventory, or a few warehouses, and sells it through Shopify, Amazon, and wholesale at once. The forecast is driven by things the brand controls: ad spend, email campaigns, discounts, and launches. A Meta budget increase on Monday shows up in demand by Wednesday.
Returns matter far more online. Appriss Retail and Deloitte's 2024 report found an online return rate of about 24.5%, against roughly 8.7% for purchases made in store. If a quarter of online units come back, a forecast that ignores returns overstates real demand.
The brand stuck between both
⚠️ Omnichannel needs two models talking
Brands with a few stores and a strong website face both problems. Store allocation and online pooling compete for the same units. Most mid-sized brands I talk to forecast them in separate spreadsheets, then wonder why the warehouse is empty while two stores sit on extra stock.
Here is how the two compare:
Store retail vs pure e-commerce forecasting
Factor
Store retail
Pure e-commerce
Forecast unit
SKU per store, per week
SKU per channel, pooled
Main signals
Weather, events, foot traffic
Ad spend, promos, returns
Return rate (2024)
About 8.7%
About 24.5%
Main risk
Wrong store allocation
Long lead times, over-ordering
Lead times change the model
⏰ Use the median, not the mean
Online brands often import, which means 60 to 90 day lead times. One delayed container skews an average badly. The fix from Kunle Campbell's E-commerce Growth Strategy is simple: base lead times on the median, not the mean, so one outlier does not wreck the plan.
Location still matters online too. One wine retailer described stocking about 3,000 labels in its Hong Kong warehouse for express shipping, with another 7,000 available at a 15 to 20 day lead time (Nicolo Grange, Extra Wine). That is a two-speed forecast inside one business.
Luca AI connects Shopify, Amazon, ad platforms, Klaviyo, and 3PL data into one place, so a single forecast can see every channel pulling on the same stock. Instead of reconciling spreadsheets, you ask Luca AI in plain English which SKUs will run short across all channels in the next 30 days.
How does Amazon use predictive analytics?
Amazon forecasts demand for more than 400 million products with deep learning models that predict a range of outcomes, not one number. It uses those forecasts to buy and place inventory near expected buyers, patented "anticipatory shipping" in 2013, and ranks recommendations from browsing and purchase history. The lesson for smaller stores is the range forecast, not the scale.
Amazon's forecasting history
📈 From textbook methods to deep learning
According to Amazon Science, Amazon's forecasting system in 2008 used standard textbook time series methods. They worked for steady products but struggled with new items and highly seasonal sales. The team then moved through several stages:
2008: classic time series models.
Random forest era: a "Sparse Quantile Random Forest" that still needed hand-built features.
Feed-forward neural network on quantile loss: Amazon reports a "15-fold improvement in forecast accuracy" over the random forest system.
2018: MQ-RNN/CNN, which removed most hand-built features.
2020: MQTransformer, which learns from its own past forecast errors.
The team grew from "ten people and no scientists" to close to 200 people along the way.
Why Amazon forecasts ranges
✅ Quantiles, explained simply
A quantile forecast gives you a range. Instead of "we will sell 500 units," it says "there is a 10% chance we sell under 350 and a 90% chance we sell under 700." Amazon Science describes this move away from single-number forecasts as central to better inventory trade-offs.
This is the part a $3M Shopify brand can copy tomorrow. You do not need a transformer model. You need a low, likely, and high number for your top SKUs, and a rule for which one you buy against.
Anticipatory shipping and recommendations
📦 Shipping before the click
Amazon's anticipatory shipping patent, filed in 2012 and granted in 2013, describes moving packages toward an area before customers order. It draws on signals like past purchases, searches, wish lists, and time spent on a listing. Treat it as a patent, not proof of a running program.
⭐ Behavior changes beat averages
Recommendations run on the same idea. Research by Peter Fader and Wendy Moe on early Amazon data found that changes in a customer's visit frequency predicted conversion better than their baseline (cited in Kunle Campbell's E-commerce Growth Strategy). A customer visiting more often than usual is warming up.
What it means if you sell on Amazon
❌ Amazon's prediction serves Amazon
Amazon's models also decide where your FBA stock sits, and sellers do not always agree with the result. One seller on r/FulfillmentByAmazon reported that their last two shipments were sent to East and Central facilities, with nothing going to the West. Commenters noted how little control sellers have over placement.
"Being out of stock is the worst thing that can possibly happen to your new business because you're essentially out of business when you can't take orders." Ryan Daniel Moran, 12 Months to $1 Million
Luca AI's read is that the lesson from Amazon is the method, not the scale: forecast a range, measure your error, and act on the high or low end deliberately. Luca AI can compare your forecast range against actual Shopify and Amazon sales each week, so you see your own error rate instead of guessing it.
What should fashion and apparel brands predict?
Same $6,000 of denim: buying to the size curve sells 24 more units at full price.
Apparel brands should predict sell-through by size, not only by style, because one style is eight to ten SKUs. The highest-value predictions are early sell-through velocity, size-curve demand, and return probability. Trend-driven fashion benefits from small test batches, where the first two weeks of sales tell you more than any pre-season model.
Why one style is really ten bets
💸 The size-run commitment
Jen Van Wart, who runs the boutique Twigs, described picking up one denim style across sizes 23 to 32 as "a $6,000 commitment" (operator interview). If the style misses, or the size mix is wrong, the cash sits on a rack until markdown.
A fashion founder on Reddit named the same pain from the analytics side:
"I run a fashion brand on Shopify and built an analytics app after getting frustrated with how hard it is to understand product-level performance, especially once returns and stock risk come into play." Reddit user, r/ShopifyAppDev Reddit Thread
A worked example: the size curve
✅ Example: $6,000 of denim, two ways
This is an illustrative example. Say one style costs $30 a unit, so $6,000 buys 200 units across 10 sizes. Full-price demand by size turns out to be 6, 10, 16, 24, 28, 28, 24, 16, 10, and 8 units for sizes 23 to 32, a total of 170.
Flat buy (20 per size): you sell 146 units. You stock out on sizes 26 to 29, missing 24 sales, and strand 54 units in edge sizes. That is $1,620 of cost waiting for markdown.
Curve buy (7, 12, 19, 28, 33, 33, 28, 19, 12, 9): you sell all 170. Only 30 units, or $900, are left over.
Same $6,000. The size curve alone moves 24 full-price sales and $720 of stranded cost.
Test small, then chase winners
⏰ The micro-batch model
Shein made this famous. Coresight Research, cited in Kunle Campbell's book, reports that if a design sells out quickly, Shein places a large order, and if it does not, it sells the rest and drops the design. Smaller brands can copy the logic with 100 to 500 unit test runs and a clear sell-through threshold after two weeks.
⚠️ Returns are part of demand
Fast fashion return rates can reach 25% in some segments (Kunle Campbell). Across all online retail, Appriss and Deloitte put returns near 24.5%. Forecast net sales after returns, by size, because the wrong fit drives most apparel returns.
Where human buyers still win
❌ Do not let the model pick the taste
Ken Price, CEO of Blake Mill, warned that his team "fell into the trap of getting too data driven and losing touch with the emotional side" of the business. I agree with him. Models are good at depth and size mix. They are poor at deciding which print will matter next season.
Luca AI fits the size-curve job, not the taste job. You can ask Luca AI in plain English which sizes of last season's styles sold through before markdown and which returned most. That gives your buyer a size curve from your own Shopify data before the next deposit is due.
How do beauty and personal care brands use predictive analytics?
Beauty brands use predictive analytics mostly to time replenishment. A product used daily runs out on a predictable schedule, so the reorder reminder can land before the customer shops elsewhere. Brands also forecast demand by shade or variant, and they personalize recommendations, which McKinsey estimates typically lifts revenue by 10 to 15%.
The replenishment window
⏰ Consumption is a clock you can read
Beauty is one of the few categories where you can roughly calculate when a customer will need you again. A cleanser, a serum, or a deodorant gets used at a steady rate. That makes the "replenishment window," the days between purchase and running out, the most useful prediction a beauty brand can make.
Most brands send the same reminder email on day 30 to everyone. That is a guess dressed up as a flow. The better move is to predict each product's window from your own repeat-order data.
✅ Example: timing a serum reorder
This is an illustrative example. A 30 ml serum is used at about 0.5 ml a day, so one bottle lasts around 60 days. Your order history shows the median repeat buyer reorders on day 54, a little early, to avoid running dry.
Send the reminder around day 45 to 48, ahead of the median reorder.
Flag anyone past day 70 with no reorder as at risk.
Compare each new cohort's median reorder day with the last one.
If the median creeps from 54 to 66 days, something changed. It might be a competitor, a price rise, or a formula complaint. The prediction tells you where to look.
Shades, variants, and launches
💄 One product, many SKUs
A foundation launched in 30 shades is 30 forecasts. The middle shades usually carry most of the volume, while the edges sell slowly but matter to the customers who need them. Forecast each shade from early sell-through and reorder the core faster than the edges.
The same logic as apparel sizes applies here. Spread a flat buy across every shade, and cash ends up stranded at the edges while the core sells out.
Personalization, and where it gets creepy
⭐ Recommendations that respect the reader
McKinsey's research finds personalization typically drives a 10 to 15% revenue lift, with a company-level range of 5 to 25%. In beauty, the cleanest version is simple: recommend what pairs with what the customer already buys, based on real basket data.
❌ The Target lesson
There is a line, though. Target famously built a pregnancy prediction score from purchases like unscented lotion and supplements, then sent maternity coupons to a teenager before her family knew (Kashmir Hill, Forbes, cited in Kunle Campbell's E-commerce Growth Strategy). In beauty and personal care, predictions can touch health and body image. Use them to time reorders and suggest pairings. Do not make the customer feel watched.
What to do this month
💰 Start with your top three repeat products
Pull 12 months of orders for your three most repeated SKUs. Calculate the median days between first and second order for each. That one number per product will improve your reminder timing more than any new app.
Luca AI tracks this for you as a cohort pattern rather than a one-off report. Luca AI watches each repeat cohort's reorder gap across Shopify and Klaviyo data, and alerts you when the gap stretches past its usual range. You see the drift in reorder timing weeks before it shows up as lower revenue.
What does grocery and food retail need from predictive analytics?
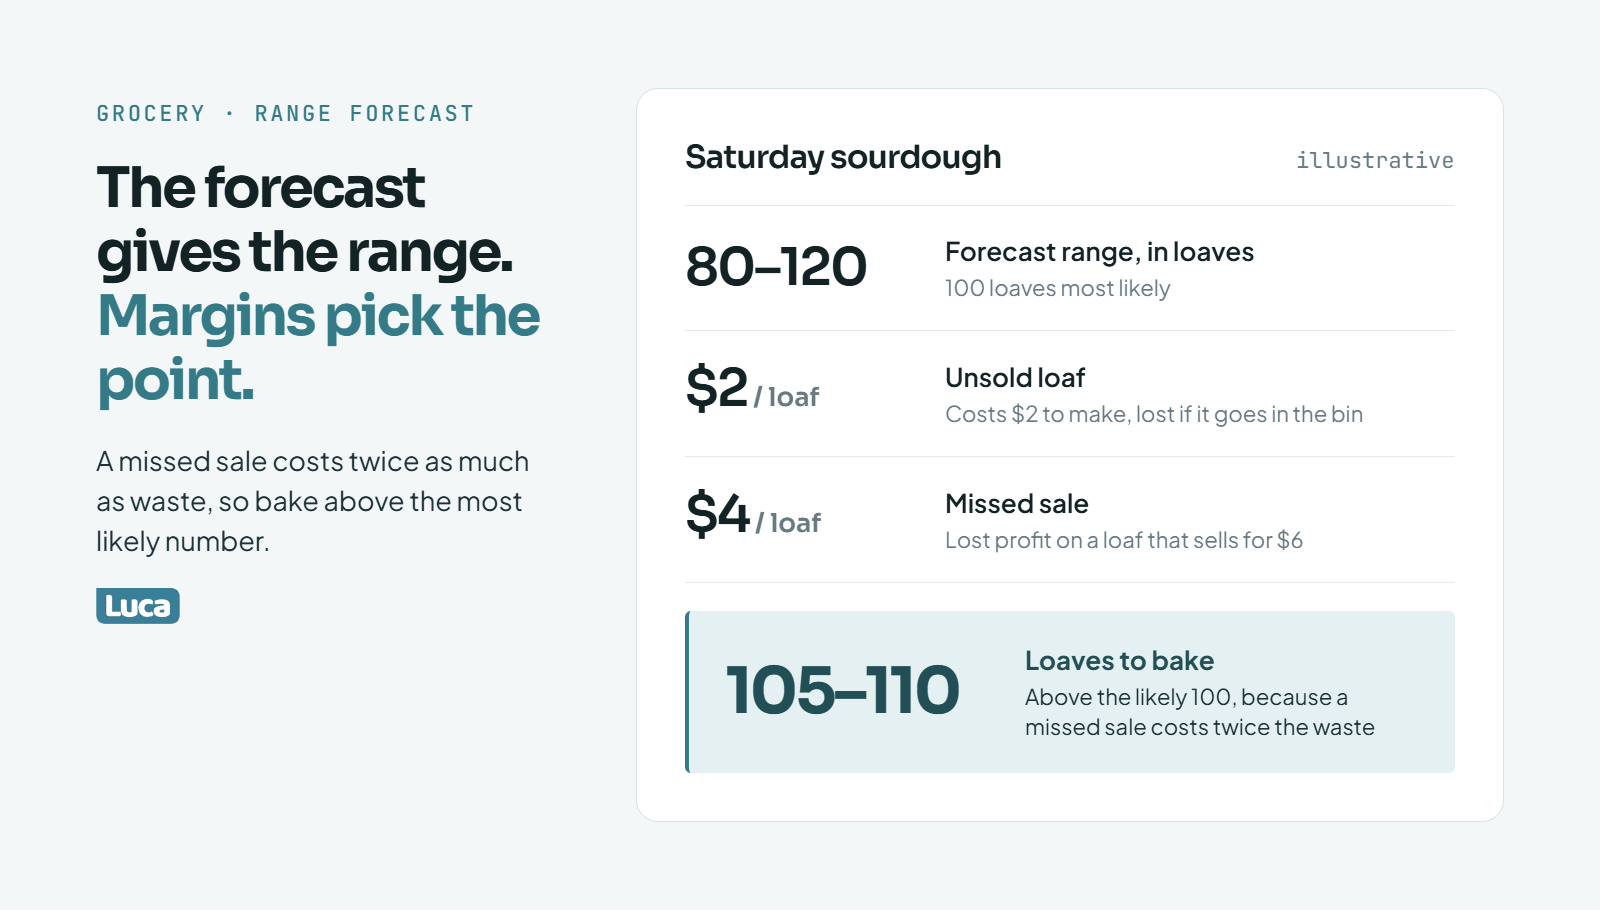
The forecast gives the range; your margins decide which point in it to bake against.
Grocery and food retailers need daily or weekly forecasts, because perishable stock loses value in days. Weather, holidays, local events, and promotions drive the forecast. The core decision is the trade-off between waste and empty shelves. Online food brands add shelf life and lot dates to the forecast, so the oldest sellable stock ships first.
The perishability clock
⏰ Days, not months
An apparel brand forecasts a season. A grocer forecasts tomorrow. Fresh produce, bakery, dairy, and prepared food all lose value fast, so the forecast horizon shrinks to days and the cost of error lands quickly.
The scale of the problem is large. ReFED reports that US retailers generated 3.98 million tons of surplus food in 2024. The largest single cause was date label concerns, at 1.82 million tons or 45.8%. That is inventory that aged out before it sold.
❌ Both errors cost money
Empty shelves cost a sale today and sometimes a customer for good. Overstock on perishables does not wait for a markdown season. It goes in the bin. IHL Group's research shows out-of-stocks are the bigger share of retail inventory losses overall, but in fresh food, waste hits margin just as hard.
The signals that move food demand
🌦️ Weather, calendar, and promotions
Grocery demand reacts to things outside the store:
Weather: a hot weekend lifts drinks, ice cream, and salad. A cold snap lifts soup.
Calendar: public holidays, school terms, paydays, and religious festivals.
Local events: a game day or a street fair near the store.
Promotions: your own and your competitors', which pull demand forward.
This is an illustrative example. A bakery forecasts Saturday demand for sourdough at 80 to 120 loaves, with 100 most likely. Each loaf costs $2 to make and sells for $6. An unsold loaf is a $2 loss. A missed sale is a $4 lost profit.
Because a missed sale costs twice as much as waste, it makes sense to bake above the most likely number, around 105 to 110 loaves. If the numbers were reversed, you would bake near the low end. The forecast gives the range. Your margins pick the point.
Online food and DTC snacks
📦 Shelf life is part of the forecast
Online food brands, such as coffee, snacks, and supplements, have longer shelf lives but still carry expiry dates. Their forecast needs lot dates, so stock ships first in, first out, and slow flavors get flagged before they age past sellable.
Ryan Daniel Moran put the stakes plainly in 12 Months to $1 Million: being out of stock means "you're essentially out of business when you can't take orders." For a food brand, over-ordering is the mirror image of that risk.
Luca AI fits the online side of this problem. You can ask Luca AI which flavors or SKUs will hit a set number of days of cover before their next production run, and get an alert when a lot is aging faster than it sells. Luca AI shows the trade-off. You still decide how much to produce.
How do electronics retailers forecast around launches and price drops?
Electronics retailers forecast around product life cycles: a spike at launch, a plateau, and a cliff when the next model is announced. Prediction matters most at end of life, because unsold units lose value quickly once a successor ships. Launch calendars, price history, and accessory attach rates matter more here than smooth seasonal patterns.
The life-cycle shape
📈 Spike, plateau, cliff
Most electronics follow the same curve. Demand jumps at launch, settles into a plateau, then drops hard when the next version is announced. Phones, headphones, cameras, and gaming accessories all behave this way.
That shape breaks the usual seasonal forecast. A model that averages last year's months will badly overstate demand for a product six weeks before its successor ships.
⚠️ New products have no history
Forecasting a new product is hard even for the best teams. Amazon Science notes that Amazon's 2008 forecasting system struggled specifically with new products and highly seasonal sales. A small electronics retailer has the same problem with less data.
Forecasting new products by analog
✅ Borrow the curve from a cousin
The practical fix is forecasting by analog. You pick a past product that launched in a similar way, at a similar price, to a similar audience. Then you scale its launch curve to the new product's expected volume.
Use the last model of the same product line when you have one.
Adjust for price, because a higher price usually flattens the launch spike.
Track the first two weeks closely, then switch to the new product's own data.
Accessories ride the main product
🔌 Attach rate is a free forecast
Cases, cables, chargers, and screen protectors sell as a share of the main product. That share is the "attach rate." If one in four headphone buyers also buys a case, your case forecast is mostly your headphone forecast multiplied by 0.25.
This is one of the most reliable predictions in retail, and it costs almost nothing to calculate. It also warns you early. When a model is being replaced, its accessories fall off the same cliff.
Timing the end of life
💸 Forecast the cliff, not the spike
Here is my view, and I hold it firmly: most electronics retailers spend their forecasting effort on the launch. The money is lost at the other end. Every week you hold old-model stock after a successor is announced, its resale value drops.
✅ Example: the markdown decision
This is an illustrative example. You hold 300 units of last year's earbuds, selling 40 a week at full price. A successor is announced for eight weeks out. At 40 a week, you clear 320 units in eight weeks, so you are just about safe.
If the forecast shows sales dropping to 20 a week after the announcement, you will clear only 160. The other 140 units need a markdown plan now, while they still sell at a modest discount.
Luca AI helps by watching sell-through against your forecast weekly. You can ask Luca AI how many weeks of cover remain on each older model at its current rate of sale, and get an alert when weeks of cover pass a successor's launch date. You then choose the markdown, with the numbers already in front of you.
What should subscription and DTC brands predict?
Subscription and DTC brands gain most from predicting customers rather than units: who is about to cancel, what each new cohort will be worth, and when repeat orders arrive as cash. Changes in behavior beat static averages. A loyal customer whose visits slow down is a bigger risk than an occasional buyer whose visits speed up.
Predict the customer first
⭐ Units follow customers
For a subscription coffee brand or a supplement company, next month's units are mostly next month's active subscribers. Predict who stays and who leaves, and the inventory forecast nearly writes itself. Predict units directly, and you miss the cause.
This is the core argument of the section, and it rests on three pillars: churn signals, cohort value, and cash timing.
Pillar 1: churn signals
⚠️ Change beats the average
Research by Peter Fader and Wendy Moe, using early Amazon and CDNOW data, found that changes in a customer's visit frequency predicted conversion beyond their baseline frequency (cited in Kunle Campbell's E-commerce Growth Strategy). A frequent visitor who is slowing down is less likely to buy. A rare visitor who is speeding up is more likely to buy.
Subscription brands can apply this directly. Watch for changes, not levels:
Skipped or paused deliveries, especially two in a row.
Fewer logins or email opens than that customer's own normal.
Support tickets about results, taste, or fit.
Failed payments, which cause cancellations the customer never chose.
Pillar 2: cohort value
💰 What is this month's cohort worth?
CLV (customer lifetime value) is the total gross profit a customer brings over time. Average CLV hides the truth, because a cohort acquired with a 40% discount behaves differently from one acquired at full price. Predict CLV by cohort, meaning customers grouped by the month or campaign they joined.
That answer changes how much you can afford to spend on ads. If January's cohort is tracking 20% below October's, your acquisition cost ceiling should drop too.
Pillar 3: cash timing
💸 Repeat orders are a cash forecast
Subscription revenue arrives on a schedule, which means it can fund inventory on a schedule. But only if you predict retention honestly. An operator from Settle, the inventory finance tool, described inventory and cash as "two train tracks" that must run in parallel. A churn spike derails both at once.
What operators say about the tools
Many founders have tried to build this themselves and been disappointed by dashboards:
"70 80% of the real questions that clients have cannot possibly be answered through the dashboards." Germán Loewe, CEO of Shalion (operator interview)
"We spent about $10 million of our money in the company to build a system that is able to take the data and turn it into meaning... LLM come and they are 10 times better." Ari Tulla, CEO of Elo Health (operator interview)
Luca AI's read is that churn prediction fails for small brands because the signals live in separate tools. Luca AI connects Shopify, Klaviyo, subscription apps, and support data, watches each cohort's reorder and skip behavior, and alerts you when a cohort drifts from its own pattern. You can then ask Luca AI in plain English why it drifted, and which customers to contact first.
How does predictive analytics work in B2B e-commerce?
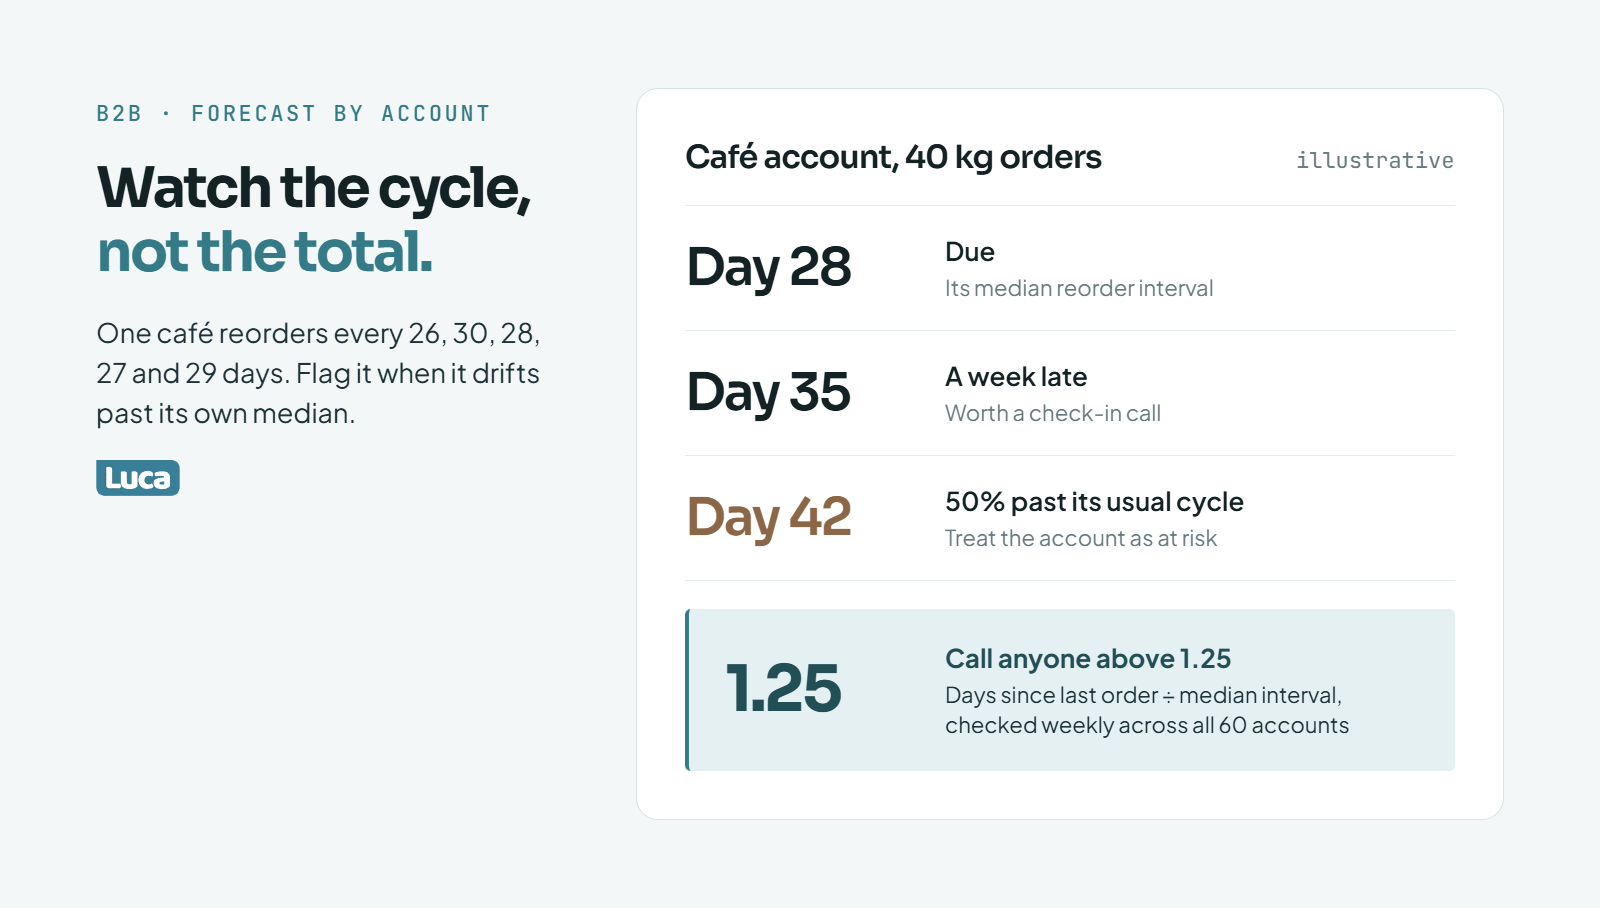
Forecast B2B demand account by account and flag anyone drifting past their own cycle.
B2B e-commerce forecasting works account by account. A few large buyers reorder on rough cycles, so predicting each account's next order date and size beats forecasting total units. Reorder intervals, quote activity, and contract terms are the useful signals. The model should flag any account that slips past its usual cycle, because one quiet account can be a big share of revenue.
Why B2B demand looks lumpy
📦 A few big orders, not many small ones
A DTC brand sees hundreds of small orders a day, which smooths out into a fairly steady curve. A B2B seller, such as a wholesale supplier, a parts distributor, or a brand selling to retailers, sees a handful of large orders. One distributor ordering 2,000 units in a week makes the chart spike.
Forecasting total units from that history is close to useless. The spikes are not random. They are specific accounts on their own schedules.
⚠️ Concentration is the real risk
In many B2B businesses, the top ten accounts carry a large share of revenue. If one of them goes quiet, the total forecast misses it until the quarter is gone. That is why the unit of forecasting in B2B is the account, not the SKU.
Forecasting by account
✅ Example: the overdue account
This is an illustrative example. A café supply brand sells coffee beans to 60 cafés. One café's order history shows reorders every 26, 30, 28, 27, and 29 days. The median interval is 28 days, and the typical order is 40 kg.
On day 28 after its last order, the café is due.
By day 35, it is a week late, which is worth a check-in call.
By day 42, it is 50% past its usual cycle. Treat it as at risk.
Run that check across all 60 accounts every week, and you get a short list of who to call, ranked by order size. That list is more useful than any total-volume chart.
Signals beyond order history
📝 Quotes, contracts, and price
B2B buyers leave clues before they order. Quote requests, sample orders, contract renewal dates, and changes in order size all predict the next purchase. A buyer who asks for a quote on a larger volume is often planning ahead.
Jen Van Wart, who runs the boutique Twigs, described spending "three weeks leading up to" an important buying cycle analyzing "what vendors performed well, what vendors didn't" (operator interview). That is a B2B forecast done by hand, from the buyer's side.
❌ Listed prices are not real prices
Price data in B2B needs care. Thomas Hear, CEO of the wine marketplace UWine, pointed out that prices scraped from the internet are not the same as prices that actually transact:
"The problem is when a pricing is shown on internet it doesn't mean it is transactional, you know, selling the real selling prices." Thomas Hear, CEO of UWine (operator interview)
Forecast with your own invoiced prices and discounts. Use listed prices only as a rough market signal.
What to do this week
💰 Build the account watch list
Export 12 to 24 months of orders by account. Calculate each account's median days between orders and median order size. Sort by "days since last order divided by median interval," and call anyone above 1.25.
Luca AI fits this job well because it sits over your order data rather than a sales CRM alone. You can ask Luca AI which wholesale accounts are past their usual reorder interval, ranked by typical order value. Luca AI can then send that list to Slack or email every Monday, so nobody has to rebuild it.
What do marketplace sellers need to predict on Amazon and similar platforms?
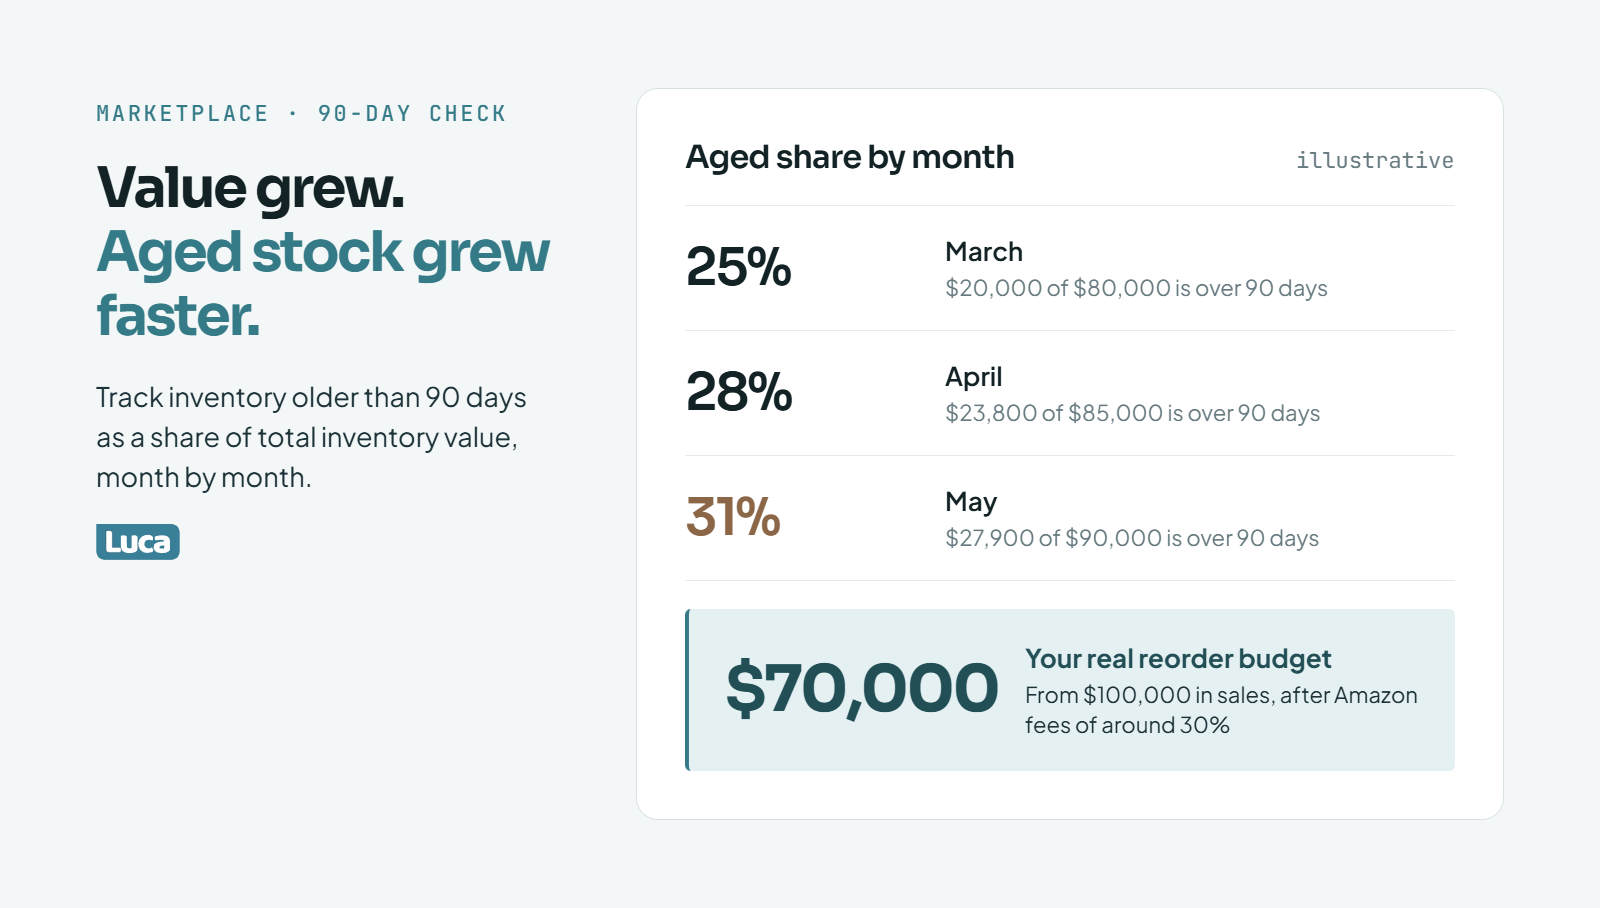
When the 90-day aged share rises, your buys are outrunning your sell-through.
Marketplace sellers need to predict what the platform will do with their inventory, not just what customers will buy. That means forecasting restock limits, regional placement, inventory aging past 90 days, and the fees taken before payout. Sellers who plan cash from net payouts and check aged inventory weekly avoid most marketplace surprises.
The platform is part of the forecast
❌ Amazon's prediction serves Amazon
Amazon uses its own forecasts to decide where your FBA (Fulfillment by Amazon) stock goes. Sellers often disagree with the outcome. One seller on r/FulfillmentByAmazon reported that their last two shipments went to East and Central facilities, with nothing reaching the West, and asked whether to ship to all three regions.
Capacity adds another layer. Supply Chain Dive reported in November 2024 that capacity limits were slowing seller inventory at some West Coast facilities, with goods rerouted to other regions. One seller had only 50 units available in FBA while thousands sat in Amazon Warehousing and Distribution (AWD).
"They can't let this keep going, because you're just going to have more and more sellers leave the platform." Joe Stefani, founder of Desert Cactus, quoted in Supply Chain Dive
⚠️ Centralized vs regional shipping
Operators disagree on the fix. Some let Amazon distribute stock automatically. Others pay more freight to send stock directly to several regional centers, so every region has buy box availability from day one (Wizards of Ecom). My view: if one region drives a big share of your sales, do not leave its stock to chance.
The 90-day aged inventory check
✅ Example: is your inventory aging?
Robyn Johnson, cited in Cyndi Thomason's Profit First for Ecommerce Sellers, recommends tracking inventory older than 90 days as a share of total inventory value. Pull the Inventory Age report from Seller Central, add each SKU's cost, and divide.
This is an illustrative example:
Example: 90-day aged inventory share by month
Month
Total inventory value
Value over 90 days
Share
March
$80,000
$20,000
25%
April
$85,000
$23,800
28%
May
$90,000
$27,900
31%
Total value grew, but the aged share grew faster. In Johnson's framing, a share that is flat or rising means you are not scaling correctly. Your buys are outrunning your sell-through.
Plan cash from net payouts
💸 Gross sales are not your cash
Cyndi Thomason notes that Amazon fees take around 30% of sales before money reaches your bank. If you sold $100,000 last month, plan your next inventory buy from about $70,000, not $100,000. A forecast built on gross sales overstates what you can afford to reorder.
Protect the units you send
📦 Single-SKU cartons and smaller, frequent shipments
Lost inventory is a forecasting problem too, because missing units throw off your counts. Seller Carole Rains switched to shipping one SKU per box, because "it's a lot harder for Amazon to misplace your inventory into the wrong SKU if the box only contains one thing" (Profit First for Ecommerce Sellers). She also preferred smaller, more frequent shipments.
Luca AI does not control where Amazon places your stock. What Luca AI can do is join your Amazon and Shopify sales with inventory data, then alert you when days of cover in a channel drop below your reorder lead time. You can also ask Luca AI each month what share of your inventory value is older than 90 days.
How do you start with predictive analytics in your industry?
Start with one decision you already make every month, such as the next purchase order for your top 20 SKUs. Pull 12 to 24 months of clean sales history, forecast a low, likely, and high range, and compare it to actuals for one cycle before trusting it. Add industry-specific signals only after the baseline has earned your trust.
Your industry at a glance
⭐ What to predict first
Predictive analytics by industry: what to predict first
Industry
What to predict first
Key signal
Common failure
Fashion and apparel
Sell-through by size
First two weeks of sales
Flat size buys
Beauty
Replenishment window
Median days to reorder
Same reminder day for everyone
Grocery and food
Daily or weekly demand
Weather, holidays, promotions
Ignoring waste cost
Electronics
End-of-life demand
Successor launch date
Forecasting only the launch
Subscription and DTC
Churn by cohort
Changes in skips and visits
Using average CLV
B2B e-commerce
Next order by account
Reorder interval
Forecasting total units
Marketplaces
Aged inventory and placement
Inventory Age report
Planning cash from gross sales
A first 30 days that fits a small team
✅ Step 1: pick one decision
Choose a decision you make on a schedule, such as the monthly reorder for your top 20 SKUs. Do not start with "forecast everything." One decision gives you a clear way to judge whether the forecast helped.
✅ Step 2: clean the history
Pull 12 to 24 months of orders. Remove obvious one-offs, such as a single wholesale order in a DTC history. Mark the weeks you were out of stock, because zero sales during a stockout is not zero demand. Use median lead times, not averages.
✅ Step 3: forecast a range
For each SKU, write down a low, likely, and high number for next month. Shopify's own forecasting guide suggests starting with a simple baseline and comparing it to actuals before adding complexity. Decide in advance which number you buy against, based on margin and cash.
✅ Step 4: test for one cycle
Hold the forecast for one month, then compare it to what actually sold. Note where you were wrong and why. Only then add the signals from the table above.
Why trust has to be earned
❌ Tools fail when nobody checks them
Deb Farnworth-Wood, CEO of Issada, described trying her inventory system's built-in AI forecasting for about six months:
"It was rubbish... we couldn't rely on it... we had it definitely hallucinating and telling fibs, and we had to shut it down." Deb Farnworth-Wood, CEO of Issada (operator interview)
"Hard to tell which ones are actually good. Pricing feels expensive long-term. Reviews are mixed and sometimes feel fake." Reddit user, r/ShopifyeCommerce Reddit Thread
💰 Make every order an asymmetric bet
The Hammersley Brothers describe stock ordering as a roulette table, and their fix is to make each order "an asymmetrical bet": heads you win a lot, tails you do not lose much. A range forecast is how you do that. Buy deep on SKUs where the low case still sells through. Buy shallow where the high case is a hope.
Cyndi Thomason, Profit First for Ecommerce Sellers (book).
Ryan Daniel Moran, 12 Months to $1 Million (book).
Recorded operator interviews: Jen Van Wart (Twigs), Ken Price (Blake Mill), Deb Farnworth-Wood (Issada), Thomas Hear (UWine), Nicolo Grange (Extra Wine), Germán Loewe (Shalion), Ari Tulla (Elo Health), and the TaxCloud and Settle ecommerce ops session.
FAQ's
What are the most common examples of predictive analytics in retail?
We see the same handful of predictions earn their keep across almost every retail store we work with. Each one maps to a decision that moves cash.
Demand forecasting: how many units of each SKU will sell next week or next season, which drives purchase orders.
Replenishment timing: when a repeat customer will run out, which drives reminder emails in beauty and consumables.
Markdown timing: when a slow seller or an older model needs a price cut before its value drops.
Churn prediction: which subscribers or regular buyers are drifting away, based on changes in their own behavior.
Return prediction: which products, sizes, or customers are most likely to send orders back.
The examples are common. What changes by industry is which one matters most. An apparel brand gets the most from size-curve forecasting, while a subscription brand gets more from churn signals.
Luca AI runs these predictions over connected Shopify, ad, and inventory data and pushes an alert when something drifts from its normal pattern. If you want the wider view of how these predictions fit an online store, our guide to predictive analytics for e-commerce covers the foundations.
How accurate is predictive analytics for retail demand forecasting?
We are careful with this one, because accuracy depends heavily on the product, the time horizon, and how clean your history is. There is no honest single number that applies to every store.
What we can say is how accuracy improves:
Forecast ranges, not points. Amazon Science reports a 15-fold accuracy improvement when Amazon moved to neural networks that forecast quantiles, meaning a range of likely outcomes.
Fix the history first. Weeks when you were out of stock show zero sales, not zero demand. Leaving them in drags every forecast down.
Use median lead times. One late container should not distort your whole plan.
Measure your own error. Compare last month's forecast with actual sales by SKU. That number is your real accuracy.
Steady best sellers forecast well. New products, trend items, and launch spikes forecast poorly for everyone, including the largest retailers.
Luca AI compares your forecast range against actual sales each week and flags SKUs that keep landing outside it, so you see where your forecast is weak. For the mechanics of forecasting demand with AI, see our guide to AI demand forecasting for e-commerce.
Can a small Shopify store use predictive analytics without a data team?
Yes, and we would argue small stores have more to gain, because one bad purchase order hurts a $2M brand far more than a big chain. You do not need a data scientist. You need clean data and one clear decision.
Here is the starting point we recommend:
Pick one decision you already make monthly, such as reordering your top 20 SKUs.
Pull 12 to 24 months of orders and mark the weeks you were out of stock.
Write down a low, likely, and high forecast for each SKU.
Compare it to actual sales after one month before trusting it.
The hard part for small teams is not the math. It is that Shopify, ad platforms, email, and your 3PL each hold a piece of the picture, and someone has to join them every week.
Luca AI was built for this stage. Luca AI connects those sources, normalizes the data on ingestion, and lets you ask forecasting questions in plain English instead of building spreadsheets. It also sends alerts when stock falls below a threshold you set. You can see the kinds of questions operators ask on our use cases page.
What data do you need for predictive analytics in retail?
We find most stores already own the data they need. It is usually scattered rather than missing.
The core inputs are:
Order history: 12 to 24 months by SKU, with dates, quantities, discounts, and refunds.
Inventory records: stock on hand by location, plus the days you were out of stock.
Supplier lead times: ideally the median of your last several orders.
Marketing data: ad spend, promotions, and email campaigns, since these pull demand forward.
Customer data: customer IDs and repeat-order timing, for churn and replenishment predictions.
Some industries need extra signals. Grocery adds weather and local events. Electronics adds launch calendars. Marketplace sellers add the Inventory Age report and fee data from the platform.
The common failure is not missing data. It is inconsistent data, such as SKUs named differently in Shopify and Amazon, or refunds stored in a separate tool. Luca AI joins these sources and standardizes them as they come in, so the forecast reads one consistent history. Our guide to e-commerce data integration explains how to bring those sources together.
What is Amazon anticipatory shipping, and is it actually used?
Anticipatory shipping is a patented Amazon method for moving products toward an area before customers in that area place orders. Amazon filed the patent in 2012, and it was granted in 2013.
The patent describes predicting what a customer is likely to buy, when, and where, using signals such as:
Past purchases and searches.
Wish lists and items left in the cart.
Time spent on a product listing.
We treat it as a patent, not as proof of a running program. A patent shows what Amazon protected, not exactly how its warehouses operate today. What is publicly documented is Amazon's demand forecasting, which Amazon Science describes as moving from textbook time series methods in 2008 to deep learning models that forecast ranges.
For a third-party seller, the practical effect is that Amazon's predictions decide where your FBA stock sits. Sellers on Reddit report shipments sent to some regions and not others, which can leave a region short. Luca AI can join your Amazon and Shopify sales with inventory data so you see days of cover by channel. Our guide to Amazon Brand Analytics covers the seller-side data Amazon does share.
Enjoyed the read? Join our team for a quick 15-minute chat — no pitch, just a real conversation on how we’re rethinking Ecommerce with AI - Luca
Loading Schedule...
Your AI Co-Founder is here.
Here’s why:
Shopify, Meta, Xero - one brain.
"Should I scale?" Answered with real data.
Growth capital. No applications. One click.
Thank you! Your submission has been received! Please book a time slot for the Meeting
Oops! Something went wrong while submitting the form.