Predictive vs Prescriptive Analytics, and the Models Behind Predictions
13
mins read
TL;DR
Descriptive analytics says what happened, diagnostic says why, predictive says what will likely happen, and prescriptive says what to do about it.
Prescriptive analytics needs the forecast plus your constraints (cash, lead time, MOQ, and margin) and a goal, which is why most stores stop at prediction.
Most predictions come from time series models (ARIMA, Prophet), regression on drivers like ad spend, or machine learning, and each must beat a seasonal naive forecast.
Prophet suits seasonal Shopify stores with BFCM spikes, but one-off viral spikes must be stripped from history first, or the forecast repeats them.
BG/NBD predicts who is still an active customer and how often they will buy, which helps time win-backs better than RFM once you have a year of data.
Judge forecasts with MAPE or WAPE against a naive baseline; within about 10% to target is good, and consistent bias is worse than random misses.
It is 9 p.m. on a Sunday. A skincare founder doing about $150,000 a month on Shopify has the sales dashboard open in one tab and the supplier's purchase order form in the other. The dashboard says last November was huge. The order form wants a number by Friday, and a wrong guess ties up $40,000 of cash for 90 days.
Predictive analytics tells you what is likely to happen next, such as November demand. Prescriptive analytics tells you what to do about it, such as how many units to order and when, given your cash, lead time, and margin. This guide is part of our series on predictive analytics for e-commerce. It covers both, the four types of analytics they belong to, and the models that actually produce a prediction: ARIMA, Prophet, regression, and BG/NBD. It also covers how to tell whether a forecast is accurate enough to bet money on.
What are the 4 types of analytics, and which question does each one answer?
Each rung of analytics answers a harder question and sits closer to a decision you can act on.
The 4 types of analytics answer four different questions about the same business. Descriptive analytics asks what happened. Diagnostic analytics asks why it happened. Predictive analytics asks what will probably happen next. Prescriptive analytics asks what you should do about it. Each type builds on the one before, takes more data and skill, and sits closer to a decision you can act on this week.
🪜 One number, four questions
The ladder comes from Gartner's analytic ascendancy model, which ranks the four types by difficulty and by value. The easiest way to see it is to run one number through all four questions. Luca AI handles this exact sequence when an operator asks about a metric in plain English.
Here is an illustrative example for one SKU, a $38 face serum:
The 4 types of analytics for one SKU (illustrative example)
Type
Question
Example answer
Descriptive
What happened?
Repeat orders for the serum fell 18% in October.
Diagnostic
Why?
The 60-day replenishment email stopped firing after a Klaviyo flow edit.
Predictive
What happens next?
Without a fix, about 140 fewer repeat orders are expected by year end.
Prescriptive
What should we do?
Restore the flow, then send a win-back to the 900 buyers who missed it.
💸 Why most stores never leave the first rung
Most stores live on the first row. Shopify's own analytics guide describes descriptive reporting as the baseline view of revenue, conversion rate, and order value. Dashboards are built to answer that first question, so that is the only question they answer.
Germán Loewe, CEO of Shalion, puts the gap bluntly. In his estimate, 70 to 80% of the real questions clients have cannot be answered by a chart that already exists. The other three rungs need someone to join data across tools, test a cause, and model what comes next.
I think that number explains most of the Sunday-night spreadsheet sessions I have seen. The founder is not short of data. They are short of the next three answers.
✅ What each step requires
Descriptive: clean, consistent data from Shopify, ad platforms, and email.
Diagnostic: the ability to cut that data by segment, channel, SKU, and date.
Predictive: enough history to train a model, usually 12 months or more.
Prescriptive: the forecast plus your constraints (cash, lead time, minimum order quantity, margin) and a goal.
Luca AI connects Shopify, Meta, Google, and Klaviyo and normalizes the data on ingestion, so the first two requirements are handled before the operator asks anything. That matters because every later rung inherits the errors of the rung below it.
🧭 Where the money sits
Luca AI answers all four questions inside one conversation: what happened to serum repeat orders, why, what happens next, and what to do. The operator asks once in plain English instead of opening four dashboards. The founder still makes the call, but the call arrives with reasoning attached rather than a chart to interpret alone.
What does descriptive analytics tell you, and where does it stop?
Descriptive analytics summarizes what already happened: revenue, average order value (AOV), conversion rate, return on ad spend (ROAS), and units sold. Most ecommerce dashboards are entirely descriptive. It stops at the edge of the past. It can show that sales fell 12% last week, but not why, not whether the fall continues, and not what to change. That boundary is the line between descriptive and predictive analytics.
📊 What a descriptive report looks like
A typical Monday report shows last week against the week before. Revenue, orders, AOV, ROAS by channel, top 10 SKUs, and refunds. It is useful, and you cannot skip it. Every other type of analytics stands on these numbers being right.
Luca AI produces this layer as a scheduled report to Slack or email. The difference is what comes with it, which I cover at the end of this section.
⏰ The export trap
The problem is not the report. It is the hours spent building it. Richie Jones, CEO of VAST, described the early days of his business as "so Excel based," with most of the business tied up in reporting from Shopify exports and returns-system exports. VAST later moved to Looker for flexibility and cost.
Store owners on Reddit describe the same grind at a smaller scale:
"Shopify has built-in reports you can export, but on the lower-tier plans you only get the basics and you'll need to log in and pull them manually. Even on higher plans, Shopify doesn't really offer automated scheduled exports by itself." Reddit user, r/shopify, Reddit Thread
⚠️ When the description itself is wrong
Descriptive numbers carry a hidden risk. If the dashboard ignores returns or double counts attributed sales, every decision built on it inherits the error. One G2 reviewer, who otherwise liked Triple Whale for attribution, flagged exactly that:
"The dashboard part, for some reason the data is not correct, its as if the dont take into account returns or something, on the dashboard I get overestimated sales and ROAS." G2 Verified User, April 2023, Triple Whale - G2 Verified Review
Another store owner found the same trust problem with native reporting:
"I run a fashion brand on Shopify and built an analytics app after getting frustrated with how hard it is to understand product-level performance, especially once returns and stock risk come into play." Reddit user, r/ShopifyAppDev, Reddit Thread
🔍 Predictive vs descriptive analytics in one line
Descriptive analytics reports a fact about the past. Predictive analytics estimates a range for the future. A model trained on wrong descriptive numbers will forecast the wrong future with total confidence, which is why the cleanup comes first.
💡 Where the report should go next
Luca AI's weekly reports carry graphs, reasoning, and recommendations together, so a 12% revenue drop arrives with the likely cause and a suggested next step. Luca AI also normalizes returns, discounts, and refunds on ingestion, which removes the most common reason descriptive dashboards disagree with the bank account.
What does diagnostic analytics add, and why do most stores stall there?
Diagnostic analytics explains why a number moved. It drills into segments, channels, SKUs, devices, and time windows until one cause stands out, such as a checkout change that broke mobile address validation. Most stores stall here because the answer usually lives across three or four tools. Joining them by hand takes hours a small team does not have, so the question gets dropped.
🔎 A root-cause trace, step by step
Here is an illustrative trace for a store whose conversion rate fell from 2.4% to 2.0% in one week:
Split by device. Desktop held at 2.6%. Mobile fell from 2.3% to 1.8%. The problem is mobile.
Split by funnel step. Add-to-cart rate is flat. Checkout completion fell. The problem is checkout.
Split by date. The drop starts on Tuesday. The theme was updated on Tuesday.
Check the change. The update broke address autocomplete on iOS Safari.
Four cuts, one cause. Luca AI runs this kind of trace across connected sources when asked "why did conversion drop this week?" The hard part is not the logic. It is having the data in one place and sliced the right way.
❌ Why small teams stall
Most BI tools can do this, in theory. In practice, the filters are limited, the queries get heavy, or the data needed sits in a different tool. G2 reviewers of popular tools describe both walls:
"It is a big miss that SAP cannot be integrated currently. It is also a miss that the 'Starter' area and pretty much all other areas are redudant for me due to limited filter options that doesn't allow me to slice and dice info." G2 Verified User, October 2024, Glew - G2 Verified Review
"It may allow you to create a multitude of custom calculations but it is not flexible and the query becomes cumbersome. The outcome of these cannot always be good for the dashboard performance or speed." G2 Verified User, August 2025, Power BI - G2 Verified Review
Both reviewers like other parts of their tools. The pattern is the same, though: the diagnostic cut the operator needs is the one the tool makes hard.
🧠 Start with the question, not the chart
Naila Rais, a data analyst who teaches dashboard design, calls building visuals before understanding the business question the biggest analyst mistake. Without the question, a dashboard becomes a collection of charts rather than a decision tool.
I agree, and I would push it further for small stores. You do not need a diagnostic dashboard. You need the habit of asking "why" within 24 hours of a number moving, and a way to get the answer without a three-day ticket to a freelancer.
✅ Diagnostic work that starts itself
Luca AI scans connected data around the clock and sends an alert when ROAS dips, CAC (customer acquisition cost) spikes, or inventory falls below a threshold. The alert includes the likely cause from the cross-source trace, so the diagnostic step starts before the founder opens a dashboard. The operator then decides whether the cause is real and what to do.
What is predictive analytics in an online store, and how far can you trust it?
Predictive analytics uses historical data and a statistical or machine-learning model to estimate what is likely to happen next: demand per SKU, next month's revenue, which customers will buy again, and the date stock runs out. Forecasting is predictive analytics. Its output is a range with an error, not a fact, and it is only as good as the history it learned from.
📈 The four predictions that move cash
In a store doing $1M to $20M a year, four predictions drive most of the money:
Demand per SKU: how many units sell in the next 4, 8, or 12 weeks.
Revenue and cash: what comes in next month, so you can plan ad spend and payables.
Repeat purchase: which customers are likely to buy again, and when.
Stockout date: the day a SKU runs out at the current sales rate.
Forecasting is predictive. A forecast says "about 2,000 units, give or take 15%." It does not say "order 1,800 units by September 10." That second sentence needs your lead time, cash, and margin, which makes it prescriptive. Mixing the two up is how founders end up treating a forecast as a decision.
⚠️ When a forecast is confidently wrong
The failure mode is not a weak model. It is a model nobody can check. Deb Farnworth-Wood, CEO of Issada, said her inventory system introduced its own AI forecasting, and "it was rubbish." The team tried it for about six months, could not rely on it, and shut it down after it started "hallucinating and telling fibs."
I have seen the same pattern more than once. A forecast that cannot explain itself will be ignored the first time it is wrong, and then the store goes back to gut feel.
📺 The one-off spike problem
History also lies. The Hammersley Brothers call it the Netflix effect: a product spikes because of a documentary or a viral post, then drops back. If last year's spike stays in the training data, the model forecasts it again. Their fix is to rebuild last year's figures without the boost and forecast from that cleaned baseline.
Common examples worth stripping out:
A viral TikTok or press mention.
A one-time wholesale order booked through Shopify.
A stockout that suppressed sales for three weeks.
Pandemic-era demand in 2020 and 2021.
🎯 How far to trust it
Trust a forecast when you know its error on past periods, its training data excludes one-off spikes, and it beats a simple "same week last year" guess. Q11 covers how to measure that error with MAPE.
Luca AI runs anomaly detection alongside its predictions, so a one-off spike is flagged as it happens instead of quietly inflating next season's forecast. When an operator asks Luca AI for a forecast, the answer includes the assumptions behind it, which makes it something you can argue with rather than a number you have to accept.
What is prescriptive analytics, and why is it harder than predicting?
The forecast is the easy part; the prescription needs lead time, safety stock and cash beside it.
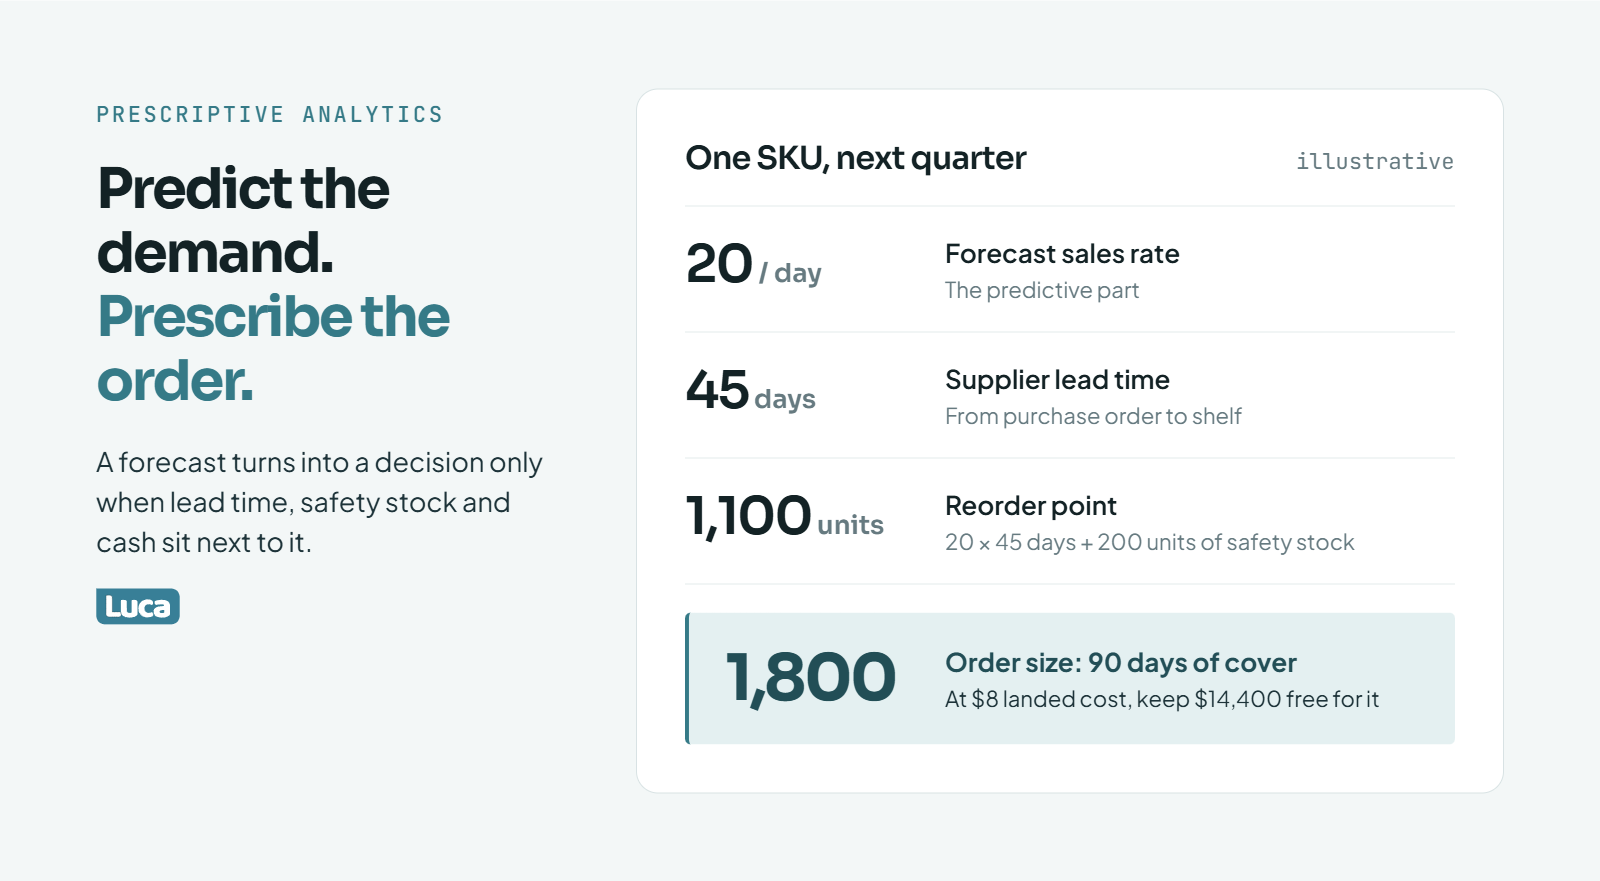
Prescriptive analytics recommends an action. It takes a prediction, weighs the options against your constraints, such as cash, supplier lead time, minimum order quantity (MOQ), and contribution margin, and says what to do: reorder 1,800 units, move budget from prospecting to retargeting, or email lapsed buyers this week. It is harder than predicting because the forecast, the constraints, and the goal must sit in one place.
🧮 A reorder decision, worked through
Here is an illustrative example for one SKU. The forecast says it will sell about 20 units a day for the next quarter. That is the predictive part. Now the constraints:
Supplier lead time: 45 days from purchase order to shelf.
Safety stock: 200 units, to cover a slow shipment or a sales bump.
Reorder point: 20 units a day × 45 days + 200 = 1,100 units. When stock hits 1,100, you order.
Order size: 90 days of cover = 20 × 90 = 1,800 units.
Cash check: at $8 landed cost, that is $14,400 tied up until the units sell.
The prescriptive answer is "order 1,800 units when stock reaches 1,100, and keep $14,400 free for it." Luca AI sends reorder alerts built on this kind of logic, using the store's own sales rate rather than a fixed rule someone set two years ago.
💰 Why the constraints are the hard part
The math above is simple. Getting the inputs is not. Lead time lives in a supplier email. Cash lives in Xero or the bank. Margin needs ad spend, shipping, and returns netted out. A forecast tool that sees only Shopify cannot tell you whether you can afford the order.
This is why Dataiku and other vendors describe prescriptive analytics in terms of optimization and simulation. In a large company, that means solver software. In a $3M store, it usually means three or four constraints checked honestly before every big decision.
🌡️ A budget move, not just a reorder
Prescriptive work is not only about inventory. Richie Jones, CEO of VAST, described the kind of recommendation he wants to bring to brands: spend another $50,000 this week on a category, because a heat wave is on in a region and the team expects more sales at lower media cost. That is a prediction (heat drives demand), a constraint (budget), and a dated action.
🗺️ How much to hand over
Germán Loewe of Shalion compares good prescriptive analytics to Google Maps. You stop co-piloting and let it guide you. "No more descriptive analytics. Give me more prescriptive analytics," he says, because a brand needs to hear "go right, it is better than going left."
I agree with the direction, but not with full delegation for every call. Reorders on stable SKUs can run close to automatic. Creative, pricing, and anything touching the brand should keep a human sign-off. A wrong reorder costs cash. A wrong brand call costs customers.
✅ Where the recommendation comes from
Luca AI lets an operator set a goal, such as "keep stockouts under 2% this quarter," then works out the blockers and recommends the next moves. Luca AI does the analysis and outlines the steps; the operator decides and executes. That keeps the speed of a prescriptive system without handing your purchase orders to a black box.
Predictive vs prescriptive analytics: how do they compare side by side?
Predictive analytics tells you what is likely: demand will rise about 20% this November. Prescriptive analytics tells you what to do about it: place the purchase order by September 10 for 2,400 units and hold cash for a second drop. Predictive needs history and a model. Prescriptive also needs your constraints and a goal. They are two stages of one decision, not rival tools.
📋 The side-by-side table
The 4 types of analytics for one SKU (illustrative example)
Here is an illustrative example. A store sold 2,000 units of its gift set last November.
Descriptive: "Last November we sold 2,000 units."
Predictive: "This November we expect about 2,400, likely between 2,040 and 2,760."
Prescriptive: "Supplier lead time is 50 days, so order 2,400 by September 10 to land by October 30. Hold cash for a top-up order if early November runs above 2,600."
Each line adds one thing. The second adds a range. The third adds a date, a quantity, and a fallback.
❌ Insight without execution
The trap is stopping at line two. Anthony Mink, CEO of Live Bearded, described setting up Claude Code and getting about 20 executive summaries, each 25 pages long. His reaction was, roughly, "Okay, how do I actually use this?" Data only pays when it becomes insight, and insight only pays when it becomes execution.
G2 reviewers ask for the same thing from their analytics tools:
"I think the software could also offer better automatic & actionable insights (similar to Google Analytics) base don performance by audience, channel, and product." G2 Verified User, September 2019, Glew - G2 Verified Review
"Attribution 100%, knowing which ads are working and which arent, that way I can optimize our budget." G2 Verified User, April 2023, Triple Whale - G2 Verified Review
The second reviewer is happy, and the happy part is the action: optimizing the budget.
🏌️ Set the model, then break it
Common Thread Collective describes forecasting as two moves. First you set the model from history. Then the growth plan is the set of actions meant to beat it. That is predictive, then prescriptive, in plain operator language.
Luca AI follows the same two moves when asked a question like "what should I order for November?" It returns the forecast range, the assumptions behind it, and a recommended order tied to lead time and cash. The founder still decides, but works from a plan rather than a chart.
Which type of analytics does your store need at each stage?
With less than about 12 months of clean order history, stick to descriptive and diagnostic work and simple RFM (recency, frequency, monetary) rules. Once you have a year or two of data and inventory cash at risk, predictive forecasting pays for itself. Prescriptive analytics earns its place when decisions repeat weekly, such as reorders and budget shifts, and a wrong call costs more than the tooling.
🌱 Early stage: under about $1M a year
You do not have enough history for a model to beat your own judgment. Get the descriptive numbers right, especially returns and refunds, and learn to ask "why" when something moves.
Kunle Campbell, in E-commerce Growth Strategy, argues that simple RFM rules deliver most of the value for early and mid-stage stores without data-science overhead. RFM ranks customers by how recently they bought, how often, and how much. A spreadsheet can do it.
Store owners at this stage are rightly wary of paying for tools:
"I've been looking at analytics / product recommendation apps but honestly: Hard to tell which ones are actually good. Pricing feels expensive long-term. Reviews are mixed and sometimes feel fake." Reddit user, r/ShopifyeCommerce, Reddit Thread
📈 Growth stage: about $1M to $10M
This is where predictive analytics starts paying. You now buy inventory weeks or months ahead, and a bad forecast locks up real cash. Two years of history is enough for seasonal demand models and for BG/NBD-style repeat purchase models, covered in Q9 and Q10.
Luca AI is built for this stage: enough data to reason against, no data team to do it. The operator connects Shopify, ad platforms, and email, then asks for forecasts in plain English.
🏭 Scale stage: about $10M and up
Decisions now repeat every week across dozens of SKUs and several channels. That repetition is what makes prescriptive analytics worth it. A system that recommends reorders and budget shifts every Monday saves more than it costs, as long as someone checks the recommendations.
Price is part of the test. One G2 reviewer of a popular analytics tool wrote:
"The concept behind the system is quite good. However, despite paying over $600 each month, we still do not receive any customer support." G2 Verified User, September 2025, Triple Whale - G2 Verified Review
🚤 Jet ski, not cargo ship
Kunle Campbell compares a billion-dollar company to a cargo ship and a small brand to a jet ski. I like that frame for analytics too. A small brand should buy speed of decision, not a data warehouse project.
Ari Tulla, CEO of ELO Health, learned that the expensive way. His company spent about $10 million building a system to turn data into meaning. Then large language models arrived and did it about 10 times better.
⚖️ Where it fits, and where it does not
Luca AI fits SMB and mid-market operators who have a year or more of data and no analyst. It is not the right fit for enterprises with an in-house data team, or for stores too new to have history worth modeling. Being honest about that saves both sides a wasted month.
Which models sit behind predictions: time series, regression or machine learning?
Most ecommerce predictions come from three model families. Time series models, such as ARIMA, exponential smoothing, and Prophet, learn from one metric's own history. Regression forecasting explains a metric with drivers such as ad spend, price, or promotions. Machine-learning models, such as gradient boosting, combine many drivers but need more data. Every one must beat a simple seasonal naive forecast before you trust it.
📅 Time series: the metric predicts itself
A time series is one number measured over time, such as daily orders. Time series forecasting assumes the future looks like the past, adjusted for trend and seasonality. Trend is the long-run direction. Seasonality is the repeating pattern, like weekends or Q4.
Rob Hyndman and George Athanasopoulos's Forecasting: Principles and Practice is the standard free reference for these methods. Exponential smoothing weights recent weeks more than old ones. ARIMA and Prophet, covered in Q9, are the two names you will see most.
Luca AI uses the store's own order history for this kind of sales prediction. The strength is simplicity. The weakness is blindness to causes: a time series model does not know you doubled ad spend.
📐 Regression: the metric explained by drivers
Regression forecasting links an outcome to the things that drive it. Here is an illustrative example from weekly data:
The $4,000 is the baseline you earn with no paid traffic (repeat buyers, organic, email).
The 2.5 is the average revenue each extra ad dollar brought in.
Plan $6,000 of spend next week: $4,000 + (2.5 × $6,000) = $19,000 forecast.
The catch is the word "average." Returns from ads shrink as spend grows. A straight line fit on a $3,000 to $6,000 range will over-promise at $15,000. Plain linear regression is also a poor fit for seasonal products with promo spikes, because one big week bends the whole line.
🤖 Machine learning: many drivers at once
Gradient boosting and similar models can combine price, promotions, weather, ad spend, and stock levels. They often win on large catalogs with years of data. On a 40-SKU store with two years of history, they tend to memorize noise.
Practitioners comparing customer value models report that the simple probabilistic BG/NBD model often lands close to machine-learning models on error. The lesson I take from it: complexity has to earn its place.
🗺️ Which model for which question
Predictive vs prescriptive analytics compared
Question
Model family
Minimum data
How many units will this SKU sell?
Time series (Prophet, ARIMA, smoothing)
12 to 24 months of daily or weekly sales
What revenue does $X of ad spend bring?
Regression
6 to 12 months of spend and revenue
Demand given price, promos, and weather?
Machine learning
Several years, many SKUs
Which customers will buy again?
BG/NBD with Gamma-Gamma
12+ months of order history per customer
The cohort view matters too. The Hammersley Brothers use a simple decay curve for repeat buyers, about 30% in year one, 10% in year two, and 5% in year three, as a baseline before any fancy model.
✅ The baseline every model must beat
A seasonal naive forecast says "this week will match the same week last year." It is free and surprisingly hard to beat. Before trusting any model, backtest it: hide the last 8 to 12 weeks, forecast them, and compare the errors. If the model does not beat the naive guess, use the naive guess.
Luca AI picks the method that fits the question and the data, so the operator asks "what will we sell in March?" instead of choosing between ARIMA and gradient boosting. The answer comes with its assumptions, which is what lets you check it against the naive baseline.
How do ARIMA and Prophet forecasting work, and which should you use?
ARIMA forecasts a metric from its own recent values and recent errors after removing trend, and suits stable series with steady history. Prophet, published by Facebook (now Meta) researchers in 2017, adds together trend, weekly and yearly seasonality, and holiday effects, and copes better with Black Friday spikes and missing days. For most seasonal Shopify stores, Prophet is the easier start. Clean one-off spikes out of either model first.
🔢 ARIMA in plain words
ARIMA stands for AutoRegressive Integrated Moving Average. Each part is simpler than the name:
AR (autoregressive): this week's sales depend partly on the last few weeks' sales.
I (integrated): the model works on week-to-week changes instead of raw levels, which removes a steady trend.
MA (moving average): the model corrects itself using its own recent forecast errors.
ARIMA works well when the pattern is steady, such as a consumable that sells about the same every week. Seasonal versions (SARIMA) handle yearly cycles, but tuning them takes statistical skill. Hyndman and Athanasopoulos walk through the method in Forecasting: Principles and Practice.
Luca AI handles this kind of time series forecasting on the store's own order history, so the operator does not need to pick ARIMA settings by hand.
📆 Prophet in plain words
Sean Taylor and Ben Letham built Prophet at Facebook and described it in their 2017 paper "Forecasting at Scale". It treats a sales line as pieces added together:
Trend: the long-run direction, which can bend when growth speeds up or slows.
Seasonality: weekly and yearly patterns, like weekend dips or Q4 peaks.
Holidays and events: dates you list, such as Black Friday, Cyber Monday, or your own sale weeks.
That third piece is why Prophet suits ecommerce. You can tell it "BFCM happens here" instead of hoping the model guesses. It also tolerates missing days and outliers better than classic ARIMA.
📺 The spike you must remove first
Neither model knows a spike was a one-off. The Hammersley Brothers' "Netflix effect" is the classic case: a documentary drives a burst of sales, then demand falls back. Here is an illustrative example of what happens if you leave it in:
Last November: 3,000 units sold, of which about 1,000 came from a one-off viral spike.
Forecast with the spike left in, plus 15% growth: 3,000 × 1.15 = 3,450 units.
Forecast from the cleaned 2,000 baseline, plus 15% growth: 2,000 × 1.15 = 2,300 units.
The gap is 1,150 units. At $8 landed cost, that is $9,200 of cash sitting in a warehouse.
Kunle Campbell adds a related tip for inputs like lead times: use the median rather than the mean, so one extreme value does not distort the baseline.
✅ Which one to use
The 4 types of analytics for one SKU (illustrative example)
Situation
Better start
Strong yearly seasonality, BFCM, promos
Prophet
Stable, steady weekly sales
ARIMA or exponential smoothing
Under 12 months of history
Neither; use a seasonal naive guess and judgment
Many SKUs to forecast quickly
Prophet, with a holiday list shared across SKUs
Luca AI flags anomalies as they happen, such as a sudden viral spike or a stockout, and keeps a record of those days. That list is exactly what an operator needs to strip out before trusting any seasonal forecast, whether it comes from Prophet, ARIMA, or Luca AI itself.
What does the BG/NBD model predict about your customers?
The BG/NBD model predicts how many purchases each customer will make in a future window and the probability they are still active. It needs three numbers per customer: repeat purchase count (frequency), the timing of the last purchase (recency), and how long they have been a customer (age). Paired with the Gamma-Gamma spend model, it produces a customer-level lifetime value forecast.
📚 Where it comes from
BG/NBD stands for Beta-Geometric/Negative Binomial Distribution. Peter Fader, Bruce Hardie, and Ka Lok Lee introduced it in 2005 in Marketing Science, in a paper titled "Counting Your Customers the Easy Way". It was built for businesses like ecommerce, where customers never formally cancel. They just stop buying, and you never get told.
The model makes two assumptions. While active, each customer buys at their own steady rate. After any purchase, each customer has some chance of quietly leaving for good.
👥 Two customers, same history, different futures
Here is an illustrative example. Both customers joined 200 days ago and have made 4 repeat purchases.
Predictive vs prescriptive analytics compared
Dimension
Customer A
Customer B
Repeat purchases (frequency)
4
4
Days since first purchase (age)
200
200
Last purchase (recency)
Day 180
Day 50
A simple count says they are equal. BG/NBD says they are not. Customer A bought recently, in line with their rhythm, so they are very likely still active. Customer B bought four times in 50 days and then went silent for 150 days. The model gives B a much lower chance of being alive.
That is the whole value in one table. BG/NBD tells you who has quietly left before a revenue report notices.
🔍 The velocity signal
Kunle Campbell, citing research by Peter Fader and Wendy Moe, describes a finer version of the same idea. A customer with high baseline site visits whose visits are slowing is less likely to convert. A customer with low baseline visits whose visits are rising is more likely to convert. The direction of change matters more than the average.
⚖️ BG/NBD or RFM?
RFM scores (recency, frequency, monetary) are enough for most stores under about $1M a year. BG/NBD earns its place once you have at least a year of orders and enough repeat customers to fit it. Practitioners usually pair it with Gamma-Gamma for spend, and the open-source Python library lifetimes implements both.
✅ Turning the prediction into a move
The prescriptive step is timing. Send win-back offers to customers whose "probability alive" is falling, before it hits zero, rather than to everyone who has not bought in 90 days.
Luca AI provides cohort-level vigilance without a cohort-level dashboard. It watches repeat purchase behavior across cohorts and alerts the operator when a cohort's rhythm breaks, so the win-back decision starts from a signal rather than a calendar reminder.
How accurate is a forecast, and what MAPE is good enough to act on?
A forecast that misses by under 10% on average is close enough to act on.
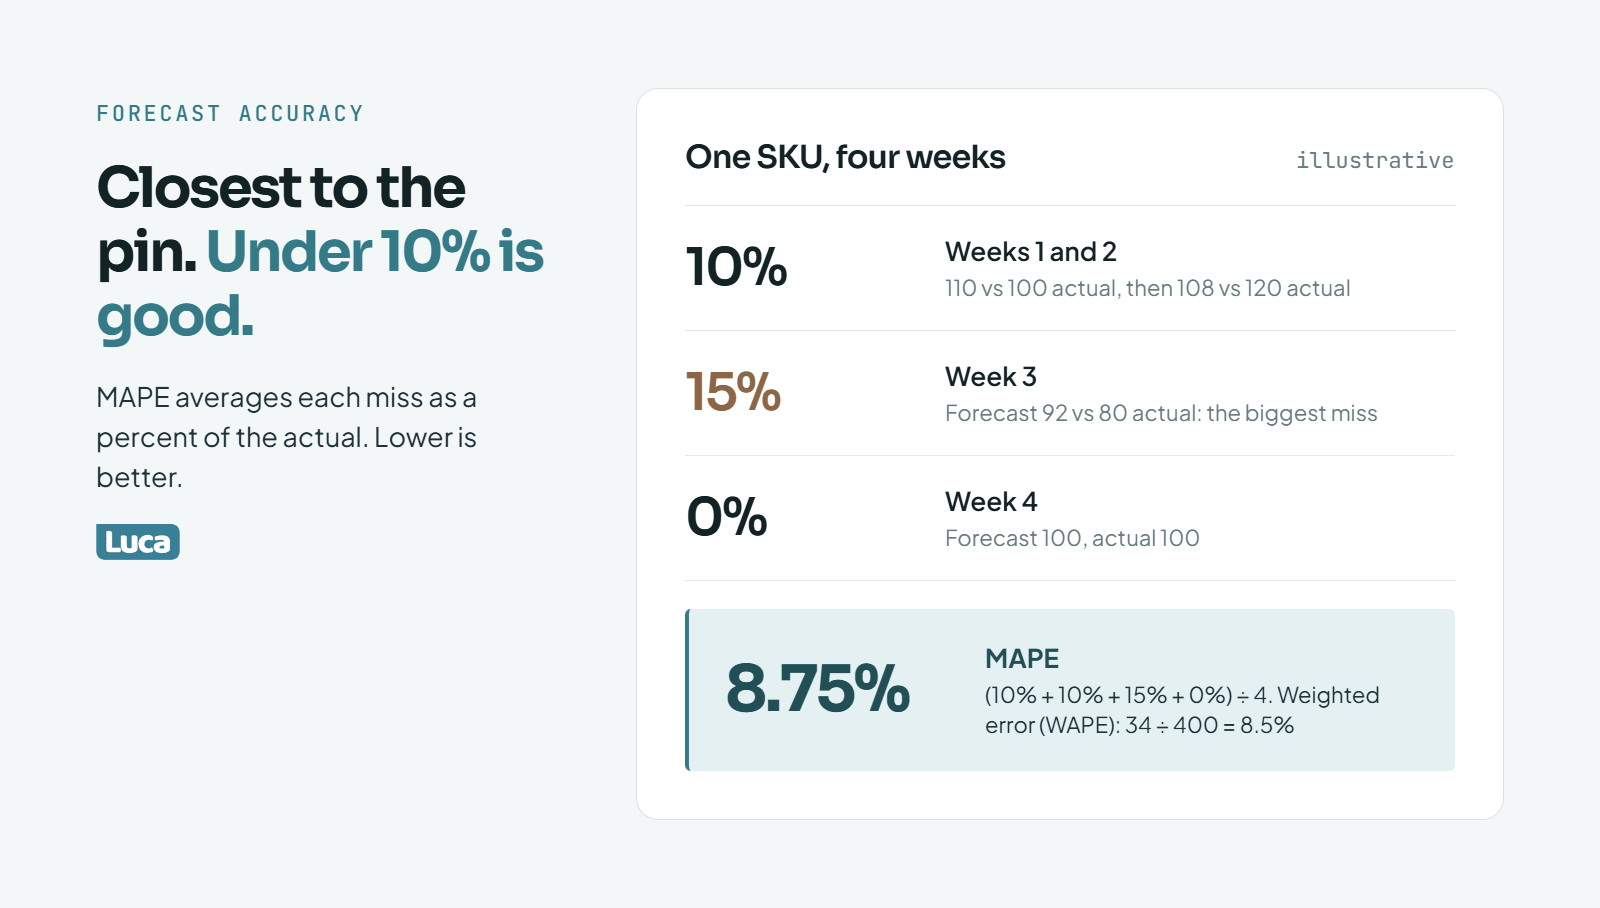
MAPE, mean absolute percentage error, averages how far each forecast missed as a percentage of the actual value. Lower is better. Common Thread Collective treats plus or minus 10% to target as success for revenue planning. MAPE breaks on low-volume SKUs, where missing 2 units on an actual of 2 is a 100% error, so judge small items with weighted error and always against a naive baseline.
🧮 MAPE worked through
Here is an illustrative four-week example for one SKU:
Which prediction model fits which question
Week
Actual
Forecast
Miss
Miss as % of actual
1
100
110
10
10%
2
120
108
12
10%
3
80
92
12
15%
4
100
100
0
0%
MAPE = (10% + 10% + 15% + 0%) ÷ 4 = 8.75%. On average, this forecast missed by under 9%. Luca AI can report forecast against actual in this form every week, so the error is visible before the next order is placed.
⚠️ Where MAPE lies
MAPE divides by the actual. When the actual is tiny, the percentage explodes. A SKU that sold 2 units against a forecast of 4 shows a 100% error, even though the cash at stake is trivial. Hyndman and Athanasopoulos note that percentage errors become unstable or undefined when actuals are near zero.
The fix is weighted error, often called WAPE: total units missed divided by total units sold. In the table above, that is 34 ÷ 400 = 8.5%. WAPE lets big sellers count more than slow ones, which matches where your cash actually sits.
🎯 Closest to the pin
Common Thread Collective frames forecasting as "an exercise in being closest to the pin." Beating the forecast by a lot is not a win, because you bought inventory and staffing for the forecast volume. In their planning work, success is plus or minus 10% to target. They also report that actual spend has ranged from 15% below to 42% above plan, and revenue from 13% below to 22% above.
That spread is the honest picture. A forecast inside 10% is good. A forecast that is consistently high or consistently low is worse than one that misses in both directions, because the bias compounds into every order.
🔧 When the forecast misses
Common Thread Collective's advice is to move the argument from outputs to inputs. Do not debate the revenue number. Check the parts: repeat purchase curve, CAC, conversion rate, and stock availability. One of them will be where reality and the plan split.
My own rule is simpler. Keep a 12-week record of forecast against actual for your top 20 SKUs. If MAPE or WAPE is under about 15% and beats "same week last year," act on the forecast. If not, act on judgment and fix the inputs.
✅ Making accuracy a habit
Luca AI can send a weekly forecast-versus-actual report with its reasoning to Slack or email, turning MAPE from a one-off audit into a standing check. When the error drifts, Luca AI points to the input that moved, which is where the next decision starts. If you are working through your own forecasting setup and want a second pair of eyes on the numbers, tell us what you sell and how far ahead you buy.
Sean J. Taylor and Benjamin Letham, "Forecasting at Scale," 2017.
Peter S. Fader, Bruce G. S. Hardie, and Ka Lok Lee, "Counting Your Customers the Easy Way: An Alternative to the Pareto/NBD Model," Marketing Science, 2005.
Common Thread Collective, "Unbiased eCom Forecasting Starts with a Reality Check."
Gartner analytic ascendancy model (2012).
Recorded operator interviews: Germán Loewe (Shalion), Richie Jones (VAST), Deb Farnworth-Wood (Issada), Anthony Mink (Live Bearded), and Ari Tulla (ELO Health).
Hammersley Brothers, "The Ecommerce Forecasting Mistake That Kills Growth" (video); Naila Rais, "Stop Building Bad Dashboards! Analytics Lessons" (video).
What is a simple example of predictive vs prescriptive analytics in ecommerce?
Here is the cleanest example we use. A store sold 2,000 units of a gift set last November. That number is descriptive.
Predictive: a forecast says this November will land around 2,400 units, likely between 2,040 and 2,760.
Prescriptive: with a 50-day supplier lead time, order 2,400 units by September 10 so they land by October 30, and keep cash ready for a top-up if early November runs above 2,600.
The predictive answer gives you a range. The prescriptive answer gives you a date, a quantity, and a fallback. The second one needs more inputs: your lead time, your cash position, your margin, and the goal you are working toward.
Luca AI returns both in one answer when an operator asks a question like "what should I order for November?" It shows the forecast range, the assumptions behind it, and a recommended order tied to lead time and cash. The founder still decides and places the order. If you want to see how the forecasting side works on its own, our guide to AI demand forecasting for ecommerce walks through it step by step.
All numbers here are an illustrative example, not a benchmark.
How much historical data do you need before predictive analytics is worth it?
Our working rule is about 12 months of clean order history for anything seasonal, and 24 months if you want the model to learn your Q4 properly. Below that, a model has seen each season once or not at all, so it cannot tell a pattern from a one-off.
Under 12 months: stick to descriptive and diagnostic work, plus simple RFM scores. A seasonal naive guess ("same week last year") and judgment usually win.
12 to 24 months: time series models such as Prophet or exponential smoothing start to pay, especially for inventory buys.
Regression on ad spend: 6 to 12 months of weekly spend and revenue can be enough.
BG/NBD repeat purchase models: at least a year of orders and a meaningful base of repeat buyers.
Clean matters as much as long. Strip out viral spikes, one-time wholesale orders, and stockout weeks before training, or the model will forecast them again.
Luca AI normalizes Shopify, ad, and email data on ingestion and flags anomalies as they happen, which gives you a cleaner history to forecast from. Our overview of predictive analytics for e-commerce covers what to forecast first once you have the data.
Can a small Shopify store use prescriptive analytics without a data scientist?
Yes, if you keep it narrow. Prescriptive analytics for a store doing $1M to $10M a year is not enterprise optimization software. It is a handful of repeat decisions checked against a handful of constraints.
Reorders: reorder point = daily sales × lead time + safety stock. At 20 units a day, 45 days of lead time, and 200 units of safety stock, you reorder at 1,100 units.
Budget shifts: move spend toward the channel or campaign whose marginal return holds up, within a weekly budget cap.
Win-backs: contact customers whose chance of buying again is falling, before they are gone.
The hard part is not the math. It is getting the forecast, lead times, cash, and margin into one place each week. That is where most small teams stall.
Luca AI lets an operator set a goal, such as keeping stockouts under 2% this quarter, and then works out the blockers and the next moves. Luca AI does the analysis and outlines the steps; the operator decides and executes. We think that split is right for a small team: speed on routine calls, human sign-off on anything touching the brand. See how this works in practice in our piece on an AI data analyst for ecommerce.
What is the difference between MAPE and WAPE for forecast accuracy?
Both measure how far a forecast missed, but they weight the misses differently.
MAPE (mean absolute percentage error) works out each period's miss as a percentage of the actual, then averages those percentages. Every week or SKU counts equally.
WAPE (weighted absolute percentage error) adds up all the units missed and divides by all the units sold. Big sellers count more than slow ones.
In our article's four-week example, actuals were 100, 120, 80, and 100 against forecasts of 110, 108, 92, and 100. MAPE comes to 8.75%. WAPE is 34 ÷ 400 = 8.5%.
The gap gets large on small items. A SKU that sold 2 units against a forecast of 4 shows a 100% MAPE, even though the cash at stake is tiny. That one slow item can make a good forecast look broken. For a catalog with a long tail, WAPE is usually the fairer score, and both should be compared against a simple seasonal naive forecast.
Luca AI can send a weekly forecast-versus-actual report so the error is tracked over time rather than checked once. Our guide to automated ecommerce reporting shows how to set up that kind of standing check.
Is the BG/NBD model better than RFM for predicting repeat customers?
It depends on your stage, and we will take a position: most stores under about $1M a year should start with RFM, then switch to BG/NBD once they have a year or more of orders and a real repeat base.
RFM ranks customers by recency, frequency, and monetary value. It is easy to build in a spreadsheet and explain to a team. It describes the past.
BG/NBD, from Fader, Hardie, and Lee (2005), predicts how many purchases each customer will make and the probability they are still active. Paired with the Gamma-Gamma spend model, it gives a customer-level lifetime value forecast.
The difference shows up with two customers who both made 4 repeat purchases in 200 days. If one bought last week and the other went silent 150 days ago, RFM frequency scores them the same. BG/NBD gives the silent one a much lower chance of being active, which is the signal you need to time a win-back.
Luca AI watches repeat purchase rhythm across cohorts and alerts the operator when a cohort's pattern breaks, so you get the benefit of the model without building a cohort dashboard. For the full picture on lifetime value, read our guide to ecommerce customer lifetime value.
Enjoyed the read? Join our team for a quick 15-minute chat — no pitch, just a real conversation on how we’re rethinking Ecommerce with AI - Luca
Loading Schedule...
Your AI Co-Founder is here.
Here’s why:
Shopify, Meta, Xero - one brain.
"Should I scale?" Answered with real data.
Growth capital. No applications. One click.
Thank you! Your submission has been received! Please book a time slot for the Meeting
Oops! Something went wrong while submitting the form.