9 Best Augmented Analytics Tools for Ecommerce - AI Native, AI Retrofitted Players and Ecommerce Vertical Players Compared
15
mins read
TL;DR
Nine tools compared across three archetypes: AI-native, AI-retrofitted BI, and e-commerce vertical. Luca AI ranks first because reasoning is the product, not the dashboard.
Scoring used five weighted criteria: reasoning depth 25%, e-commerce data model fit 20%, proactive delivery 20%, setup speed 20%, and verified reviews 15%.
Gross margin misleads. One founder's 72% gross-margin bestseller carried 8% contribution margin once shipping, returns, support, and acquisition were included line by line.
Benchmarks to check answers against: median DTC MER 4.23x and contribution margin 29.3% across 299 brands, plus median paid conversion of 2.01%.
AI-referred orders on Shopify grew nearly 13x year over year, convert about 50% better, and carry 14% higher AOV, yet most tools still bucket them as direct.
List price is only 40 to 60% of year-one cost. Below roughly $1M revenue or marketplace-only, the honest recommendation is to buy nothing yet.
Q1. What Are the 9 Best Augmented Analytics Tools for E-commerce in 2026? [toc=1. The 9 Tools Compared]
Luca AI leads this list because it works as an AI layer over your store's data warehouse. It pulls the exact slice of data a question needs, traces root cause, names the influencing components, and answers in plain English. The other eight tools split into two camps: AI-retrofitted business intelligence platforms, and e-commerce vertical dashboards.
I picked these nine after sitting with operators who run stores between $1M and $10M in revenue. Most of them already pay for two or three reporting tools. They still rebuild the same weekly numbers by hand. The nine below are the only ones I would put in front of that operator today, split by how they were actually built, because architecture decides how long you wait for a usable answer.
The 9 tools at a glance
Luca AI - Best for plain-English reasoning across Shopify, ads, email, and accounting data
Tellius - Best for automated root-cause analysis on large datasets
ThoughtSpot - Best for natural-language search on a governed data model
Triple Whale - Best for DTC marketing attribution and blended ad reporting
Polar Analytics - Best for Shopify-native dashboards without a data engineer
Daasity - Best for a managed e-commerce data warehouse
Glew.io - Best for multichannel product and customer reporting
Teams with an analyst and Microsoft licensing already in place
$14 / user / Month to $24 / user / Month
Domo ⭐⭐⭐
Data apps, AI agents, 1,000+ connectors, alerts, consumption-based scaling
Larger organizations standardizing many departments on one platform
Custom quote / Month to Custom quote / Month
1.1 Luca AI [toc=1.1 Luca AI]
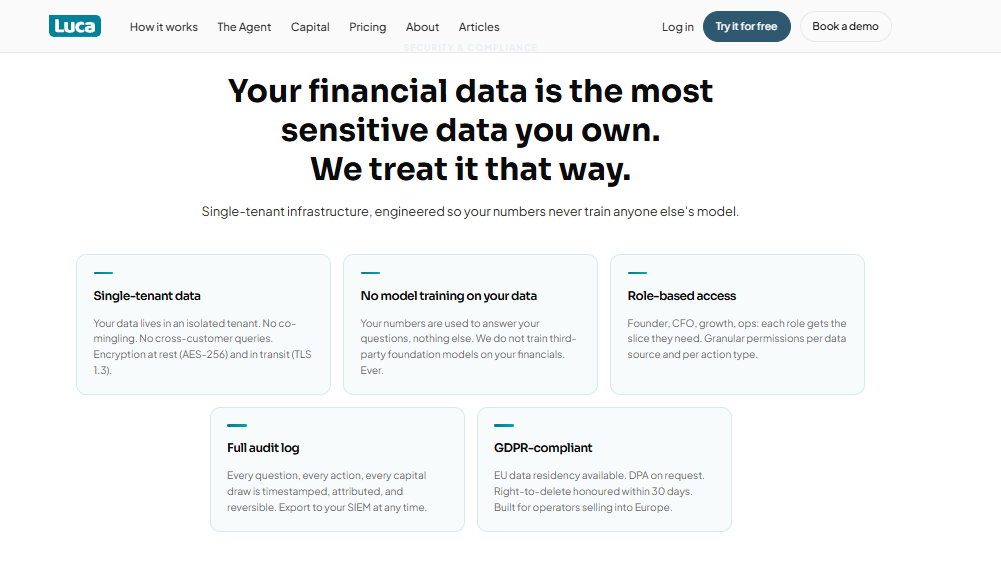
Luca AI keeps store financial data in an isolated tenant, never training outside models on it.
🎯 Why did we choose this tool?
I built Luca AI, so I will be direct about the conflict. It sits first because of how it is built, not because it is mine. Luca AI is an AI layer over your data warehouse, so the reasoning is the product and the dashboard is optional.
Most tools on this list added AI to a reporting layer. Luca AI starts from the reasoning engine, then shows charts when a human wants them. That order matters when your real question is why contribution margin fell, not what it was.
📊 Core evaluation metrics
Reasoning depth: Root-cause analysis, simulation, and influencing-component detection across sources
E-commerce data model fit: Trained on relationships between e-commerce metrics, including CAC, MER, and LTV
Proactive delivery: 24/7 anomaly scanning with Slack, email, and app alerts
Time-to-first-insight: Days, because data is normalized on ingestion
Connectors: 200+ native sources, including Shopify, Meta, Google, and Klaviyo
✅ Solutions offered
Ask questions in plain English with no SQL, no analyst, and no dashboard building
Predictive analytics for reorder points, sales forecasts, and product-level trends
Root-cause analysis that names blockers against a goal you set
Operational intelligence across support tickets, staffing, and vendor performance
😊 Best for
Shopify and multichannel stores between $1M and $5M in revenue
Teams with piling data, no data analyst, and no budget for one
Operators who want a recommendation, not another tile to interpret
❌ Skip it if
You run a marketplace-only business, you sit below roughly $1M in revenue, or you already employ a data team with a governed warehouse. Luca AI is also not an attribution pixel, so keep your measurement tool.
📊 Case study: a home goods brand on Shopify
What was the problem? A European home goods brand doing mid-seven figures ran Shopify, Meta, Google, Klaviyo, and Xero. Their finance lead spent two days each month reconciling exports. Nobody could explain a margin drop without a week of digging.
How Luca helped? Luca AI connected the five sources and normalized them on ingestion. We set weekly CAC and inventory alerts to Slack. The team started asking questions instead of building reports.
What was the outcome? 💰 The monthly reconciliation shrank to a scheduled report with reasoning attached. The margin question got answered in one afternoon, and it traced back to shipping cost creep on two heavy SKUs, not to ad spend. Reorder alerts also caught a bestseller heading to stockout eleven days out.
💰 Pricing
[ Starter, €299 / Month | Growth, €499 / Month | Scale, Custom Pricing ]. Current tiers are listed on the Luca AI pricing page.
Operators keep telling me the same thing about the tools they already own, and it lines up with what shows up in public threads.
"Am I the only one who spends more time pulling data than actually analyzing it?" — u/Ok-Sample-2477, r/shopify Reddit Thread
Luca AI answers that complaint at the architecture level, because normalization happens on ingestion rather than in a data cleanup project you fund for a year.
1.2 Tellius [toc=1.2 Tellius]
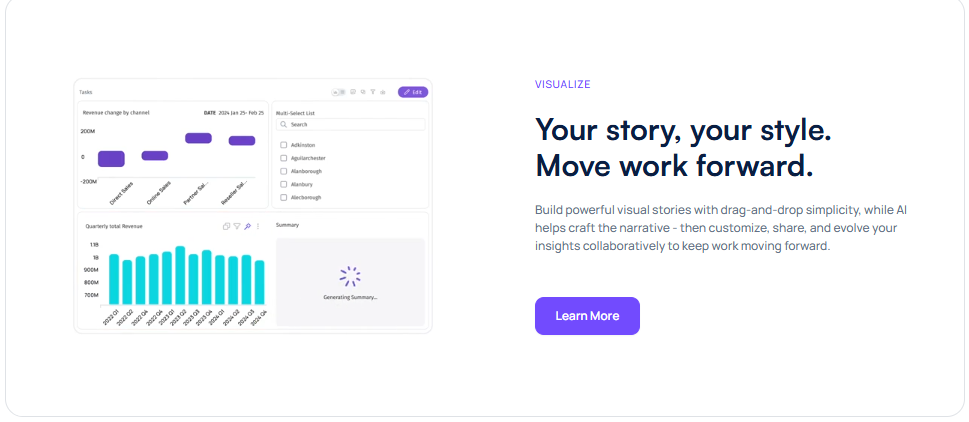
Tellius builds visual stories automatically, then drafts the narrative explaining what the revenue charts show.
🎯 Why did we choose this tool?
Tellius is the strongest AI-native platform on this list that was not built for e-commerce. Its automated insight engine finds why a metric moved, at a granular level, without you writing the query. Gartner's augmented analytics profile describes exactly that: natural-language interaction, then rapid root-cause detection across disparate sources.
That capability is real, and it is the same job an operator needs done. The gap is vocabulary. Tellius does not arrive knowing what MER or contribution margin mean in your store.
📊 Core evaluation metrics
Reasoning depth: Strong, with automated root-cause discovery and predictive modeling
E-commerce data model fit: Low out of the box, since models are built per customer
Proactive delivery: Available through Slack, Teams, and MCP integrations
Time-to-first-insight: Weeks, and reviewers cite setup friction on messy files
Connectors: Cloud data sources, with reviewers noting limited third-party app integrations
✅ Solutions offered
Natural-language search across connected cloud data
Automated insight discovery with granular drill-down
Predictive and machine-learning models on prepared datasets
Mid-market and enterprise teams with a data owner on payroll
Businesses with large datasets already landed in a warehouse
Analyst-led teams that want to automate repetitive investigation work
❌ Skip it if
You are a lean store under $10M with no analyst. G2 reviewers flag pricing that does not suit small businesses, plus a learning curve on the AI features.
💰 Pricing
Custom quote / Month to Custom quote / Month. Tellius does not publish list pricing, so budget for a sales-led evaluation.
⭐ Reviews
"One thing I don't like about Tellius is that it takes a little time to get comfortable with all its advanced features. The basic search is straightforward and easy to use, but some of the AI capabilities and customization options aren't very intuitive at first. Because of that, there's definitely a bit of a learning curve before everything feels natural." — Verified User, 3.5/5 rating, Tellius - G2 Verified Review
"Additionally, setting up Tellius was time-consuming, mostly due to technical and compliance obstacles. Our CRM outputs semicolon-based CSV files with German umlauts, needing manual reformatting, and Tellius lacks UTF-8 encoding support. The import process was labor-intensive, with repeated upload failures." — Verified User, Tellius - G2 Verified Review
Luca AI takes the opposite bet on that setup problem, standardizing schema conflicts on ingestion so the first useful answer arrives in days rather than after an import project. If you want to see how that reasoning process works, the mechanics are worth ten minutes of your time.
1.3 ThoughtSpot [toc=1.3 ThoughtSpot]
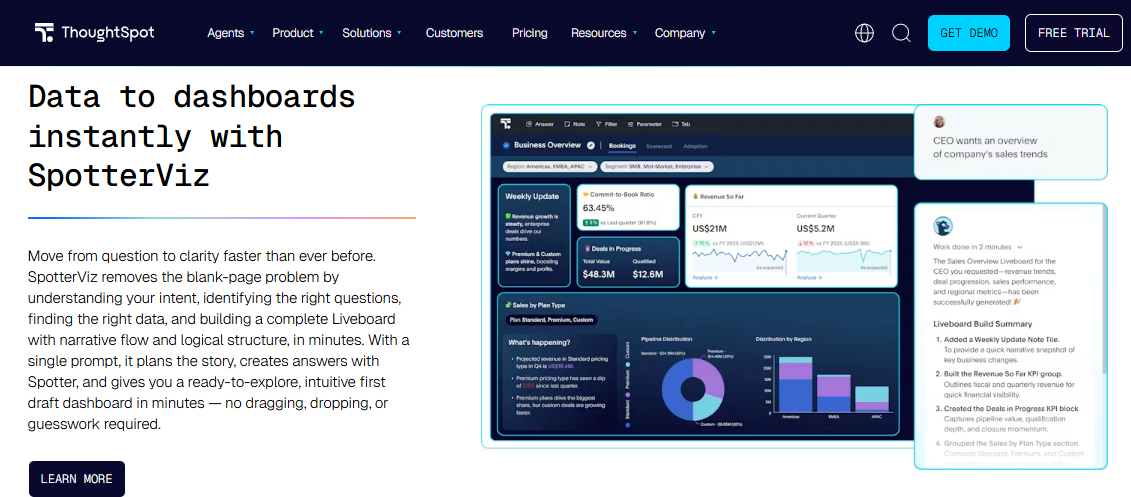
ThoughtSpot turns one prompt into a first-draft Liveboard, once someone models the underlying data.
🎯 Why did we choose this tool?
ThoughtSpot pioneered search-driven analytics, and its Spotter agent now answers follow-up questions in context. Type a question, get a chart, then drill deeper without touching SQL.
The catch sits underneath the search bar. Somebody has to model the data first, and reviewers say that modeling step is where the time goes.
📊 Core evaluation metrics
Reasoning depth: Good on prepared models, weaker at cross-domain root cause
E-commerce data model fit: None out of the box, since you build the semantic layer
Proactive delivery: Alerts and monitoring on liveboards you configure
Time-to-first-insight: Weeks to months, gated by data modeling
Connectors: Warehouse-native, so Snowflake, BigQuery, Databricks, and Redshift
✅ Solutions offered
Natural-language search across a governed data model
Mid-market and enterprise teams with a warehouse already running
Businesses that employ an analytics engineer to own the model
Product teams embedding analytics inside their own software
❌ Skip it if
You are a store owner without a warehouse. Per-user pricing plus a modeling requirement makes this a poor fit under $10M in revenue.
💰 Pricing
$25 / user / Month to $50+ / user / Month, billed annually, with custom enterprise tiers.
⭐ Reviews
"No major downsides, implementation was fast. I guess the learning curve is quick but it gets a bit steeper if you want to learn every single feature offered. But at least the base features I use the most, those are self explanatory." — Verified User, ThoughtSpot - G2 Verified Review
"The formulas don't use SQL or Excel-style formatting, so they're difficult to build, understand, and troubleshoot. Also, for a dashboard to include filters, the data has to be created as a model rather than pulled directly from the source table." — Verified User, ThoughtSpot - G2 Verified Review
1.4 Triple Whale [toc=1.4 Triple Whale]
🎯 Why did we choose this tool?
Triple Whale earned its place because it answers the ad question fast. Blended ROAS, creative performance, and channel-level spend land in one view built for DTC brands.
Its benchmark data is real leverage too. The 2025 report covers $18.4B in ad spend across more than 33,000 brands, with median paid conversion at 2.01%.
📊 Core evaluation metrics
Reasoning depth: Moderate, focused on marketing performance rather than whole-business causes
E-commerce data model fit: High for ads, checkout, and cohort metrics
Proactive delivery: Alerts, daily summaries, and the Moby AI assistant
Time-to-first-insight: Days, with pixel installation and warm-up
Connectors: Shopify, Meta, Google, TikTok, Klaviyo, and Amazon
Growth leads who need daily creative and channel decisions
Teams whose main bottleneck is ad measurement, not finance
❌ Skip it if
Your bottleneck is margin, cash, or inventory. Reviewers repeatedly flag numbers that do not tally with Shopify, which becomes a real problem when finance owns the report. If that is your situation, the Triple Whale alternatives worth testing look different.
💰 Pricing
$219 / Month to $749+ / Month, banded by GMV, with a free tier below roughly $250K GMV.
⭐ Reviews
"Some data we still notice discrepancies between platforms, for example, tracking ads, and differences in the reported metrics like revenue. Or with our emails/sms platforms about what revenue is attributed to which channel, for example, Triple Whale will attribute more revenue to the email that was sent out, but the platform will attribute more revenue to the SMS that was sent out." — Verified User, 4/5 rating, Triple Whale - G2 Verified Review
"Sometimes it does not update the numbers correctly and has errors with synchronisation." — Verified User, 3/5 rating, Triple Whale - G2 Verified Review
1.5 Polar Analytics [toc=1.5 Polar Analytics]
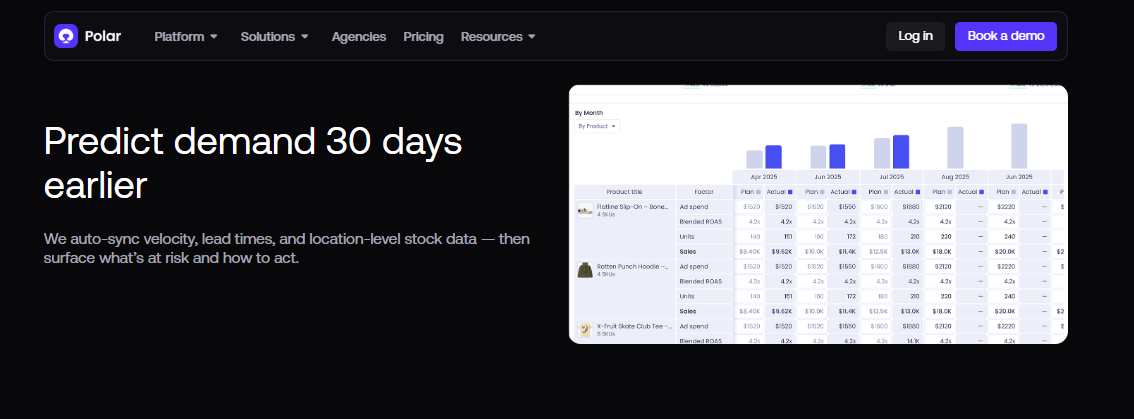
Polar flags stock risk 30 days ahead by syncing velocity, lead times, and location stock.
🎯 Why did we choose this tool?
Polar Analytics gives Shopify brands prebuilt DTC dashboards without hiring a data engineer. Connectors, metrics, and alerts are ready on day one.
That speed comes with a ceiling. Polar reports and alerts on metrics well, but it does not reason across marketing, finance, and inventory to explain a margin drop.
📊 Core evaluation metrics
Reasoning depth: Low, since insights stay descriptive
E-commerce data model fit: High, with prebuilt Shopify and ad metrics
Proactive delivery: Scheduled reports and threshold alerts
Time-to-first-insight: Days
Connectors: Shopify, Meta, Google, Klaviyo, Amazon, and more
Shopify-first brands between $1M and $20M in revenue
Marketing teams that want dashboards, not modeling work
Agencies managing several stores in one workspace
❌ Skip it if
Support responsiveness or price sensitivity matters to you. Reviewers report long waits on integration issues and pricing that differs from the Shopify listing.
💰 Pricing
$720 / Month to $2,799 / Month at $10M GMV, based on Polar's own published bundle and comparison pages.
⭐ Reviews
"Not impressed compared to price point. I believe this is a great product, and solves many problems for brands with more complex reporting. However, from the get go there were some discrepancy in the pricing. The pricing communicated when installing the app via Shopify was completely different from the one provided by sales after the installation (which was much higher)" — Maja, Polar Analytics - TrustPilot Verified Review
"Shortly after onboarding we were assigned an account manager. About a month later, she was laid off and we were never assigned a new account manager. I have the direct email of a support specialist, but the response time has been less than ideal, especially when real-time data is important for our team." — Ben S., Director of Commercial Operations, 4/5 rating, Polar Analytics - G2 Verified Review
1.6 Daasity [toc=1.6 Daasity]
🎯 Why did we choose this tool?
Daasity is the honest pick for brands that genuinely need a warehouse. It builds the pipelines, applies an e-commerce data model, and connects your BI tool of choice.
I include it because sometimes the right answer is infrastructure, not another dashboard. Wholesale, retail, and Amazon data blended with DTC is exactly that case.
📊 Core evaluation metrics
Reasoning depth: Depends on the BI layer you attach, not on Daasity itself
E-commerce data model fit: High, with a purpose-built retail and DTC schema
Proactive delivery: Scheduled refreshes, typically overnight rather than real time
Time-to-first-insight: Weeks, with guided implementation
Connectors: Shopify, Amazon, ads, 3PL, ERP, and email platforms
Omnichannel brands blending DTC, wholesale, and marketplace data
Teams with an analyst or agency partner already in place
Businesses committing to a warehouse for the long run
❌ Skip it if
You want answers this week. This is plumbing, and plumbing takes time and budget before it pays off. Compare it against lighter reverse ETL options before you commit.
💰 Pricing
Custom quote / Month to Custom quote / Month. Daasity does not publish list pricing.
⭐ Reviews
Daasity holds a 4.8 out of 5 average across 11 verified G2 reviews, which is the highest average on this list, on the smallest sample.
"There are a few platforms that are not yet automated (we market in a few unique channels), so at times there is manual entry to create an overall marketing performance. That said, Daasity has made progress in consistently adding more platforms into their automation. Finally, at times I wish a few reports would refresh in real time (they do overnight)." — Verified User, Daasity - G2 Verified Review
1.7 Glew.io [toc=1.7 Glew.io]
🎯 Why did we choose this tool?
Glew.io does product-level and customer-level reporting better than most Shopify apps at its price. Segment by purchase frequency, product, or lifetime value, then export.
The trade-off shows up in the reviews. Accuracy complaints and slow loads appear across several years, which matters when finance uses the numbers.
📊 Core evaluation metrics
Reasoning depth: Low, with reporting rather than causal analysis
E-commerce data model fit: High for products, customers, and channels
Proactive delivery: Scheduled reports and email digests
Time-to-first-insight: Days
Connectors: Shopify, BigCommerce, Amazon, ads, and email platforms
✅ Solutions offered
Multichannel revenue and channel attribution reporting
Multichannel sellers running Shopify plus marketplaces
Merchandising teams needing SKU-level reporting
Brands wanting more depth than native Shopify reports
❌ Skip it if
You need one number that everyone trusts. Verify a full month against Shopify before you commit budget, the same way you would stress-test any Shopify reporting app.
💰 Pricing
~$1,550 / Month at $10M GMV to Custom quote / Month, per published competitor comparison data.
⭐ Reviews
"Data was often not accurate and adding new data sources was hard. The visualization was also subpar." — Verified User, 1.5/5 rating, Glew.io - G2 Verified Review
"Sometimes the software is slow to load or glitchy with realtime results. I think the software could also offer better automatic & actionable insights (similar to Google Analytics) base don performance by audience, channel, and product." — Verified User, 3.5/5 rating, Glew.io - G2 Verified Review
1.8 Microsoft Power BI with Copilot [toc=1.8 Power BI with Copilot]
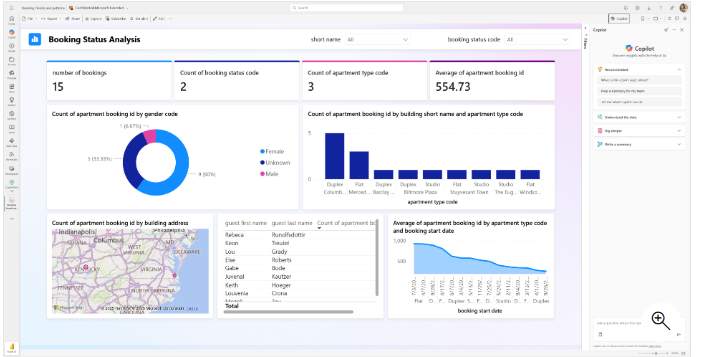
Power BI Copilot summarizes reports, but the semantic model and DAX work still needs an analyst.
🎯 Why did we choose this tool?
Power BI is the cheapest seat on this list and the deepest modeling engine. Copilot now summarizes reports and drafts DAX, which shortens analyst work.
Copilot does not remove the model, though. Somebody still writes the measures, and one operator I spoke with felt Power BI has fallen behind on how AI-ready it feels day to day.
📊 Core evaluation metrics
Reasoning depth: High in analyst hands, low without one
E-commerce data model fit: None out of the box
Proactive delivery: Data-driven alerts and subscriptions
Time-to-first-insight: Weeks to months, gated by modeling
Connectors: Hundreds, though Shopify and DTC sources often need third-party links
Finance groups that need auditable, governed reporting
❌ Skip it if
You are the analyst, the buyer, and the founder at once. The seat is cheap, and the labor is not.
💰 Pricing
$14 / user / Month to $24 / user / Month for Pro and Premium Per User, before Fabric capacity.
⭐ Reviews
"Power BI can become slow with very large datasets, and complex DAX formulas have a steep learning curve. Also, advanced customization of visuals and version control for reports could be improved." — Verified User, 5/5 rating, Power BI - G2 Verified Review
"It may allow you to create a multitude of custom calculations but it is not flexible and the query becomes cumbersome. The outcome of these cannot always be good for the dashboard performance or speed. Power BI has a limit on the size of data that it can ingest." — Verified User, 4.5/5 rating, Power BI - G2 Verified Review
1.9 Domo [toc=1.9 Domo]
🎯 Why did we choose this tool?
Domo belongs here because it scales across departments better than anything else on this list. Data apps, agents, and a large connector library sit in one platform.
The consumption model is the risk. Credits accrue on ingestion, transformation, and refreshes, and Domo does not offer hard credit caps.
📊 Core evaluation metrics
Reasoning depth: Solid on modeled data, with AI agents layered on top
E-commerce data model fit: None out of the box
Proactive delivery: Alerts and Domo Everywhere distribution
Time-to-first-insight: Weeks to months, with paid implementation common
Connectors: 1,000+ across enterprise and marketing sources
Larger organizations standardizing many teams on one platform
Companies with data engineering capacity in house
Businesses needing embedded analytics for external users
❌ Skip it if
You run a lean store on a fixed monthly budget. Minimum viable deployments start near $30,000 per year, and overages arrive as quarterly bills.
💰 Pricing
~$2,500 / Month to $8,000+ / Month equivalent, based on reported annual contracts of roughly $30,000 to $100,000.
⭐ Reviews
"Honestly, I think their pricing model is terrible. The way the pricing is set up now, especially with how we have different things like LMS, CLOT, JATGBT available to us, it makes it very hard to validate the pricing." — Verified User, Domo - G2 Verified Review
"We were notified two months before our renewal that next year's price was going to be 1,120% more than our last renewal price. This is with the same number of users and a decrease in consumption." — Verified User, Domo - G2 Verified Review
What this list tells you
Read the review patterns and one theme repeats. ✅ The vertical tools give you speed and lose you accuracy. ❌ The BI platforms give you depth and charge you an analyst. ✅ Both groups still hand you a chart and leave the reasoning to you.
Luca AI takes the other path, reasoning across marketing, finance, and operations on normalized data, then pushing the recommendation to Slack or email. That is the difference between a dashboard you check and an answer that finds you, which is the whole premise behind how operators use Luca AI.
Q2. How Did We Score These Nine Tools? [toc=2. Scoring Methodology]
Every tool was scored on five weighted criteria: Cross-Functional Reasoning Depth (25%), E-commerce Data Model Fit (20%), Proactive and Agentic Delivery (20%), Setup and Time-to-First-Insight (20%), and Verified User Reviews (15%). Scores of 0 to 20 earn one star, 21 to 40 earn two, 41 to 60 earn three, 61 to 80 earn four, and 81 to 100 earn five. Luca AI scores 5 stars.
⚠️ Why feature checklists mislead buyers
Feature lists reward vendors with the longest roadmap, not the tool that answers your question. Every platform here claims natural-language querying. Almost none of them explain why a number moved.
The category's own leaders have started saying this out loud. One analytics executive told me the real shift is from monitoring to recommending, because descriptive reporting no longer wins deals. That framing became our heaviest criterion.
📊 The five criteria and the exact test
Luca AI measures reasoning depth by asking a tool to trace one metric move back to its influencing components across two or more data sources. That is the test we ran on all nine.
Scoring Rubric for the 9 Augmented Analytics Tools
Criterion
Weight
The literal test
Disqualifying condition
Cross-Functional Reasoning Depth
25%
Ask why contribution margin fell last month, across ads, shipping, and returns data
Answers with a chart and no cause
E-commerce Data Model Fit
20%
Request blended MER, CAC by channel, and cohort repeat rate on connected data
Requires a custom semantic model first
Proactive and Agentic Delivery
20%
Set a ROAS and inventory alert, then a scheduled reasoned report
Alerts live only inside the app
Setup and Time-to-First-Insight
20%
Time from connecting sources to one trustworthy answer
Needs an analyst or a warehouse build
Verified User Reviews
15%
Read G2, Trustpilot, and Reddit threads for accuracy and support complaints
Repeated data-accuracy reports across years
⭐ How the stars were assigned
Tools that failed the reasoning test capped at three stars, regardless of price or brand. That single rule reshuffled the list more than any other input.
Review evidence carried the lowest weight on purpose. Ratings measure satisfaction with what a tool promised, not whether the architecture suits a store without an analyst.
❌ What we deliberately did not weight
Funding raised, customer logo counts, dashboard template libraries, and analyst-report placements were all excluded. None of them predict whether you get an answer on a Tuesday afternoon.
Peer-review directories like Gartner Peer Insights and Solutions Review earn trust by publishing their scoring methodology rather than their vendor relationships. That is the standard I tried to hold here, and it is the same standard we apply when we rank AI-powered BI tools for e-commerce.
💰 Our own conflict, stated plainly
I built Luca AI, so treat its five-star placement with appropriate suspicion and run the four tests yourself. Our rubric was written before scoring, not reverse-engineered after, but you have no way to verify that claim. You can, however, read how the reasoning engine works before you decide.
What I can hand you is the test protocol. Run the contribution-margin question in every demo you book, including ours, and score the answers side by side.
Luca AI is trained on the relationships between e-commerce metrics, which is why it links a CAC spike to creative fatigue, shipping cost changes, and returns in one answer rather than three separate tiles.
Q3. What Is Augmented Analytics, and Why Do E-commerce Dashboards Keep Failing? [toc=3. Definition and Dashboard Gap]
Augmented analytics uses machine learning and AI to automate data preparation, surface insights without being asked, and explain those insights in plain language. For an e-commerce operator, that means asking a question about MER (marketing efficiency ratio, or revenue divided by total ad spend) and getting a reasoned answer with root cause, instead of building another dashboard.
📊 What separates it from traditional BI
Three differences matter, and they are structural rather than cosmetic.
Traditional BI describes what happened. Augmented analytics proposes why, and what to do next.
Traditional BI needs you to build the dashboard. Augmented analytics answers a typed question.
Traditional BI waits for you to notice a problem. Augmented analytics scans and pings you.
You can ask Luca AI why last week's CAC moved and get the influencing components named, which is the practical shape of that third difference. That gap is what separates reasoning from a standard e-commerce analytics dashboard.
⚠️ Why the dashboards you own keep failing
The failure is not laziness. Operators check their dashboards constantly and still cannot act on them.
"Same. I feel like most of my day is stitching together exports instead of actually looking at trends." — u/Ok-Sample-2477, r/shopify Reddit Thread
"Shopify dashboards provide a decent overview of past performance, but they fall short when it comes to understanding the reasons behind the data." — u/Nervous-Feature3773, r/shopify Reddit Thread
💸 The stitching tax is real money
One operator I spoke with ran a business to 200 million in GMV while starting out on Shopify exports and returns-system exports in Excel. He said it makes him shudder now. That was not a tooling problem, it was a time problem.
Luca AI normalizes and standardizes data on ingestion, which removes the cleanup work that usually eats the first year of any warehouse project. Most of that work is e-commerce data integration nobody budgeted for.
✅ What actually gets automated
Four jobs move off your plate when the layer works properly.
Data preparation: joining Shopify, ad, email, and accounting data without manual mapping
Insight discovery: flagging outliers you did not think to check
Root-cause analysis: ranking which variables drove the change
Explanation: stating the finding in sentences, not just charts
One analytics leader put it bluntly to me: human-readable visualizations are a courtesy, not the substance. The chart is for you. The reasoning is the product.
❌ What this category does not do
Augmented analytics is not an attribution pixel, and no tool here replaces one. If you need click-path measurement, keep your attribution tool and treat these as a separate layer, the same way you would treat e-commerce conversion tracking.
It also cannot fix data you do not collect. Missing cost of goods sold means no honest contribution margin, whatever the AI claims.
Luca AI sits as an intelligence layer over your store's data, so it reasons across marketing, finance, and operations rather than re-measuring ad clicks.
Q4. AI-Native, AI-Retrofitted or E-commerce Vertical: Which Archetype Fits Your Stage? [toc=4. Archetype and Stage Fit]
Under roughly $1M in revenue, native reports plus one spreadsheet is enough. Between $1M and $10M, an AI-native or e-commerce vertical tool pays for itself once you run three or more paid channels. Above $10M with an analyst on payroll, warehouse-native BI with a copilot becomes defensible. The archetype is a cost structure, not a feature list.
📊 The three archetypes and their architectural tell
Each archetype has a giveaway. Find it and you know what your rollout will cost.
AI-Native vs AI-Retrofitted vs E-commerce Vertical Archetypes
Archetype
Architectural tell
Where it breaks
Examples here
AI-native
Reasoning engine first, charts optional
Thin governance for enterprise audits
Luca AI, Tellius, ThoughtSpot
AI-retrofitted BI
Copilot bolted onto a semantic model
Inherits the modeling tax underneath
Power BI, Domo
E-commerce vertical
Prebuilt DTC metrics, no modeling needed
Stops at reporting, not reasoning
Triple Whale, Polar, Daasity, Glew
Luca AI belongs in the first row and is explicit about the trade-off: strong reasoning for SMB and mid-market stores, not enterprise governance for a hundred-seat finance org.
⚠️ The retrofitted demo problem
A copilot demo looks fast because somebody already built the model. Your rollout starts before that step, not after it.
I could be reading this too strongly, but the operators I talk to who bought retrofitted BI describe the same pattern. The seat cost $14, and the analyst cost $90,000. That is the hidden bill inside most e-commerce business intelligence projects.
💰 Which tier fits your revenue band
Which Analytics Archetype Fits Your Revenue Band
Revenue band
Recommendation
Why
Under $1M
Native reports plus a spreadsheet
Not enough data history to reason against
$1M to $10M
AI-native, plus one vertical tool if ads are the bottleneck
No analyst, real channel complexity
$10M to $50M
AI-native alongside a warehouse, or vertical plus managed pipelines
Multiple functions need the same numbers
$50M and up
Warehouse-native BI with a copilot
Governance and audit trails dominate
Common Thread Collective notes that most brands between $5M and $10M are where real analytics discipline first forms, which matches the band where these tools start paying back.
❌ The build-versus-buy trap
Building looks cheaper until you price the maintenance. One founder told me his company spent about $10 million building a system to turn data into meaning, then watched general-purpose language models outperform it.
That is the honest case against building. Ask Luca AI the same question you would hand a new pipeline, and compare the answer against a number you already trust. Running that test on real operator use cases takes an afternoon, not a quarter.
⏰ When you should buy nothing yet
Two situations mean waiting. You sell on marketplaces only, so most of the useful data lives outside your control. Or you sit below roughly $1M, where twelve months of history cannot support pattern detection.
Bringing AI into a business resembles hiring a brilliant generalist on day one. Without onboarding, even a genius fails the first task.
Luca AI is built for the $1M to $5M operator with piling, unused data and no analyst to interpret it, and it is a poor fit for enterprises that already employ a data team.
Q5. Can You Trust the Answers? Metric Fluency, Explainability and the AI-Traffic Blind Spot [toc=5. Answer Quality and Trust]
Trust is the top blocker to AI adoption in DTC, and it is earned three ways. Ask each vendor to compute blended MER, true contribution margin after all post-invoice costs, and cohort repeat rate from your own data. Then ask it to show its reasoning. Then ask it to break out AI-referred traffic, which most tools still bucket as direct.
⚠️ Gross margin is the wrong denominator
Most founders decide using gross margin, which only covers what it costs to make the thing. It says nothing about what it costs to sell the thing.
The bleed sits in the costs between the supplier invoice and the bank balance. Shipping, returns, payment fees, discounts, 3PL storage, support labor, and acquisition all land after that invoice, which is why e-commerce profit margins rarely match the spreadsheet.
💸 One invoice, two very different truths
A consultant I trust described a founder sliding an invoice across the table, proud of a 72% gross margin bestseller. Twenty minutes later, they had rebuilt it line by line, and contribution margin came in at 8%.
The same math exposed a knife set carrying about $13,000 a year in support costs, or $1.45 per unit. That number never appears on a standard dashboard.
📊 The three tests to run in every demo
Three Trust Tests for Augmented Analytics Vendors
Test
What to ask
Fail signal
Metric fluency
Compute blended MER, contribution margin, and 90-day repeat rate
Needs a custom model or a CSV upload
Explainability
Show the reasoning chain and the fields used
Returns a number with no trail
AI-traffic visibility
Break out ChatGPT and AI-referred sessions
Buckets them as direct
Luca AI measures metric fluency by reasoning across connected sources, so a margin question pulls ad spend, shipping cost, and returns into one answer rather than three lookups.
✅ The benchmark yardstick to check against
Common Thread Collective's Q1 2026 benchmark covers 299 DTC brands, $1.01B in revenue, and $231M in ad spend. Median MER landed at 4.23x, with contribution margin at 29.3%.
Triple Whale's 2025 dataset, built on $18.4B in spend across more than 33,000 brands, puts median paid conversion at 2.01%. If a tool's numbers sit far outside those ranges, ask why before you act, and check them against your own e-commerce KPIs.
⏰ The AI-traffic blind spot nobody is pricing yet
Shopify's Q1 2026 data shows AI-referred orders growing nearly 13x year over year, with chatbot referral sessions up 8x. Those sessions convert about 50% better and carry 14% higher average order values.
Ask Luca AI which referrers drove last month's incremental orders, and you get a segmentation that does not depend on a prebuilt channel grouping. Most tools cannot answer that question yet at all.
❌ Where accuracy complaints show up
"Some data we still notice discrepancies between platforms, for example, tracking ads, and differences in the reported metrics like revenue." — Verified User, 4/5 rating, Triple Whale - G2 Verified Review
"Data was often not accurate and adding new data sources was hard. The visualization was also subpar." — Verified User, 1.5/5 rating, Glew.io - G2 Verified Review
Survey data from 875 DTC operators shows 93.5% already use AI, yet only about 60% have anyone who owns it, and trust ranks as the biggest barrier.
Luca AI is built to replace a junior e-commerce data analyst, so it simulates scenarios and traces a margin move to its influencing components instead of handing you a number with no chain of reasoning.
Q6. What Can You Actually Automate, and How Do You Roll It Out in 30 Days? [toc=6. Automation and Rollout]
Set five alerts and one recurring reasoned report, then delete a manual report. Week one, connect Shopify, ad platforms, email, and accounting. Week two, resolve schema conflicts like retail-week calendars. Week three, ask ten questions you currently answer by hand and validate each against a known number. Week four, configure push alerts and cancel a legacy report.
⚠️ Why checking a dashboard never works
Polling requires you to remember, log in, and notice. Nobody does that reliably during a Q4 week.
Automation flips the direction. The system watches the numbers and interrupts you only when something breaks the pattern, which is the whole point of e-commerce monitoring tools.
📊 The five alerts worth setting first
Start with thresholds you would actually act on, not vanity metrics.
ROAS drop: alert when a channel falls 20% below its trailing 14-day average
CAC spike: alert when blended CAC rises 15% week over week
Inventory cover: alert when any A-item drops below 21 days of cover
Conversion rate: alert when paid conversion falls under 2%, near the DTC median
Return rate: alert when any SKU exceeds its 90-day return baseline
Luca AI scans your data 24/7 and pings you in Slack, email, or the app when ROAS dips, inventory falls below threshold, or CAC spikes.
✅ What agentic delivery means in practice
A scheduled report should arrive with reasoning attached, not just charts. Ask for weekly CAC across Meta and Google, with the attribution model you use, plus a short explanation of the change.
That is the difference between a subscription email and a junior analyst. One shows numbers, the other tells you which one moved and why. Set up properly, automated data reporting replaces the Sunday-night rebuild.
⏰ The four-week rollout
Week one: connect Shopify, Meta, Google, Klaviyo, and your accounting tool. Expected outcome, one unified data view.
Week two: fix schema conflicts. Retail-week calendars are the classic trap, where a 554 layout meets a 332 layout and every weekly comparison breaks.
Week three: ask ten questions you currently answer manually. Validate each against a number you already trust, then log the misses.
Week four: configure the five alerts, set one recurring report, and cancel a legacy manual report.
Luca AI normalizes and standardizes data on ingestion, which is why week two usually collapses to a checkbox instead of a project. Most of that work is ordinary e-commerce data management nobody wants to own.
💰 Where the time savings actually land
One operator told me a data manipulation task he expected to take two weeks finished in about 90 seconds. Another loaded a full year of product sales into an AI tool and got a warehouse slotting plan, deciding what sat at hip height versus head height.
Neither of those is a reporting win. Both are labor and cash wins, which is the only test that matters. The inventory side of that lives in e-commerce inventory management, not marketing.
❌ Keep a human in the loop
A premium bike brand published a homepage image showing a $20,000 bike with the rear derailleur on the front wheel. Unsupervised AI autonomy did that. Do not remove the QA step, and never let the AI be the QA.
Alert fatigue is the other failure mode. Five alerts you act on beat twenty you mute within a month.
Luca AI can be given standing tasks, like studying a customer-analytics pattern and flagging periodic warnings, so monitoring runs without anyone opening a dashboard.
Q7. What Does This Really Cost at $2M, $10M and $50M, and Which Should You Pick? [toc=7. True Cost and Final Pick]
List price is roughly 40 to 60% of year-one total cost. Seat-based BI starts near $14 per user per month but needs an analyst and a warehouse. E-commerce vertical tools typically run $219 to $2,799 per month by revenue tier. Budget separately for implementation, connector maintenance, data cleanup, and training before you compare sticker prices.
💰 The four hidden line items
Vendors quote the subscription. Your finance lead pays for four more things.
Implementation: modeling, pipeline setup, or paid onboarding
Data cleanup: the schema year that warehouse-first stacks assume
Connector maintenance: breakages when a third-party API changes
Training: the weeks before anyone trusts the output
Luca AI removes the largest of those by normalizing data on ingestion, so the cleanup year never lands on the invoice. Connector upkeep is the other quiet cost inside most e-commerce API integrations.
📊 Year-one cost by revenue band
Year-One Total Cost of Augmented Analytics by Revenue Band
Revenue
Realistic year-one range
What drives it
$2M
$3,600 to $12,000
One AI-native or vertical tool, no analyst
$10M
$18,000 to $45,000
Vertical plus pipelines, or AI-native plus a warehouse
$50M
$80,000 to $250,000+
Analyst salary, Fabric or credit consumption, governance
Domo deployments commonly start near $30,000 a year and scale on credits, with reported renewals reaching six figures.
⚠️ Read the contract, not the demo
"We were notified two months before our renewal that next year's price was going to be 1,120% more than our last renewal price. This is with the same number of users and a decrease in consumption." — Verified User, Domo - G2 Verified Review
"Nothing. This tool is full of promises, but you are met with unstable connectors, unresponsive/incompetent customer service, and obscene limitations for any scalable business." — Verified User, Supermetrics - G2 Verified Review
✅ Three scenarios, three picks
$2M Shopify brand, two paid channels, no analyst: buy one AI-native tool. Skip the warehouse entirely.
$10M brand, four channels plus wholesale: pair an AI-native layer with managed pipelines if wholesale data matters.
$50M brand with an analyst: warehouse-native BI with a copilot becomes defensible, and governance justifies the cost.
Luca AI prices at €299, €499, and custom per month, which sits below a single analyst day rate at most agencies. Current tiers sit on the Luca AI pricing page.
⏰ When the answer is buy nothing
Below roughly $1M in revenue, or marketplace-only, wait. You do not yet have the data history that makes pattern detection worth paying for.
One founder spent about $10 million building an internal system to turn data into meaning, then watched general models outperform it. That is the cost of building too early, at scale.
💸 Your Monday action
Pick your top-selling SKU. Compute contribution margin line by line, including shipping, returns, payment fees, discounts, storage, support, and acquisition cost. If you want the mechanics, start with tracking e-commerce unit economics.
Do that before you book a single demo. The number you get becomes the question every vendor has to answer correctly.
What I am still sitting with is whether AI-referred traffic reprices this whole category within a year. If your store is already seeing those sessions convert differently, I would genuinely like to hear what your numbers say.
FAQ's
What are augmented analytics tools, and how are they different from a BI dashboard?
Augmented analytics uses machine learning and AI to automate data preparation, surface insights without being asked, and explain those findings in plain language. A BI dashboard reports what happened. Augmented analytics proposes why it happened and what to do next.
Three structural differences matter for an operator:
Descriptive versus prescriptive: BI shows the number. Augmented analytics ranks the variables that moved it.
Built versus asked: BI needs someone to design and maintain the view. Augmented analytics answers a typed question.
Polling versus pushing: BI waits for you to notice. Augmented analytics scans continuously and pings you.
Luca AI sits as an intelligence layer over your store's data, so a question about last week's CAC returns the root cause and the influencing components rather than another tile to interpret. We built it that way because operators told us the chart was never the bottleneck.
One caveat worth stating plainly: this category is not an attribution pixel and does not replace one. If you need click-path measurement, keep your existing tool. For the wider category map, our guide to e-commerce business intelligence shows where each layer fits.
Which augmented analytics tools are best for a Shopify store without a data analyst?
If nobody on payroll owns data, the archetype matters more than the feature list. AI-native and e-commerce vertical tools work without a semantic layer. Enterprise BI with a copilot does not.
Luca AI: plain-English questions, root-cause analysis, and proactive alerts, priced from €299 per month.
Triple Whale: strongest if your single bottleneck is ad measurement, from $219 per month.
Polar Analytics: prebuilt Shopify dashboards, from roughly $720 per month.
Glew.io: product and customer reporting for multichannel sellers.
The tools that struggle here are ThoughtSpot, Power BI with Copilot, Domo, and Tellius. Each expects a warehouse and a modeling owner, and G2 reviewers consistently flag the learning curve as the real cost.
Luca AI normalizes and standardizes data on ingestion, which is why teams without an analyst usually reach a trustworthy answer in the first week instead of after a modeling project. We are also explicit about fit: enterprises with existing data teams should look elsewhere. Our roundup of the best Shopify analytics apps covers the lighter end of this stack.
How much do augmented analytics tools cost in 2026, including hidden costs?
List price is roughly 40 to 60% of year-one total cost. Budget the subscription, then budget four more line items separately.
Implementation: data modeling, pipeline setup, or paid onboarding.
Data cleanup: the schema year that warehouse-first stacks quietly assume.
Connector maintenance: breakages whenever a third-party API changes.
Training: the weeks before anyone trusts the output enough to act.
Published sticker prices vary widely. Power BI runs $14 to $24 per user per month. ThoughtSpot starts near $25 per user per month. Triple Whale sits between $219 and $749 per month by GMV band. Polar Analytics reaches roughly $2,799 per month for a $10M GMV brand. Domo deployments commonly begin near $30,000 per year on credits, and one G2 reviewer reported a renewal quoted at 1,120% above the prior year.
Luca AI removes the largest hidden item by normalizing data on ingestion, so the cleanup year never lands on the invoice. Realistic year-one totals land near $3,600 to $12,000 at $2M revenue, and $18,000 to $45,000 at $10M. Current tiers sit on our pricing page.
How do I test whether an augmented analytics tool can be trusted with my numbers?
Run three tests in every demo, using your own connected data rather than the vendor's sample dataset.
Metric fluency: ask it to compute blended MER, true contribution margin after all post-invoice costs, and 90-day cohort repeat rate. A request for a CSV upload or a custom model is a fail.
Explainability: ask it to show the reasoning chain and the fields it used. A number with no trail is a fail.
AI-traffic visibility: ask it to break out ChatGPT and other AI-referred sessions. Most tools still bucket those as direct.
Then sanity-check the output against public benchmarks. Median DTC MER sits near 4.23x with contribution margin around 29.3%, and median paid conversion sits near 2.01%. Numbers far outside those ranges deserve a question before they deserve a decision.
Luca AI measures metric fluency by reasoning across connected sources, so a margin question pulls ad spend, shipping cost, and returns into one answer instead of three separate lookups. Trust is the top blocker to AI adoption in DTC, and it is earned by showing the work. Start with our breakdown of contribution margin versus gross margin.
When is an e-commerce brand too small for augmented analytics?
Two situations mean waiting, and we would rather say so than sell into a bad fit.
Below roughly $1M in annual revenue: twelve months of thin history cannot support reliable pattern detection or anomaly baselines. Native reports plus one spreadsheet is genuinely enough.
Marketplace-only sellers: most of the useful behavioral data lives inside platforms you do not control, so a reasoning layer has less to reason against.
The payback window opens between $1M and $10M in revenue, once you run three or more paid channels and nobody can explain a margin move without a week of digging. Common Thread Collective observes that real analytics discipline usually forms between $5M and $10M, which matches what we see.
Above $10M with an analyst on payroll, warehouse-native BI with a copilot becomes defensible on governance grounds alone. Luca AI is built for the $1M to $5M operator with piling, unused data and no analyst to interpret it, and it is a poor fit for enterprises that already employ a data team. Before you buy anything, compute unit economics on one SKU using our guide to tracking e-commerce unit economics.
Enjoyed the read? Join our team for a quick 15-minute chat — no pitch, just a real conversation on how we’re rethinking Ecommerce with AI - Luca
Loading Schedule...
Your AI Co-Founder is here.
Here’s why:
Shopify, Meta, Xero - one brain.
"Should I scale?" Answered with real data.
Growth capital. No applications. One click.
Thank you! Your submission has been received! Please book a time slot for the Meeting
Oops! Something went wrong while submitting the form.