9 Best Cross Channel Analytics Tools for Ecommerce in 2026
12
mins read
In this article
TL;DR
The nine best cross channel analytics tools for ecommerce in 2026 are Luca, Looker, Bloomreach, BigQuery plus Fivetran, Triple Whale or Northbeam, Microsoft Copilot, Claude, Grafana, and Shopify Analytics.
Each tool owns a different layer of the stack, so treat this as a stack you assemble, not one winner, and buy the reasoning layer early.
We scored tools on five weighted criteria, led by Cross-Functional Intelligence at 30% and Data Unification at 25%, because dirty data upstream makes every tool downstream lie.
Triple Whale and Northbeam stay useful for attribution if treated as directional; use MTA for direction, MMM for hypotheses, and incrementality tests for proof.
Gross margin hides truth; eight costs between the supplier invoice and profit are where brands bleed, so compute real per-SKU contribution margin instead.
An AI Co-Founder reasons across inventory, cash, ads, and customers proactively; judge any bundled capital separately on rate, disbursal speed, and terms.
Q1. What are the 9 best cross channel analytics tools for ecommerce in 2026? [toc=1. Best Cross Channel Tools]
The nine best cross channel analytics tools for ecommerce in 2026 are Luca, Looker, Bloomreach, BigQuery plus Fivetran, Triple Whale or Northbeam, Microsoft Copilot, Claude and Claude Code, Grafana, and Shopify Analytics. Each one owns a different layer of the stack, from the AI reasoning layer down to the raw data warehouse. Treat this as a stack you assemble, not a single winner you crown.
Here is the thing most listicles miss. Your store already generates more data than you read. Most operators process maybe 5% of it, then run the business on group chats and a gut feeling. The problem is not that you lack tools. The problem is the data sits in ten programs that never talk, so you spend Sunday night triangulating numbers instead of acting on them. These nine tools each attack one slice of that mess, and I will tell you which slice. If you want the wider picture first, our guide to the e-commerce tech stack maps how these layers fit together.
Below is the shortlist with a one-line "best for" on each. After the comparison table, I break down every tool in detail.
Luca, best for AI-driven cross-functional reasoning over your whole data warehouse [toc=1.1 Luca]
Looker, best for flexible, AI-ready business intelligence dashboards [toc=1.2 Looker]
Bloomreach, best for a single source of truth on the customer [toc=1.3 Bloomreach]
BigQuery plus Fivetran, best for the underlying data warehouse and pipeline [toc=1.4 BigQuery + Fivetran]
Triple Whale or Northbeam, best for omnichannel marketing attribution [toc=1.5 Triple Whale / Northbeam]
Microsoft Copilot, best for AI analysis inside Excel [toc=1.6 Microsoft Copilot]
Claude or Claude Code, best for agentic, on-demand cohort analysis [toc=1.7 Claude / Claude Code]
Grafana, best for real-time observability and metric monitoring [toc=1.8 Grafana]
Shopify Analytics, best for native, customizable store reporting [toc=1.9 Shopify Analytics]
📊 Cross Channel Analytics Tools Compared
Cross Channel Analytics Tools Compared
Tool (Rating)
Key Capabilities
Best For
Pricing
Luca ⭐⭐⭐⭐⭐
AI layer over your data warehouse; plain-English questions; proactive alerts; auto reports; embedded capital
AI-native cross-functional intelligence for scaling DTC brands
Native store reports, customizable dashboard, mobile app
Native store-level reporting
Included with Shopify (~$39/mo, ~$399/mo)
1.1 Luca, The AI Layer Over Your Data Warehouse [toc=1.1 Luca]
Luca's homepage showcases an AI-powered intelligence layer built for €1M–€100M ecommerce brands, unifying business data and analytics into a single conversational cross-channel platform.
🤖 Why did we choose this tool?
I will be straight with you, since I co-founded Luca. It leads this list because it does the one thing every other tool on it forces you to do by hand: reason across your data. Most analytics tools added AI. Luca is AI, an intelligence layer that sits over your warehouse, standardizes data on ingestion, and answers questions in plain English. No SQL, no analyst, no dashboard to build. It scans your data around the clock and pings you when something breaks. That is the difference between a report you read and a co-founder who tells you what to do. If this framing is new to you, our take on agentic AI for ecommerce founders unpacks it further.
✅ Solutions Offered
Ask any question about your business in plain English and get a reasoned answer, not just a chart.
Proactive alerts to Slack, email, or app when ROAS dips, CAC spikes, or inventory falls below a threshold.
Automated weekly and monthly reports with graphs, reasoning, and clear recommendations.
Single source of truth that connects Shopify, Meta, Google, Klaviyo, and accounting tools, standardized on ingestion.
Root-cause analysis and forecasting across marketing, finance, and operations in one place.
❤️ Best For
Scaling DTC and mid-market brands past roughly $10K MRR with data in multiple silos.
Founders, CFOs, and Heads of Growth who want answers, not dashboard-building homework.
⚠️ What was the problem: A UK homeware brand doing mid-seven figures ran reporting off manual Shopify and returns-system exports. One product category had quietly collapsed from 20,000 units a year to almost nothing, masked by a rising category, and nobody noticed for months.
💡 How Luca helped: They connected Shopify, their ad platforms, and their returns data to Luca. It standardized everything on ingestion and flagged the category shift automatically, then surfaced the true per-SKU contribution margin behind the blended average.
✅ What was the outcome: The team caught the decline weeks earlier the following season, reallocated inventory spend toward the growing category, and replaced the Sunday-night export ritual with proactive alerts.
1.2 Looker, The Dynamic BI Choice [toc=1.2 Looker]
📊 Why did we choose this tool?
Looker earns its place because it does one job very well: it joins siloed datasets horizontally and models them so your whole team reads the same numbers. Operators who compared it to Power BI kept choosing Looker for its flexibility, its cost structure at scale, and how AI-ready it feels heading into 2026. It is a governed, cloud-native platform, meaning IT controls the data definitions centrally, so your "revenue" means the same thing in every report. It sits on top of a warehouse like BigQuery and turns raw tables into shared dashboards. For the broader category, compare the leading ecommerce analytics platforms.
✅ Solutions Offered
LookML modeling layer that defines metrics once and reuses them everywhere.
Joins data from many sources into unified, explorable dashboards.
AI-assisted querying and natural-language exploration for faster answers.
Tight integration with BigQuery and the wider Google Cloud stack.
Granular governance and permissions for larger teams.
🛠️ Best For
Mid-market and larger brands with a data analyst or engineer on staff.
Teams already inside Google Cloud or running a BigQuery warehouse.
Operators who need governed, consistent metrics across many users, the way a strong ecommerce analytics dashboard should deliver.
A fair trade-off to name: Looker shows you what happened and lets you slice it, but it still waits for you to ask the right question. It is a place to look, not a system that pings you when your ROAS quietly slips on a Tuesday. That gap between a dashboard you check and a layer that watches for you is exactly where an AI reasoning tool like Luca picks up, sitting on the same warehouse Looker visualizes and turning passive views into proactive alerts.
1.3 Bloomreach, The Customer Source of Truth [toc=1.3 Bloomreach]
❤️ Why did we choose this tool?
A founder I spoke with migrated from Klaviyo to Bloomreach and called it expensive and painful. He did it anyway, for one reason: he wanted a single point of truth around the customer. Bloomreach is a customer data platform, meaning it stitches every touchpoint (email, SMS, WhatsApp) into one profile per shopper. That unified profile is what feeds clean context into everything downstream. If your customer data is scattered, no AI on top of it will reason well, which is why ecommerce data integration matters so much.
✅ Solutions Offered
Customer data platform that unifies profiles across channels.
Email, SMS, and WhatsApp campaigns from one engagement engine.
Real-time segmentation based on live behavior.
AI-driven product and content recommendations for merchandising.
Loyalty and retention journeys tied to first-party data.
🛠️ Best For
Mid-market brands doing heavy email, SMS, and WhatsApp volume.
Retailers who need one clean customer profile across regions.
Teams willing to invest in a migration for long-term data trust, especially those focused on ecommerce customer segmentation.
A fair trade-off: Bloomreach owns the customer layer beautifully, but it does not reason across your ad spend, inventory, and cash in one place. It is a source of truth to plug into, not the brain that acts on it.
1.4 BigQuery plus Fivetran, The Data Warehouse Stack [toc=1.4 BigQuery + Fivetran]
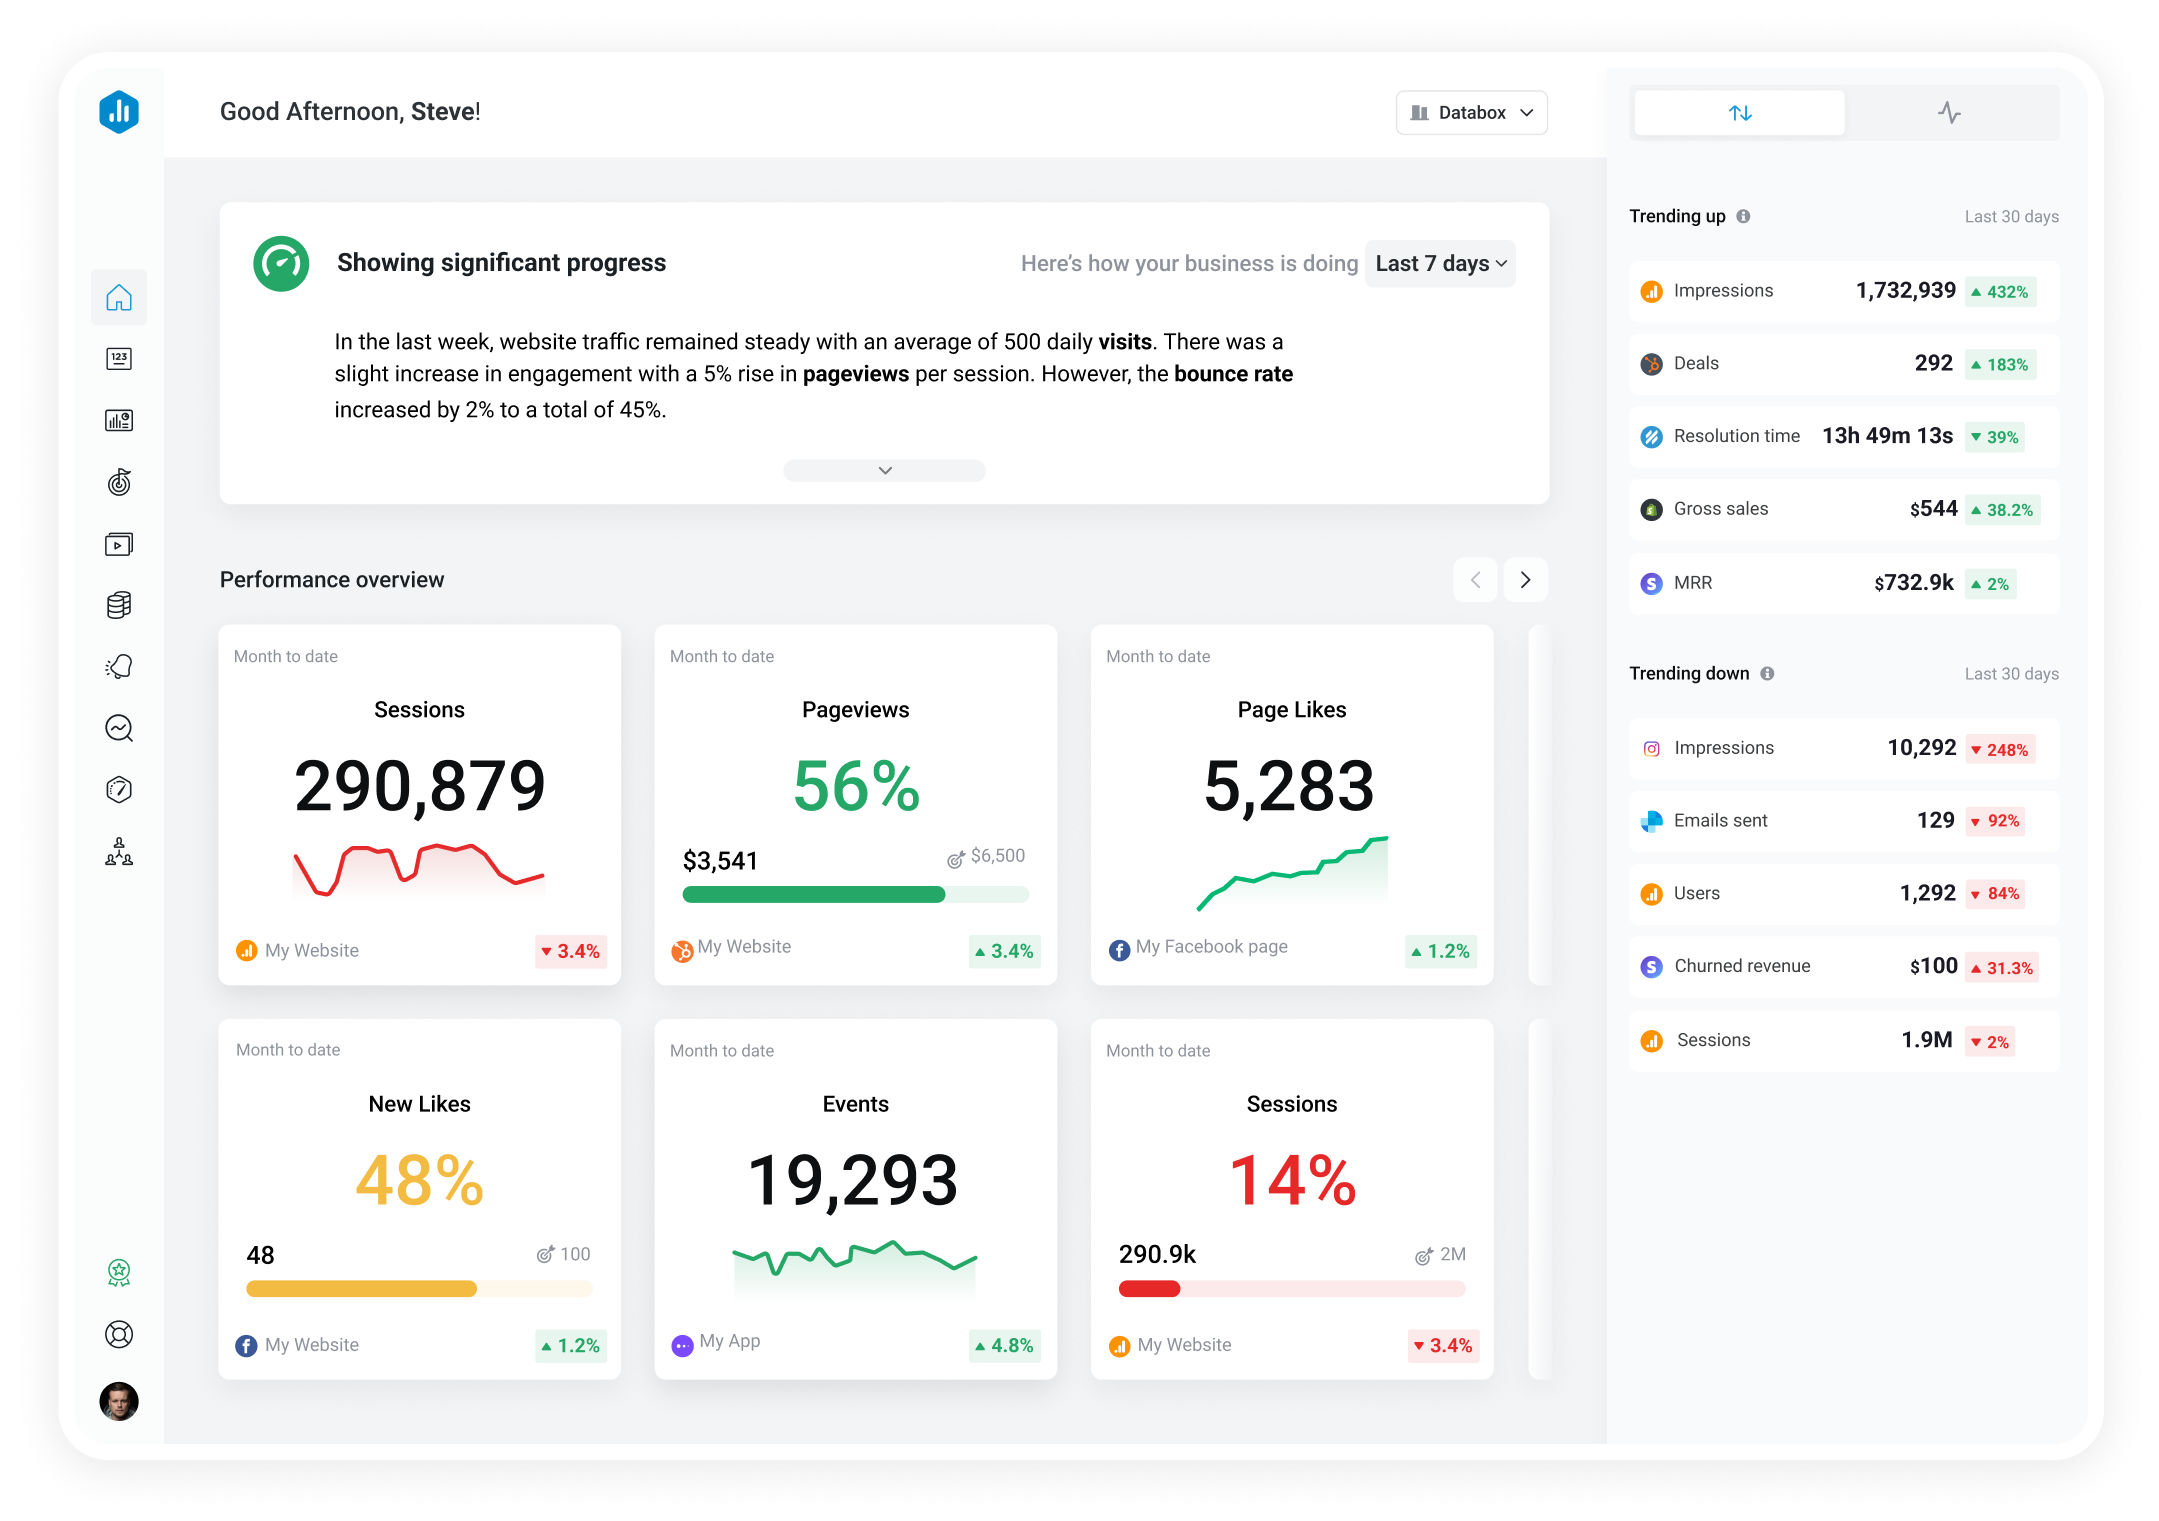
A cross-channel analytics dashboard displays ecommerce KPIs like sessions, pageviews, gross sales and MRR, with trending-up and trending-down metrics unifying website, social and revenue data.
🗄️ Why did we choose this tool?
This pairing is the plumbing under everything else. Fivetran is an ELT tool, meaning it Extracts data from your sources, Loads it, then Transforms it, pulling from APIs continuously so your tables stay fresh. BigQuery is Google's serverless warehouse where that data lands for SQL analysis. Most brands do not need to build this until they outgrow app-level reporting. When you do, it is the foundation a real intelligence layer sits on, and solid ecommerce API integrations keep it fed.
✅ Solutions Offered
Continuous, automated data syncs from Shopify, Meta, Google, and more.
Serverless storage that scales without managing servers.
Fast SQL querying across billions of rows.
Pre-built connectors that cut engineering setup time.
A central store other tools (Looker, Luca) can read from.
🛠️ Best For
Brands with enough data volume to justify a warehouse.
Teams with SQL skills or a data engineer on hand.
Operators building a long-term, tool-agnostic data management foundation.
The honest limit here: a warehouse stores and moves data, it does not interpret it. You still need something on top to turn those tables into decisions. That "something on top" is exactly the layer we built Luca to be, reading a warehouse like this and answering questions in plain English so you skip the SQL.
1.5 Triple Whale or Northbeam, The Attribution Specialists [toc=1.5 Triple Whale / Northbeam]
🎯 Why did we choose this tool?
If your main pain is "Meta and Shopify disagree on what my ads sold," this is the category you want. Triple Whale and Northbeam specialize in omnichannel attribution, meaning they assign credit for a sale across the channels a customer touched. They give a cleaner blended picture than any single platform's self-reported numbers. I will say this plainly, though: attribution is directional, not gospel. Treat these numbers as a strong hypothesis, then validate with holdout tests. If you are weighing options, see our roundup of Triple Whale alternatives.
✅ Solutions Offered
Blended ROAS across Meta, Google, TikTok, and more.
First-party pixel to reduce post-iOS 14 tracking loss.
Customer journey view from ad click to purchase.
Daily profit and performance dashboards.
Media mix modeling on higher tiers.
🛠️ Best For
DTC brands spending meaningfully across multiple ad channels.
"I love how seamlessly it connects our ad platforms and CRM data, showing exactly where our conversions come from and which campaigns drive the most revenue. Its made attribution so much clearer." Verified User Triple Whale G2 Verified Review
"Its very easy to use and works good for a multichannel solution. Sometimes it does not update the numbers correctly and has errors with synchronisation." Verified User Triple Whale G2 Verified Review
The recurring theme in those reviews (numbers that occasionally do not tally with Shopify) is the whole point. These tools see marketing clearly but miss cash flow and operations. That is why we built Luca to sit above attribution, not replace your pixel, reading its output alongside inventory and margin so one channel's ROAS never gets read in isolation.
1.6 Microsoft Copilot, Excel's AI Brain [toc=1.6 Microsoft Copilot]
🧮 Why did we choose this tool?
A lot of operators quietly run their real analysis in Excel, not a fancy dashboard. One founder told me his inventory system's native AI kept hallucinating, so he shut it down and now extracts data into Copilot instead. Copilot is Microsoft's AI assistant built into Excel and the Office suite. It writes formulas, forecasts demand, and slots SKUs from plain-English prompts. It is the pragmatic choice when your data already lives in spreadsheets, though a purpose-built AI tool for Shopify owners goes further.
✅ Solutions Offered
Natural-language formula writing inside Excel.
Demand forecasting and trend analysis on your own sheets.
SKU-level slotting and sorting from a full year of sales data.
Summaries and charts generated from raw ranges.
Tight integration across Word, PowerPoint, and Teams.
🛠️ Best For
Operators whose analysis already lives in Excel.
Finance teams inside the Microsoft ecosystem.
Brands wanting AI help without a new data platform.
One caution worth naming: Copilot is only as good as the sheet you point it at. Prompt it on messy, uncleaned data and it will hand you confident nonsense. This is why data standardized on ingestion (what we do inside Luca) matters more than the model itself.
1.7 Claude or Claude Code, The Agentic Analyst [toc=1.7 Claude / Claude Code]
🧠 Why did we choose this tool?
Here is a real moment that stuck with me. A founder ran four or five cohort analyses through Claude Code and found that product-category diversity, not purchase frequency or average order value, was his top driver of customer lifetime value. Claude Code is Anthropic's agentic coding tool, meaning it can run analysis through a terminal or API, not just chat. For deep, one-off questions, it acts like an analyst you can summon on demand.
✅ Solutions Offered
Multi-cohort analysis run through code, not manual pivots.
Root-cause exploration across your own datasets.
API and terminal access for repeatable scripts.
Plain-language reasoning over uploaded data.
Flexible, open-ended analysis general dashboards cannot do.
🛠️ Best For
Technically comfortable founders and analysts.
Teams needing bespoke, exploratory analysis.
Operators testing hypotheses their dashboard cannot answer.
The trade-off is real: Claude is powerful but generic. It does not know ecommerce metric relationships out of the box, and it will not proactively ping you when ROAS dips next Tuesday. That proactive, ecommerce-trained watchfulness is the line between a tool you drive and a co-founder like Luca, backed by purpose-built agents for ecommerce, that watches for you.
1.8 Grafana, The Observability Agent [toc=1.8 Grafana]
📡 Why did we choose this tool?
Grafana comes from the engineering world, and that is its edge. It reads metrics, logs, and traces directly, then builds live dashboards you can watch in real time. For ecommerce, that means site performance, checkout health, and API uptime in one view. Given that a one-second delay in page load can cut conversions by 7%, watching site health is not a nice-to-have. It is revenue protection.
✅ Solutions Offered
Real-time dashboards for metrics, logs, and traces.
Alerting when a metric crosses a set threshold.
Broad data source support across your stack.
Open-source core with a hosted cloud option.
Custom panels built for specific investigations.
🛠️ Best For
Brands with meaningful engineering resources.
Teams monitoring site speed and infrastructure health.
Operators who treat uptime as a conversion lever, alongside their core ecommerce KPIs.
To be fair about fit: Grafana is built for system telemetry, not marketing and finance synthesis. It watches your infrastructure well, but it will not tell you why your contribution margin slipped last month.
1.9 Shopify Analytics, The Native Baseline [toc=1.9 Shopify Analytics]
🛒 Why did we choose this tool?
Do not sleep on what you already pay for. Shopify's 2025/2026 analytics update lets you fully customize the dashboard down to the metrics that matter, on both desktop and the mobile app. For a store doing most of its volume on Shopify, this is a genuinely useful free baseline. It will not unify Amazon or wholesale, but for single-channel reporting it covers a lot of ground at zero extra cost. For a deeper walkthrough, read our Shopify analytics dashboard explainer.
✅ Solutions Offered
Customizable dashboards on web and mobile.
Core sales, traffic, and conversion reporting.
Product and customer-level breakdowns.
Real-time store activity view.
Included with every Shopify plan.
🛠️ Best For
Shopify-first brands with light multi-channel needs.
Early-stage stores watching cash before adding tools.
The ceiling is clear: Shopify Analytics sees Shopify. The moment your revenue spans Amazon, Etsy, wholesale, and paid social, you need a layer that unifies all of it. That is the gap Luca fills, reasoning across every channel through true ecommerce omnichannel analytics and pinging you before a problem shows up in next Sunday's export, not after.
Q2. How were these 9 tools scored (our weighted methodology)? [toc=2. Scoring Methodology]
We scored each tool on five weighted criteria: Cross-Functional Intelligence 30%, Data Unification and Standardization 25%, Setup and Usability 20%, Operator Trust and Data Hygiene 15%, and Pricing Transparency 10%. Tools scoring 81 to 100 earn 5 stars, 61 to 80 earn 4, 41 to 60 earn 3, 21 to 40 earn 2, and 0 to 20 earn 1. The weighting favors tools that turn scattered data into decisions, not tools that draw prettier charts.
📐 Why these weights, in operator terms
I will be honest about the bias baked in here. Most tools stop at building dashboards to show off their technical range, when the real job is making the decisions a busy founder cannot get to. So Cross-Functional Intelligence carries the most weight (30%), because reasoning across marketing, finance, and operations is where money is actually won or lost, the core idea behind real ecommerce business intelligence.
Data Unification and Standardization sits second at 25% for a blunt reason. Feed any AI poor or uncleaned data, and it hands back answers that are not quite right. If two tools drink from the same contaminated water upstream, both lie downstream, so clean ingestion matters more than a slick interface, which is why we obsess over ecommerce data integration.
⭐ How to read the star bands
The remaining weights reward practical reality. Setup and Usability (20%) respects that you do not have a spare quarter to implement software. Operator Trust and Data Hygiene (15%) is a criterion no vendor listicle uses, and it penalizes tools that skip bot filtering or invalid-traffic checks. Pricing Transparency (10%) rewards clear numbers over "talk to sales."
Weighted Scoring by Tool
Tool
Cross-Functional Intelligence (30%)
Data Unification (25%)
Setup and Usability (20%)
Trust and Data Hygiene (15%)
Pricing Transparency (10%)
Rating
Luca
High
High
High
High
High
⭐⭐⭐⭐⭐
Looker
Medium
High
Medium
High
Low
⭐⭐⭐⭐
Bloomreach
Medium
High
Medium
Medium
Low
⭐⭐⭐⭐
BigQuery plus Fivetran
Low
High
Low
High
Medium
⭐⭐⭐⭐
Triple Whale / Northbeam
Medium
Medium
High
Medium
Medium
⭐⭐⭐
Microsoft Copilot
Medium
Low
High
Medium
High
⭐⭐⭐⭐
Claude / Claude Code
High
Low
Medium
Medium
High
⭐⭐⭐⭐
Grafana
Low
Medium
Low
High
High
⭐⭐⭐
Shopify Analytics
Low
Low
High
High
High
⭐⭐⭐⭐
Luca earns its 5 stars on the two heaviest criteria, not as a default. We built it to standardize data on ingestion and reason cross-functionally, which is exactly what those top two weights reward, the same principle behind our approach to ecommerce data management. You can disagree with our weights, and that is the point of showing them.
Q3. Attribution tool, BI dashboard, data warehouse, or AI layer, which do you actually need for your channels? [toc=3. Which Layer You Need]
Attribution tools tell you which channel drove a sale. BI dashboards visualize what happened. A data warehouse stores and joins raw data. An AI layer reasons across all of it and tells you what to do next. If you sell only on Shopify, native analytics plus one layer may be enough. If you span Amazon, Etsy, and wholesale, you need a warehouse plus a reasoning layer to unify it. Most operators need the reasoning layer first.
🧩 The fragmented-context problem
Here is what I keep seeing inside real teams. Twenty people each run their own AI tool sessions, each with its own context, and no central brain holds the whole picture. Marketing reads one number, finance reads another, and nobody agrees.
It gets worse when your channel percentages sum past 100%. Meta claims a sale, Klaviyo claims the same sale, and your spreadsheet quietly double-counts revenue. That is not a reporting bug. That is four tools answering four different questions, and none of them talking, a gap better ecommerce reporting is meant to close.
📊 Four layers, four jobs
The Four Analytics Layers Compared
Layer
Job it does
Data it uses
Output
Who it's for
Attribution tool
Credit a sale to channels
Ad clicks, pixel, orders
Blended ROAS
Marketing leads
BI dashboard
Visualize what happened
Warehouse tables
Charts, reports
Analysts, ops
Data warehouse
Store and join raw data
All source APIs
Clean tables
Data engineers
AI layer
Reason and recommend
Everything above
Decisions, alerts
Founders, CFOs
🛒 Shopify-only versus true multi-channel
If almost all your revenue runs through Shopify, start light. Native Shopify Analytics plus one reasoning layer often covers you, and it respects the cash sitting in your inventory right now. Our Shopify analytics guide walks through that baseline.
The moment you add Amazon, Etsy, or wholesale, that breaks. Those channels do not report the same way, so you need a warehouse to hold them and a layer to unify them through proper ecommerce platform integration. Buying a fifth dashboard here just adds another silo.
🚂 The build-a-stack sequence
Think of it as two train tracks running parallel: inventory on one rail, cash on the other. Lose sight of either, and you derail, no matter how good your attribution looks.
That is why I would buy the reasoning layer early, not last. Luca is that AI layer. It sits on top of your data warehouse, extracts the relevant data for a given situation, predicts from history, and finds root causes across every channel with true predictive analytics for ecommerce. It is explicitly not an attribution pixel and does not replace one. It reads the pixel's output alongside your cash and inventory so both tracks stay in view.
Q4. Is Triple Whale or Northbeam still worth it, and how should you read attribution numbers in 2026? [toc=4. Attribution Reality Check]
Triple Whale and Northbeam are still worth it for omnichannel attribution if you treat their numbers as directional, not gospel. Since iOS 14 broke deterministic tracking, both stitch a cleaner blended picture than platform metrics, but neither filters bot or invalid traffic first, and attribution stays subjective. Use multi-touch for direction, media mix modeling for hypotheses, and incrementality tests for proof. Watch GMV-based pricing and reported platform turbulence before signing multi-year.
📉 Why this category exploded
The situation is simple. When Apple's iOS 14 update let users block tracking, deterministic attribution (knowing exactly which ad drove which sale) fell apart. Tools like Triple Whale filled the gap with a first-party pixel that stitches a blended view.
That blended view is genuinely better than trusting Meta's self-reported numbers alone. Operators on Reddit back this up, with several noting Northbeam feels more accurate for some accounts. I would not bet the quarter on either being exact, though, which is why we compare Triple Whale alternatives honestly.
"Have used TripleWhale. It's solid. Some people feel Northbeam is more accurate. You never use their recommended Triple Attribution lol." u/anonymous, r/PPC Reddit Thread
⚠️ The honest complications
Two things temper the pitch. First, these tools often drink the same contaminated water, meaning they rarely filter bot or invalid traffic before attributing it. Garbage in, confident garbage out.
Second, pricing scales with your Gross Merchandise Value (total sales volume). Triple Whale runs roughly $179/month at the low end but climbs to about $1,129/month at $5M to $7M GMV and higher from there. The category has also seen platform turbulence heading into 2026, so read the multi-year commitment carefully, and weigh it against declining platform ROAS versus true profitability.
🔬 MTA vs MMM vs incrementality, plainly
Three methods, three jobs.
Multi-touch attribution (MTA): credits each touchpoint a customer saw. Fast, but subjective and privacy-limited.
Media mix modeling (MMM): uses historical spend to estimate channel impact. Good for hypotheses, slow to react.
Incrementality testing: turns spend off in a holdout group to prove causation. Slowest, but the only real proof.
✅ The workflow I actually recommend
Read platform numbers as directional. Use MMM to form a hypothesis. Then run an incrementality test to confirm it before reallocating budget. Skipping that last step is how brands waste real money on channels that only looked good, a trap sharper AI marketing analytics for ecommerce helps you avoid.
One example single dashboards miss: Meta spend often lifts Amazon sales, even with no Meta-attributed Amazon listing. That halo never shows in one pixel's view, which is where Amazon brand analytics and cross-channel context earn their keep.
"I love how seamlessly it connects our ad platforms and CRM data, showing exactly where our conversions come from. Its made attribution so much clearer." Verified User Triple Whale G2 Verified Review
"Its very easy to use and works good for a multichannel solution. Sometimes it does not update the numbers correctly and has errors with synchronisation." Verified User Triple Whale G2 Verified Review
To be clear about fit: Luca is not an attribution tool and does not replace your pixel. It is the layer that consumes Triple Whale or Northbeam output alongside cash and inventory, so you never decide off one contaminated dashboard, the way our broader ecommerce omnichannel analytics approach intends.
Q5. Can AI build your cross-channel reporting and alerts, and where does it still hallucinate? [toc=5. AI-Built Reporting & Alerts]
Yes, AI can now run cohort analyses, slot SKUs, generate dashboards on the fly, and push scheduled reports, replacing the Monday Excel-export ritual. Claude Code ran five cohort analyses to find that product-category diversity, not frequency or average order value, was the top driver of lifetime value. But AI hallucinates on dirty data. One native forecaster was flatly telling fibs and got shut down. Standardize and clean your data first, then set threshold alerts so you get pinged when ROAS dips.
⏰ The Monday Excel ritual has to go
I will admit something. Looking back at how I used to run reporting off Excel exports makes me shudder now. "Mondays are for Excel exports" is a sentence I have heard from too many founders.
That ritual eats your best strategic hours on data assembly, not decisions. The whole promise of AI here is simple: reallocate that time from assembling data to actually reading it, which is the core of how AI can actually help you run your store.
🤖 What actually works right now
Three real moves stand out from operators I have watched. One founder shut off his inventory tool's native AI because it kept hallucinating, then piped clean data into Microsoft Copilot instead. Another ran five cohort analyses through Claude Code and found body-care buyers lifted customer lifetime value by 50% to 100%.
A third assigned every SKU to a shelf position using AI in minutes, work that used to take a month. The pattern is clear. AI is fast and genuinely useful once the data feeding it is trustworthy, which is why strong ecommerce data analytics starts with clean inputs.
⚠️ Where it still lies
Here is the hard boundary. Prompt AI on a horrendous, uncleaned dataset, and it hands back confident nonsense. That is not the model's fault, it is pure laziness on the input side, and it is where solid ecommerce data integration earns its keep.
So the rule is standardize first, then automate. Clean and normalize your data on the way in, then set threshold alerts that ping you when ROAS dips or inventory falls below a set floor.
✅ Your alert architecture
Think of alerts as a floor and a ceiling on every metric that moves money.
ROAS: ping me if it drops below your break-even multiple.
CAC: ping me if customer acquisition cost spikes week over week.
This is where general AI and a purpose-built layer split. Copilot and Claude need you to extract and clean data first. Luca sits over your data warehouse, standardizes on ingestion, and pushes customized reports to Slack, email, and app on a schedule, then pings you the moment a threshold breaks, the way purpose-built agents for ecommerce should. My open question for 2026: how much of the "clean it first" step disappears once ingestion-layer standardization becomes standard? What would you automate first if it did?
Q6. Why is gross margin lying to you, and can analytics show real per-SKU profit? [toc=6. Real Per-SKU Profit]
Gross margin is a lie because it only tells you what it costs to make a product, not to sell it. The eight costs between the supplier invoice and real profit, freight at $2.40 per unit, 7.5% duties, a 30-cent brokerage fee, shipping, and returns, are where brands quietly bleed. Blended averages hide which SKU is losing money. Cross-channel analytics only earns its keep when it computes true per-SKU contribution margin, and AI can now do it in five minutes.
💸 The number founders trust that betrays them
Most founders make decisions on gross margin, which is the price minus the cost to make the product. That number feels safe. It is not.
Between the supplier invoice and your actual profit sit eight costs most P&Ls smear into a blended average. Freight, duties, brokerage, warehousing, pick-and-pack, shipping, payment fees, and returns each take a bite. Contribution margin (revenue minus all variable costs to make and sell one unit) is the number that tells the truth, as we explain in contribution margin versus gross margin.
📊 The SKU that hides in the average
Here is the moment that should scare you. I saw a brand where one product category quietly collapsed from 20,000 units a year to almost nothing, fully masked because a neighboring category was rising.
The blended average looked fine. One founder had no idea her shipping cost was that high, because she only ever looked at costs blended across all products. The loss-maker was invisible until someone computed profit per SKU, the kind of view healthy ecommerce profit margins depend on.
💰 What to compute this Monday
The math is not hard, it is just tedious by hand. Landed cost on one unit might run $2.40 freight, 7.5% in duties, and 30 cents in brokerage, before shipping and returns even enter.
Doing that per SKU, per destination, used to mean waiting two days on an analyst while the customer lost interest. Now the calculation for something like net profit on a South Africa delivery takes five minutes. This is the one job I would hand analytics first. Luca reasons over your warehouse to compute real per-SKU contribution margin across every cost source, then surfaces the loss-making SKU the average hides, answered in plain English through proper ecommerce business intelligence. My question for you: if you ran this today, which SKU do you suspect is secretly losing money?
Q7. What separates an AI Co-Founder from an analytics dashboard, and when does founder capital fit? [toc=7. AI Co-Founder & Capital]
A dashboard shows you a number. An AI layer over your data warehouse reasons across inventory, cash, ads, and customers, then tells you what to do and pushes it to you proactively. That is the analytics edge. Separately, if you need capital to act on what the data proves, judge any funding option on capital metrics, rate of interest, disbursal time, and terms, not on whatever software it comes bundled with.
📉 Before: dashboards built to impress, not to decide
Most analytics tools got built to show off technical range. Pretty charts, deep drilldowns, and a hundred filters nobody opens twice.
That misses the point. These tools were supposed to make the decisions normal, busy operators cannot get to, and instead they hand you more homework. A dashboard that shows what happened is a rear-view mirror, unlike a true ecommerce analytics dashboard that drives action.
✅ After: a reasoning layer that acts
The shift is from a passive display to an active brain. An AI layer extracts the relevant data, predicts from history, simulates scenarios, and finds root causes across every channel, the promise of agentic AI for ecommerce founders.
It also watches while you sleep. Relying on a single ad channel is a single point of failure, closer to gambling than strategy. Luca is that AI layer over your data warehouse, reasoning cross-functionally and pushing customized reports and alerts before a problem shows up in next week's export, backed by predictive analytics for ecommerce.
💰 When capital fits, judged on its own terms
Now the separate question. Once your data proves a move is worth making, say, more inventory ahead of a proven demand spike, you may need funding to act fast.
Judge that funding like a CFO, on the numbers alone.
Rate of interest: what does the capital actually cost you?
Disbursal time: how fast can you deploy it?
Terms: how flexible is repayment against your cash cycle, compared with revenue-based financing?
Luca offers capital inside the same chat, but you should still evaluate it purely on rate, speed, and terms, exactly as you would any lender. Do not let good software excuse expensive money, and do not let cheap money excuse bad software. My read heading into 2027: the winning tools will be the ones that earn trust on analytics first, then let capital ride alongside as a clean, separate decision. Where do you land on keeping those two separate?
FAQ's
What are the best cross channel analytics tools for ecommerce in 2026?
We rate nine tools, each owning a different layer of your data stack. There is no single winner, so you assemble the layers you need.
Luca: the AI reasoning layer over your whole data warehouse.
Looker: flexible, governed BI dashboards.
Bloomreach: a single source of truth on the customer.
BigQuery plus Fivetran: the warehouse and pipeline underneath everything.
Triple Whale or Northbeam: omnichannel marketing attribution.
Microsoft Copilot: AI analysis inside Excel.
Claude or Claude Code: agentic, on-demand cohort analysis.
Grafana: real-time observability and monitoring.
Shopify Analytics: native, customizable store reporting.
Most operators need the reasoning layer first, because attribution pixels and dashboards still leave you triangulating numbers by hand. We built our ecommerce analytics platform to sit on top of your warehouse and answer questions in plain English. The right pick depends on your channel mix and stage, not on which tool draws the prettiest chart.
Do I need an attribution tool, a BI dashboard, a data warehouse, or an AI layer?
Each answers a different question, so match the tool to the job.
Attribution tool: tells you which channel drove a sale.
BI dashboard: visualizes what already happened.
Data warehouse: stores and joins your raw data.
AI layer: reasons across all of it and tells you what to do next.
If you sell only on Shopify, native analytics plus one reasoning layer often covers you. Once you add Amazon, Etsy, or wholesale, those channels report differently, so you need a warehouse to hold them and a layer to unify them.
We think most founders should buy the reasoning layer early, not last. Picture two train tracks, inventory on one and cash on the other; lose sight of either and you derail. That is why true omnichannel analytics matters more than another siloed pixel. The AI layer reads attribution output alongside cash and inventory, so no single dashboard gets read in isolation.
Are Triple Whale and Northbeam still worth it, and how should I read attribution in 2026?
Yes, both remain worth it for omnichannel attribution, as long as you treat the numbers as directional, not gospel. Since iOS 14 broke deterministic tracking, they stitch a cleaner blended picture than platform-reported metrics.
Two cautions matter. Neither reliably filters bot or invalid traffic first, so garbage in means confident garbage out. Pricing also scales with your gross merchandise value, climbing from roughly $179 per month into four figures as you grow.
We recommend a three-step workflow:
Multi-touch attribution: use for direction.
Media mix modeling: use to form a hypothesis.
Incrementality testing: use to prove causation before reallocating budget.
One thing single dashboards miss is the halo effect, where Meta spend lifts Amazon sales with no Meta-attributed listing. If you are weighing options, see our take on Triple Whale alternatives. We are not an attribution tool and do not replace your pixel; we consume its output alongside the rest of your data.
Why is gross margin misleading, and can analytics show real per-SKU profit?
Gross margin only tells you what it costs to make a product, not to sell it. Between the supplier invoice and real profit sit about eight costs that most profit-and-loss statements smear into a blended average.
Freight, often around $2.40 per unit.
Duties, roughly 7.5%.
Brokerage, near 30 cents per unit.
Warehousing, pick-and-pack, shipping, payment fees, and returns.
Blended averages hide which SKU is quietly losing money. We have seen a category collapse from 20,000 units to almost nothing, fully masked because a neighboring category was rising.
Cross-channel analytics only earns its keep when it computes true per-SKU contribution margin across every cost source. AI can now do in five minutes what used to mean a two-day wait on an analyst. Our guide on contribution margin versus gross margin breaks it down, and we surface the loss-making SKU your average hides, answered in plain English.
What separates an AI Co-Founder from an analytics dashboard, and when does capital fit?
A dashboard shows you a number and waits. An AI Co-Founder reasons across inventory, cash, ads, and customers, then tells you what to do and pushes it to you proactively.
Most dashboards were built to show off technical range, so they hand you homework instead of decisions. A rear-view report is not the same as a layer that pings you before a problem hits next week's export.
Extracts the relevant data for a given situation.
Predicts from your history and simulates scenarios.
Alerts you when ROAS dips, CAC spikes, or inventory falls low.
On capital, keep it separate. When your data proves a move, judge any funding option on rate of interest, disbursal time, and terms, exactly as you would any lender. We explain our reasoning approach in agentic AI for ecommerce founders. Do not let good software excuse expensive money, or cheap money excuse weak software.
Enjoyed the read? Join our team for a quick 15-minute chat — no pitch, just a real conversation on how we’re rethinking Ecommerce with AI - Luca
Loading Schedule...
Your AI Co-Founder is here.
Here’s why:
Shopify, Meta, Xero - one brain.
"Should I scale?" Answered with real data.
Growth capital. No applications. One click.
Thank you! Your submission has been received! Please book a time slot for the Meeting
Oops! Something went wrong while submitting the form.

.svg)
.svg)




.svg)
.webp)

.avif)