Inventory Forecasting for E-commerce: Formulas, Methods and Template
13
mins read
TL;DR
Inventory forecasting decides when to reorder each SKU and how much, which makes it a cash decision as much as a data task.
Remove stockout days before averaging sales; in our example, 18 stockout days hid 25% of one SKU's real demand.
Reorder point equals daily sales times lead time plus safety stock: 6 units x 30 days + 60 = 240 for the hoodie example.
The popular max-minus-average safety stock shortcut gave 220 units versus 53 from the statistical formula, about $3,000 of extra cash.
Plan on the median supplier lead time, cover delays in safety stock, and check forecast methods monthly with MAPE.
Track days of cover against lead time for stockouts, and inventory older than 90 days as an early dead stock signal.
It is Monday, 8:40 a.m. An operations lead at a Shopify apparel brand opens last week's sales export. The best-selling hoodie is down to 260 units. Meta is spending on it every day. The supplier needs 30 days. Is 260 enough, or is the reorder already late?
Inventory forecasting answers that question with arithmetic instead of a gut call. You estimate each SKU's daily sales, multiply by your supplier's lead time, add a safety buffer, and reorder when stock hits that number. This guide gives you the formulas, the methods, a template layout, and one worked example that runs through every section. It is the hands-on side of predictive analytics for e-commerce, applied to the boxes on your shelves.
What is inventory forecasting, and what does it actually decide for an e-commerce store?
Inventory forecasting is estimating how many units of each SKU you will sell over the next lead time plus a buffer, so you know when to place a purchase order and how much to order. For an online store it decides two things. It decides whether best sellers stay in stock while ads run, and how much cash sits in boxes instead of the bank.
💰 Two tracks, one decision
Every reorder is a cash decision first. One operator on the TaxCloud and Settle ops panel put it as two train tracks: inventory on one side, cash on the other, running in parallel or going off the rails. I see this pattern constantly in stores between $1M and $5M. The forecast and the bank balance live in different tools, so nobody checks one against the other.
Shopify defines inventory forecasting as predicting future stock needs from historical sales and seasonal trends. That definition is correct. It just leaves out the part that keeps founders awake, which is the money tied up while stock sits "on the water" for weeks.
⚠️ Both ways to get it wrong cost money
❌ Stock out: Ryan Daniel Moran calls running out the worst thing for a young brand, because you cannot take orders. His brand waited four weeks for a shipment and lost its momentum.
❌ Overstock: cash sits in a warehouse instead of funding ads or the next best seller.
One Shopify merchant described the second failure plainly:
"I overstocked 500 pairs of footwear products, which sat in the warehouse for two months." KimSeoHo, Shopify merchant, Shopify Community Thread
A reply in the same thread named the root cause:
"ordering 500 units of something that only moves 10 a month." Andrew_185, Shopify Community member, Shopify Community Thread
✅ Where Luca AI fits
Luca AIconnects Shopify, your 3PL, and your accounting tool in one place. That means the reorder question and the cash question are answered from the same numbers. You ask in plain English, "Which SKUs will run out before their next shipment lands?" and get the list with the reasoning. Luca AI does the analysis. You still decide what to buy.
How do you forecast inventory, step by step?
Stockout days are no supply, not low demand. Divide sales by in-stock days only.
Forecast inventory in five steps. First, clean sales history of stockout days and one-off spikes. Second, calculate average daily sales per SKU from in-stock days only. Third, measure real supplier lead time. Fourth, set safety stock for the variation you cannot predict. Fifth, set a reorder point and review it weekly. Skipping the first step is why most store forecasts run low.
📉 Step 1: Remove the days you had nothing to sell
Here is the mistake I see most often. A Shopify sales report counts every day, including days a SKU sat at zero. Those zero days were not low demand. They were no supply.
Take one SKU over 90 days. It sold 540 units, which looks like 6.0 units a day. But it was out of stock for 18 of those days. Divide 540 by the 72 in-stock days and the real rate is 7.5 units a day.
One SKU, 90 days: raw average vs in-stock-only average
Measure
Raw average
In-stock only
Days counted
90
72
Units sold
540
540
Daily sales rate
6.0
7.5
Demand over a 30-day lead time
180
225
True demand is 25% higher than the raw average shows. Over a 30-day lead time, that is 45 units you never ordered. Next month you stock out again, the average drops again, and the error feeds itself.
🧹 Step 2: Strip the one-off spikes
Spikes distort the other direction. The Hammersley Brothers describe the "Netflix effect": a documentary features a product, sales jump, then fall back. Their advice is to rebuild last year's figures without the boost before you forecast from them. I agree. A spike you cannot repeat should not set next quarter's order.
Luca AI handles this cleanup on request. Ask it to "recalculate the daily sales rate for my top 20 SKUs using in-stock days only," and it reads stock levels next to sales instead of sales alone.
⏰ Steps 3 and 4: Lead time and safety stock
Lead time is the days from purchase order to stock you can sell. Safety stock is the extra units that cover demand or delays you cannot predict. Both get their own sections below, because each has a trap that costs real cash.
🔁 Step 5: Set the reorder point and keep a cadence
The reorder point is the stock level that triggers a new purchase order. Recalculate it on a fixed rhythm:
Weekly for your top sellers, the 20% of SKUs that drive most revenue.
Monthly for the full catalog.
Before every promotion and after any supplier changes terms.
Even with tools, stockouts still surprise people. One forecasting builder wrote:
"I've seen situations where stockouts still catch people off guard even with the tools in place." DemandMind, forecasting tool builder, December 2025, Shopify Community Thread
A fashion founder on Reddit described the same blind spot from the analytics side:
"I run a fashion brand on Shopify and built an analytics app after getting frustrated with how hard it is to understand product-level performance, especially once returns and stock risk come into play." Fashion brand founder, r/ShopifyAppDev Reddit Thread
Luca AI turns this cadence into a weekly report. It lists each SKU whose reorder point moved, and why, so the Monday check takes minutes instead of a morning of exports.
What is the reorder point formula, and how much should you order?
Reorder point = (average daily sales x lead time in days) + safety stock. A hoodie selling 6 units a day with a 30-day lead time needs 180 units to cover the wait. Add 60 units of safety stock and the reorder point is 240. When stock on hand plus stock on order falls to 240, place the purchase order.
🧮 The worked example, line by line
Back to the hoodie from the opening. It sells 6 units a day, already cleaned of stockout days.
Reorder point worked example for one hoodie
Input
Value
Where it comes from
Average daily sales
6 units
In-stock days only (Q2)
Lead time
30 days
Median of past purchase orders (Q5)
Lead time demand
180 units
6 x 30
Safety stock
60 units
Statistical formula, rounded up (Q4)
Reorder point
240 units
180 + 60
Lead time demand is the units you expect to sell while you wait for the shipment. The safety stock is your cushion if sales run hot or the boat runs late. This is the same structure Shopify and Netstock teach. The formula is not where stores go wrong. The inputs are.
❌ Three input mistakes I see every month
Ignoring stock on order. Compare the reorder point to on hand plus on order. Otherwise you place a second PO for stock already on its way.
Using an annual average. Annual sales divided by 365 mixes peak and slow months. Use the last 60 to 90 in-stock days for steady SKUs.
Forgetting the minimum order quantity (MOQ). The MOQ is the smallest order a supplier accepts. If it is 500, your order is at least 500, whatever the formula says.
📦 How much to order once you hit 240
The reorder point tells you when. Order quantity tells you how much. My default for a small brand is to cover the next order cycle, not the season. If you reorder this hoodie monthly, order about 30 days of sales, or 180 units, then round up to the MOQ.
Economic order quantity (EOQ) is a textbook check on that number. It balances the cost of placing an order against the cost of holding stock. It works for stable SKUs. It ignores cash limits and promotions, so treat it as a sanity check.
Smaller, more frequent orders tie up less cash, and they let you correct a bad forecast faster. That is the asymmetric bet: if you win, you reorder; if you lose, you lose little.
✅ Where Luca AI fits
Luca AI lets you set a stock threshold for each SKU, such as 240 units for this hoodie. When stock crosses it, Luca AI sends an alert on Slack, email, or the mobile app. The alert includes the current daily rate, so you see whether 240 still holds before you sign the PO.
How much safety stock do you need?
The shortcut buffer ties up about $3,000 more cash than the full formula on one hoodie.
Use the statistical formula once you have a few months of daily sales and several purchase orders. Safety stock = z x square root of (lead time x demand variance + daily sales squared x lead time variance). For the hoodie at a 95% service level, that is 53 units. The popular max-minus-average shortcut gives 220, about four times the buffer and roughly $3,000 of extra cash on shelves.
⚖️ Three formulas, one hoodie
Same SKU, same history, three very different answers. The hoodie sells 6 units a day on average, with a 30-day average lead time. Its best day was 10 units. Its slowest PO took 40 days. Daily sales vary by a standard deviation of 2.2 units. Lead time varies by about 5 days.
Safety stock three ways for the same hoodie
Formula
Calculation
Safety stock
Max minus average (shortcut)
(10 x 40) minus (6 x 30)
220 units
Demand only
1.65 x 2.2 x square root of 30
20 units
Demand plus lead time
1.65 x square root of (30 x 2.2² + 6² x 5²)
53 units
A standard deviation measures how far daily numbers usually stray from the average. The z value sets the service level, the share of order cycles you expect to finish without a stockout. A z of 1.65 means about 95%.
💸 Why the shortcut quietly drains cash
The shortcut assumes your best sales day and your worst shipment happen together, every cycle. They rarely do. Shopify's own guide teaches this version. The result here is 167 more units than the full formula, which at an $18 unit cost is about $3,000 sitting on a shelf.
Multiply that across 50 SKUs and the shortcut can lock up six figures. Cyndi Thomason's test in Profit First for Ecommerce Sellers helps here: track the share of inventory value older than 90 days. If that share grows as you scale, your buffers are too fat.
🎯 Why demand-only is too thin
The demand-only formula, cited by SOS Inventory, gives just 20 units. It assumes the supplier always delivers on day 30. Anyone who has waited on a delayed container knows that is not true. Lead time swings add most of the risk here: 900 of the 1,045 inside the square root come from delivery delays.
So the full formula's 53 units is the honest number. For the hoodie I round it to 60, five cartons of 12. That is the 60 in the reorder point above.
✅ Pick a service level per SKU class
Top sellers: 95% (z = 1.65). A stockout here also wastes ad spend.
Steady mid-tier SKUs: 90% (z = 1.28).
Long tail: 80 to 85% (z = 0.84 to 1.04). A short stockout costs little.
Luca AI calculates each SKU's demand variability straight from your Shopify history. Ask, "What is the standard deviation of daily sales for my top 30 SKUs over 90 in-stock days?" and you get the table. The statistical formula stops being a weekend spreadsheet project.
How do you forecast supplier lead times?
Measure lead time as the days from purchase order to stock available to sell, across at least your last eight orders per supplier. Plan on the median, not the mean. One port delay can pull the mean up by days and inflate every reorder point. Cover delay risk with the lead time variation term in safety stock instead.
📅 What counts as lead time
Most stores measure lead time from PO to "shipped." That undercounts. The clock should stop when units are sellable on your Shopify store. That includes freight, customs, the 3PL's receiving queue, and putaway.
A 3PL (third-party logistics warehouse) can take several days to receive a container in peak season. Those days are part of your lead time. If you skip them, every reorder point you set is short by that many days of sales.
📊 Why the median beats the mean
Kunle Campbell makes this point in E-commerce Growth Strategy. He advises basing lead time averages on the median, not the mean, to remove large outliers. I agree, with one condition: the outlier still belongs in your safety stock math.
Here are one supplier's last eight purchase orders, in days: 29, 30, 31, 32, 33, 34, 37, and 58.
One supplier's last eight purchase orders: mean vs median lead time
Measure
Result
What it does to the reorder point
Mean (simple average)
35.5 days
Pulled up by the single 58-day delay
Median (middle value)
32.5 days
Reflects a normal order
Gap
3 days
3 x 6 units a day = 18 extra units per SKU
Eighteen units on one SKU looks small. Across 80 SKUs from that supplier, it is 1,440 extra units ordered every cycle because of one late boat. The median plans for the normal order. The lead time variation in the Q4 formula covers the bad one.
⚠️ The delays you cannot average away
Ryan Daniel Moran tells the story of a founder whose Christmas order sat in customs for two weeks, even after paying for air freight. No average predicts that. A median lead time plus a statistical buffer is still your best defense, and an earlier order before peak season is cheaper than any expedite fee.
🌍 Short lead time vs low unit cost
Lead time is also a sourcing choice. The Hammersley Brothers compare a local supplier with about a 7-day lead time to a Chinese supplier at around 3 months. The overseas unit cost is lower. But you need a bigger warehouse and much more cash sitting on the sea.
✅ Short lead, higher unit cost: smaller orders, smaller buffers, faster correction.
❌ Long lead, lower unit cost: bigger orders, bigger buffers, more cash at risk if the forecast misses.
For a brand under $5M in revenue, I lean toward shorter lead times on best sellers. The margin gain overseas often disappears into extra safety stock.
✅ Where Luca AI fits
Luca AI runs vendor performance analysis across your purchase order history. Jen Van Wart, CEO of Twigs, described spending three weeks before each buying market pulling these reports by hand. Ask Luca AI, "Which suppliers delivered later than their median in the last six months?" and the answer arrives with each supplier's spread.
Which inventory forecasting method should you use for each SKU?
On a climbing SKU, the method that weights recent weeks misses by less.
Match the method to the SKU. Use a moving average for steady sellers and exponential smoothing for SKUs whose demand drifts. Add a seasonal index for anything with a peak, and use judgment plus an analog SKU for launches with no history. Then check each method monthly with MAPE, the average percentage gap between forecast and actual sales, and keep the closest.
🧭 The method table
Which forecasting method fits which SKU
SKU type
Method
What it does
Steady seller
Moving average
Averages the last few weeks equally
Trending up or down
Exponential smoothing
Weights recent weeks more heavily
Seasonal peak
Seasonal index on a baseline
Scales the baseline by month
New launch
Analog SKU plus judgment
Borrows a similar SKU's curve
Large catalog, long history
ARIMA or machine learning
Statistical models on many patterns
Red Stag Fulfillment's guide covers the same families. The difference that matters for a small brand is not which method is smartest. It is which one you can check every month.
🔢 One SKU, two methods
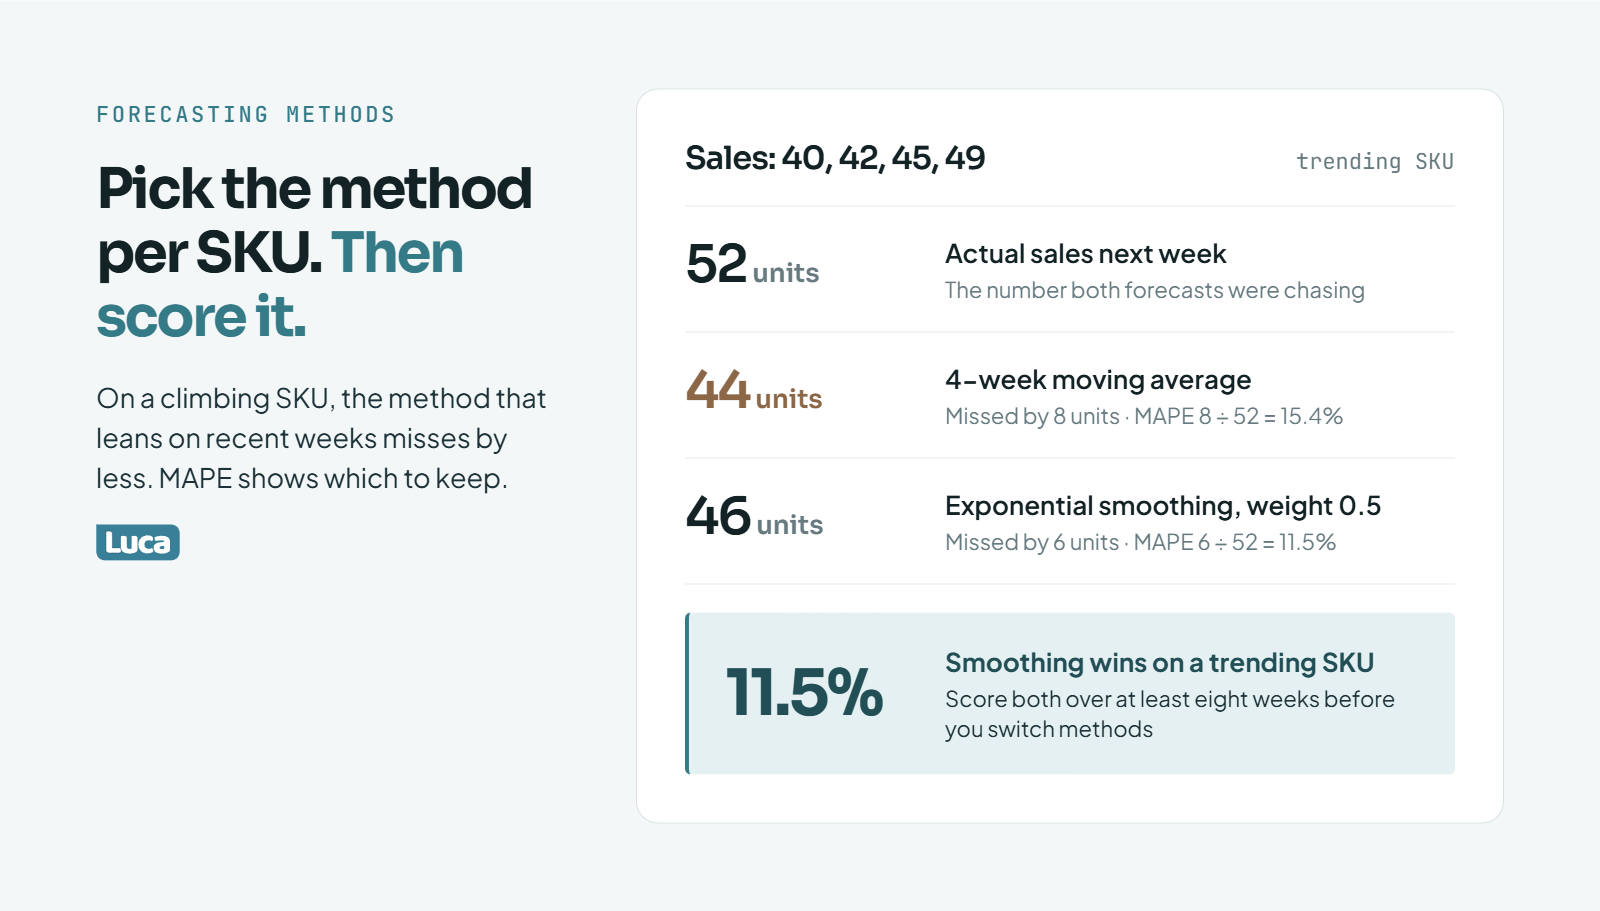
A SKU sold 40, 42, 45, and 49 units over the last four weeks. Demand is climbing.
4-week moving average: (40 + 42 + 45 + 49) / 4 = 44 units next week.
Exponential smoothing with a weight of 0.5 on the newest week: the forecast steps 40, 41, 43, then 46 units.
The next week sells 52. The moving average missed by 8 units. Exponential smoothing missed by 6. On a trending SKU, the method that leans on recent weeks wins.
🎯 Score the methods with MAPE
MAPE stands for mean absolute percentage error. For each period, take the gap between forecast and actual, divide by actual, then average those percentages. Here, the moving average scored 8 / 52 = 15.4% and smoothing scored 6 / 52 = 11.5%.
Do this over at least eight weeks before switching methods. One week can flatter either one.
⚠️ When ARIMA is overkill
ARIMA (AutoRegressive Integrated Moving Average) is a statistical model that learns patterns from long histories. For a store with a few hundred SKUs and two years of data, it rarely beats a clean moving average by enough to matter. Common Thread Collective's point holds: forecasting is an exercise in execution as much as modeling. A simple method on clean data beats a clever model on dirty data.
✅ Where Luca AI fits
Luca AI predicts sales from your historical Shopify data and compares forecast to actual per SKU when asked. Ask, "Which SKUs missed their forecast by more than 20% last month?" and you get the list with likely causes, such as a stockout, a promotion, or a traffic drop.
How do you plan inventory demand for seasonality, promotions and new products?
Inventory demand planning starts from the clean baseline and adds what you already know is coming. Apply a seasonal index for the month, a lift factor for each planned promotion, and repeat demand from past customers. For new products, borrow the curve of a similar SKU, order small, and keep the reorder fast.
🍂 Seasonal index, calculated correctly
A seasonal index is how much a month sells compared with an average month. Divide the month's sales by the average monthly sales for the year.
Here is an illustrative example. A store sold 12,000 units last year, so an average month is 1,000 units. November sold 1,800. November's index is 1,800 / 1,000 = 1.8.
Apply it to the hoodie. Its clean baseline is 6 units a day, or 180 a month. November demand is 180 x 1.8 = 324 units. Your November reorder point must use that rate, not the yearly one.
📣 Promotions and the golden goose
A lift factor is how much a promotion multiplies normal sales. Measure it from your own past campaigns, not a vendor benchmark. If last Black Friday's week sold 2.5 times a normal week, plan with 2.5 on the same offer.
The bigger risk is running out mid-campaign. The Hammersley Brothers describe it well: when a best seller stocks out, the ad team shifts spend to other products. Those products cannot replace the "golden goose," so revenue starts to yo-yo. A stockout during a promotion wastes the ad budget twice.
One forecasting builder noticed the quiet version of this pattern:
"When a SKU shows steady week-over-week growth (even small), it often runs out of stock earlier than expected." DemandMind, forecasting tool builder, December 2025, Shopify Community Thread
🔁 Repeat demand is your tailwind
The Hammersley Brothers also forecast a "tailwind" from past customers. In their example, about 30% of last year's buyers buy again, 10% from two years ago, and 5% from three years ago. Apply your own rates to your own customer cohorts.
If you had 2,000 buyers last year, 3,000 two years ago, and 2,000 three years ago, that is 600 + 300 + 100 = 1,000 repeat customers. Those orders come before you spend a dollar on ads.
🚀 New products with no history
Pick an analog, a past SKU with a similar price, audience, and channel. Use its first 60 days as the launch curve. Order a small first batch, then reorder fast once real sales arrive. Being slightly short for a week costs less than a warehouse of a product nobody wanted.
✅ Where Luca AI fits
Luca AI connects Meta, Klaviyo, and Shopify, so promo lift comes from your own past campaigns. Ask Luca AI, "What was the sales lift on the hoodie during last year's Black Friday email and Meta push?" and plan from your number.
How should you split stock across warehouses and channels?
Forecast each warehouse or channel separately and set reorder points per location. A SKU can stock out in one place while another holds plenty. Keep fast movers near most customers, keep the long tail in one central location, and pool safety stock where you can. One shared buffer needs fewer units than two separate ones.
🏬 Splitting stock multiplies the buffer
Split the hoodie's 6 units a day evenly across two warehouses. Each now sells 3 a day, and each sees more relative noise. The demand-driven part of safety stock grows by roughly the square root of the number of locations.
Safety stock when one warehouse becomes two
Setup
Demand-driven safety stock
One warehouse, 6 a day
20 units
Two warehouses, 3 a day each
About 14 + 14 = 28 units
That is 40% more buffer for the same total demand, assuming the two regions' sales move independently. So split only the SKUs that earn faster delivery.
🚚 Express stock vs long-lead stock
One operator, Nicolo Grange, described a hybrid in a recorded interview. His team stocks about 3,000 of 10,000 labels locally for express shipping. The other 7,000 ship from a Hong Kong warehouse with a 15 to 20 day lead time. Best sellers stay close. The long tail stays central.
Small details matter here too. Carole, a seller featured in Profit First for Ecommerce Sellers, ships single-SKU cartons so the warehouse cannot misfile stock under the wrong SKU.
⚠️ Channel and store data must not double count
Multi-store setups break many tools. One Polar Analytics customer reported this:
"I've also reported an issue with inventory levels, as our inventory is multiplied with 6, since we have 6 different shopify stores connected to the same warehouse." Maja, Polar Analytics customer, November 2025, Polar Analytics - Trustpilot Verified Review
A Triple Whale reviewer flagged the channel version, listing among their dislikes:
Luca AI reads stock by location from your 3PL feed alongside Shopify sales. It alerts you when one location crosses its threshold while another sits overstocked. That way a transfer can happen before a reorder.
How do you predict stockouts and dead stock before they cost you?
Compare days of cover with lead time plus safety days every week, and sort by days left.
Predict stockouts by comparing days of cover with lead time. Days of cover is stock on hand plus on order, divided by daily sales. When cover falls below lead time plus safety days, you are already late. Predict dead stock by tracking the share of inventory value older than 90 days. If it holds or grows while revenue grows, buying is getting worse.
⏰ Days of cover: the stockout early warning
Days of cover tells you how long current stock lasts at today's sales rate. Compare it with what you need to survive the wait.
Take the hoodie. It has 260 units on hand and nothing on order. At 6 units a day, that is about 43 days of cover. The supplier needs 30 days, and 60 units of safety stock equals 10 more days. So the hoodie needs 40 days of cover. It has 43. The reorder window closes in about three days.
Days of cover check for the hoodie
Check
Hoodie
Days of cover
260 / 6 = about 43 days
Lead time plus safety days
30 + 10 = 40 days
Days left to place the PO
About 3
Run this for every SKU weekly. Sort by days left. The top of that list is your purchasing agenda.
🪦 The 90-day test for dead stock
Dead stock is inventory that has stopped selling at a useful pace. It rarely announces itself. Cyndi Thomason, in Profit First for Ecommerce Sellers, cites Robyn Johnson's test: watch inventory older than 90 days as a percentage of total inventory value. If that share is flat or rising while you scale, your buying is not improving.
Here is an illustrative example. You hold $200,000 of inventory, and $50,000 of it is older than 90 days. That is 25%. If it was 20% last quarter while revenue grew, slow stock is piling up faster than sales.
💸 Why dead stock hurts more than it looks
Thomason describes the trap in her book. A founder feels rich in January after Q4 sales, then finds no cash for the slow summer months. Aged stock is part of that gap. The money exists on the balance sheet but not in the bank.
Margin math makes it worse. Supply Chain Lara puts it bluntly: "Gross margin is a lie." Gross margin covers what a product costs to make, not what it costs to sell. Storage, pick and pack, shipping, returns, and ad spend all come after. Slow stock keeps adding storage fees every month it sits.
✅ What to do with each signal
✅ Cover below lead time plus safety days: place the PO this week, or expedite part of it.
⚠️ Aged share rising: stop reordering the slowest SKUs and plan a markdown before the next peak.
❌ Both at once: you are buying the wrong things. Shift budget from slow SKUs to the ones running short.
Luca AI scans your Shopify and 3PL data around the clock. It pings you when a SKU's days of cover drops below its lead time, or when the aged stock share rises, without anyone opening a dashboard.
How does inventory forecasting work on Shopify?
Shopify gives you the inputs for inventory forecasting: sales by product and variant, and inventory by location. It does not calculate reorder points, safety stock, or supplier lead times for you. Stores either export to a spreadsheet, install a forecasting app, or connect Shopify to an analytics layer that reasons across sales, ads, and supplier data.
🛒 What Shopify gives you natively
Shopify's analytics include sales reports by product and variant. Depending on your plan, inventory reports such as sell-through rate and days of inventory remaining are also available. Sell-through rate is the share of received units you have sold. Shopify also tracks stock by location when you use more than one warehouse.
What is missing is the forecasting layer. Shopify does not know your supplier's lead time, your MOQ, or what is on order. Without those, no reorder point can be calculated inside Shopify alone.
📄 The spreadsheet path, and where it breaks
Most stores start by exporting reports into Excel or Google Sheets. That works until the refresh becomes the job. One Reddit reply summed up the friction:
"Shopify has built-in reports you can export, but on the lower-tier plans you only get the basics and you'll need to log in and pull them manually. Even on higher plans, Shopify doesn't really offer automated scheduled exports by itself." Reddit user, r/shopify, Reddit Thread
Richie Jones, CEO of VAST, remembers the early version of this. Monday mornings went to manual reports built from Shopify and returns-system exports. Every hour spent rebuilding a sheet is an hour not spent fixing what the sheet shows.
⚠️ Apps and built-in AI: verify before you trust
Forecasting apps automate the math. Built-in AI features need checking. Deb Farnworth-Wood, CEO of Issada, said her inventory system's own AI forecasting was "rubbish." Her team tried it for about six months, saw it "hallucinating and telling fibs," and shut it down.
My rule: before trusting any tool's reorder date, check three SKUs by hand with the Q3 formula. If the numbers disagree and the tool cannot explain why, do not hand it your purchasing.
Shopify forecasting options compared
Option
Good at
Watch out for
Spreadsheet from exports
Full control, no cost
Manual refresh, breaks at scale
Forecasting app
Automated reorder math
Black-box logic, separate from ad and cash data
Luca AI
Plain-English questions across Shopify, 3PL, ads, and accounting
Not an attribution pixel; needs enough sales history to reason on
✅ Where Luca AI fits
Luca AI plugs into Shopify and normalizes the data as it comes in, so there is no cleanup project first. Ask, "Which SKUs hit their reorder point this week, and what is the reasoning?" Luca AI shows the inputs behind each answer, so you can check them against your own math.
What should an inventory forecasting Excel template include?
An inventory forecasting Excel template needs one row per SKU. Columns cover units sold, in-stock days, daily sales rate, median lead time, demand and lead time standard deviations, service level z, safety stock, reorder point, on hand, on order, days of cover, and a reorder flag. Every number should be a formula on raw exports, never a typed guess.
📋 The column layout
Build this in Excel or Google Sheets. Paste raw exports into separate tabs, and keep this tab formula-only.
Inventory forecasting template: columns and formulas
Column
Field
Formula (row 2)
A
SKU
From Shopify export
B
Units sold, last 90 days
SUMIFS on the sales tab
C
In-stock days
COUNTIFS on the stock tab where stock is above 0
D
Daily sales rate
=B2/C2
E
Median lead time (days)
=MEDIAN of that supplier's PO lead times
F
Demand standard deviation
=STDEV.S of in-stock daily sales
G
Lead time standard deviation
=STDEV.S of PO lead times
H
Service level z
=NORM.S.INV(0.95) gives 1.645
I
Safety stock
=ROUNDUP(H2*SQRT(E2*F2^2+D2^2*G2^2),0)
J
Reorder point
=ROUND(D2*E2+I2,0)
K
On hand
From inventory export
L
On order
From open POs
M
Days of cover
=(K2+L2)/D2
N
Reorder flag
=IF(K2+L2<=J2,"REORDER","OK")
Column I is the full safety stock formula from Q4. Column E uses the median from Q5. Column C applies the stockout cleanup from Q2.
🧪 Test it on one SKU first
Load the hoodie and check the output by hand. You should see a daily rate of 6, a reorder point near 240, and about 43 days of cover. If the sheet disagrees, a formula or an export range is off. Fix that before you add more SKUs.
⚠️ Where spreadsheets break
Size runs. Jen Van Wart, CEO of Twigs, described a $6,000 commitment for one denim style across sizes 23 to 32. That is ten rows per style, each with thin history.
Many locations. Each warehouse needs its own row set.
The weekly refresh. Exports, pastes, and broken ranges eat the morning.
My rough line: below about 100 active SKUs, a sheet is fine. Past that, the refresh becomes a part-time job.
Luca AI can send this same reorder table as a scheduled weekly report on Slack or email, with reasoning for each flagged SKU. The template logic stays the same. The refresh disappears.
What does a full inventory forecast look like for one store?
For a hoodie selling 6 units a day, a 30-day lead time, and 53 units of safety stock rounded to 60, the reorder point is 240. With 260 on hand and nothing on order, the store has about three days to place the purchase order. Size it to cover the next order cycle, not a whole season.
🧵 The store and the inputs
Picture a Shopify apparel brand doing about $120,000 a month, running Meta ads, with one overseas supplier. It is Monday, and the hoodie is the hero product. Here is every input, pulled from the sections above:
Clean daily rate: 6 units, in-stock days only (Q2).
Lead time: 30-day median across recent POs (Q5).
Safety stock: 53 by the full formula, rounded to 60, five cartons of 12 (Q4).
Reorder point: 6 x 30 + 60 = 240 (Q3).
Days of cover: 260 / 6 = about 43, against 40 needed (Q9).
💰 The decision and the cash
The store places the PO this week. It orders one month of sales, 180 units, which clears a 150-unit MOQ in this example. At $18 a unit, that is $3,240 of cash committed.
Compare that with a store using the shortcut buffer of 220. Its reorder point would be 400, and it would have ordered weeks ago. It would also carry 160 more units of buffer than the 60 the numbers support, about $2,900 at $18. Same hoodie, same sales, very different bank balance.
Cyndi Thomason's habit fits here: keep a separate bank account just for inventory. A seller in her book called that account "sacred." Fund it from every sale, so the next PO never competes with payroll or ad spend.
🎲 Next week's routine
The Hammersley Brothers compare stock ordering to a roulette table. Their fix is to make each order an asymmetric bet: heads you win a lot, tails you lose little. Small, frequent orders on proven SKUs do exactly that.
So next Monday, repeat the check. Rerun days of cover. If an October order will land in November, apply the seasonal index from Q7 first. Watch the median lead time when the PO arrives.
Luca AI can run this check across every SKU each Monday and send only the ones that need a purchase order, with the inputs shown. You make the call. Luca AI does the arithmetic and keeps watching.
If your best seller is closer to its reorder point than you would like, start with that one SKU this week. Then tell us what broke when you ran the numbers. That is usually where the real forecast begins.
References
KimSeoHo and Andrew_185, "Inaccurate stock preparation leads to overstocking," Shopify Community. Shopify Community Thread
DemandMind, "A simple way to spot stockout risk in Shopify data," Shopify Community, December 2025. Shopify Community Thread
How often should you update an inventory forecast?
We recommend a fixed rhythm instead of updating only when something feels off. Stores that forecast once a quarter usually discover a stockout after it has already cost them ad spend.
Weekly: your top sellers, the roughly 20% of SKUs that drive most revenue. Recheck daily sales rate, days of cover, and the reorder point.
Monthly: the full catalog, including safety stock and median supplier lead times.
Before every promotion: apply the promo lift factor and the seasonal index before the campaign starts, not after.
After any supplier change: new terms, a new factory, or a new freight route all change lead time.
The weekly check matters most because sales rates drift quietly. A SKU with small week-over-week growth often runs out earlier than its reorder point suggests.
Luca AI can run this weekly check for you and send a scheduled report on Slack or email that lists only the SKUs whose reorder point moved, with the reason. We still leave the purchase decision with you. The goal is a Monday review that takes minutes instead of a morning of exports and pasted ranges.
What is the difference between inventory forecasting and demand forecasting?
Demand forecasting estimates how many units customers will want. Inventory forecasting turns that estimate into stock decisions: when to reorder, how much to order, and how much buffer to hold.
Demand forecasting answers: how many hoodies will we sell in November?
Inventory forecasting answers: given that demand, a 30-day lead time, and 60 units of safety stock, when do we place the purchase order and for how many units?
So demand forecasting is an input. Inventory forecasting adds supplier lead time, minimum order quantities, stock on hand, stock on order, and cash limits. A perfect demand forecast still produces stockouts if lead time is wrong, and it still ties up cash if safety stock is set with the max-minus-average shortcut.
We see many stores treat the two as the same task. They build a sales projection, then guess the order quantity. The gap between those two steps is where most inventory cash leaks.
If you want to go deeper on the demand side, our guide to AI demand forecasting for e-commerce covers the sales projection methods in more detail. Luca AI connects both halves by reading Shopify sales next to stock levels and purchase orders.
How do you forecast inventory for a product with no sales history?
We use an analog SKU plus a deliberately small first order. A new product has no daily sales rate, so the reorder point formula has nothing to work with until real sales arrive.
Pick an analog: a past SKU with a similar price, audience, and sales channel.
Borrow its launch curve: use the analog's first 60 days of in-stock sales as your starting estimate.
Order small: enough to cover roughly one lead time at the analog's rate, then plan a fast reorder.
Replace the analog quickly: after two to four weeks of real sales, switch to the product's own in-stock daily rate.
The logic is an asymmetric bet. Being short for a week on a new product costs some sales. A warehouse full of a product nobody wanted costs cash for months, plus storage fees and markdowns.
Luca AI can help pick the analog. Ask it in plain English which past launches had a similar price point and audience, and how they sold in their first 60 days. That comparison is a short question through conversational analytics instead of a spreadsheet project.
How accurate should an inventory forecast be?
There is no universal target, so we measure accuracy per SKU with MAPE, the mean absolute percentage error. For each period, take the gap between forecast and actual sales, divide by actual sales, then average those percentages.
Steady best sellers should be your most accurate SKUs, because their history is long and stable.
Seasonal and promoted SKUs will miss by more. Judge them against their own past error, not against steady sellers.
New and long-tail SKUs carry the widest error. Cover them with smaller orders rather than chasing precision.
Track MAPE over at least eight weeks before switching methods, because one week can flatter any model. The useful question is not whether the forecast is perfect. It is whether safety stock covers the error you actually see.
A forecast that misses by a known, stable amount is easier to plan around than one that is usually close and occasionally far off. That is why we pair accuracy tracking with safety stock that includes lead time variation.
Luca AI compares forecast to actual for each SKU on request, so you can see which products drift. Forecast error is one of the e-commerce KPIs worth reviewing monthly.
How do you plan inventory for Black Friday and the holiday season?
We plan holiday inventory backward from the date the stock must be sellable. Start with the clean baseline daily rate, then apply what you already know about the season.
Apply the seasonal index: divide last November's sales by the average month. An index of 1.8 means November sells 1.8 times a normal month.
Add the promo lift: measure it from your own past Black Friday campaigns, not a vendor benchmark.
Use a longer lead time: ports, carriers, and 3PL receiving all slow down before the holidays. Plan on your median lead time plus extra safety stock.
Order earlier, not just bigger: stock that lands after the sale is dead stock in January.
Remove last year's one-off spikes before you apply the index. A viral moment that will not repeat should not set this year's order.
Watch cash as closely as units. Many founders feel flush in January and then run short in the slow summer months. A plan that sells through in December but leaves aged stock behind still hurts.
Luca AI reads your past Meta, Klaviyo, and Shopify data together, so the lift factor comes from your own campaigns. Pair the stock plan with a cash flow forecast before you sign the purchase orders.
Enjoyed the read? Join our team for a quick 15-minute chat — no pitch, just a real conversation on how we’re rethinking Ecommerce with AI - Luca
Loading Schedule...
Your AI Co-Founder is here.
Here’s why:
Shopify, Meta, Xero - one brain.
"Should I scale?" Answered with real data.
Growth capital. No applications. One click.
Thank you! Your submission has been received! Please book a time slot for the Meeting
Oops! Something went wrong while submitting the form.