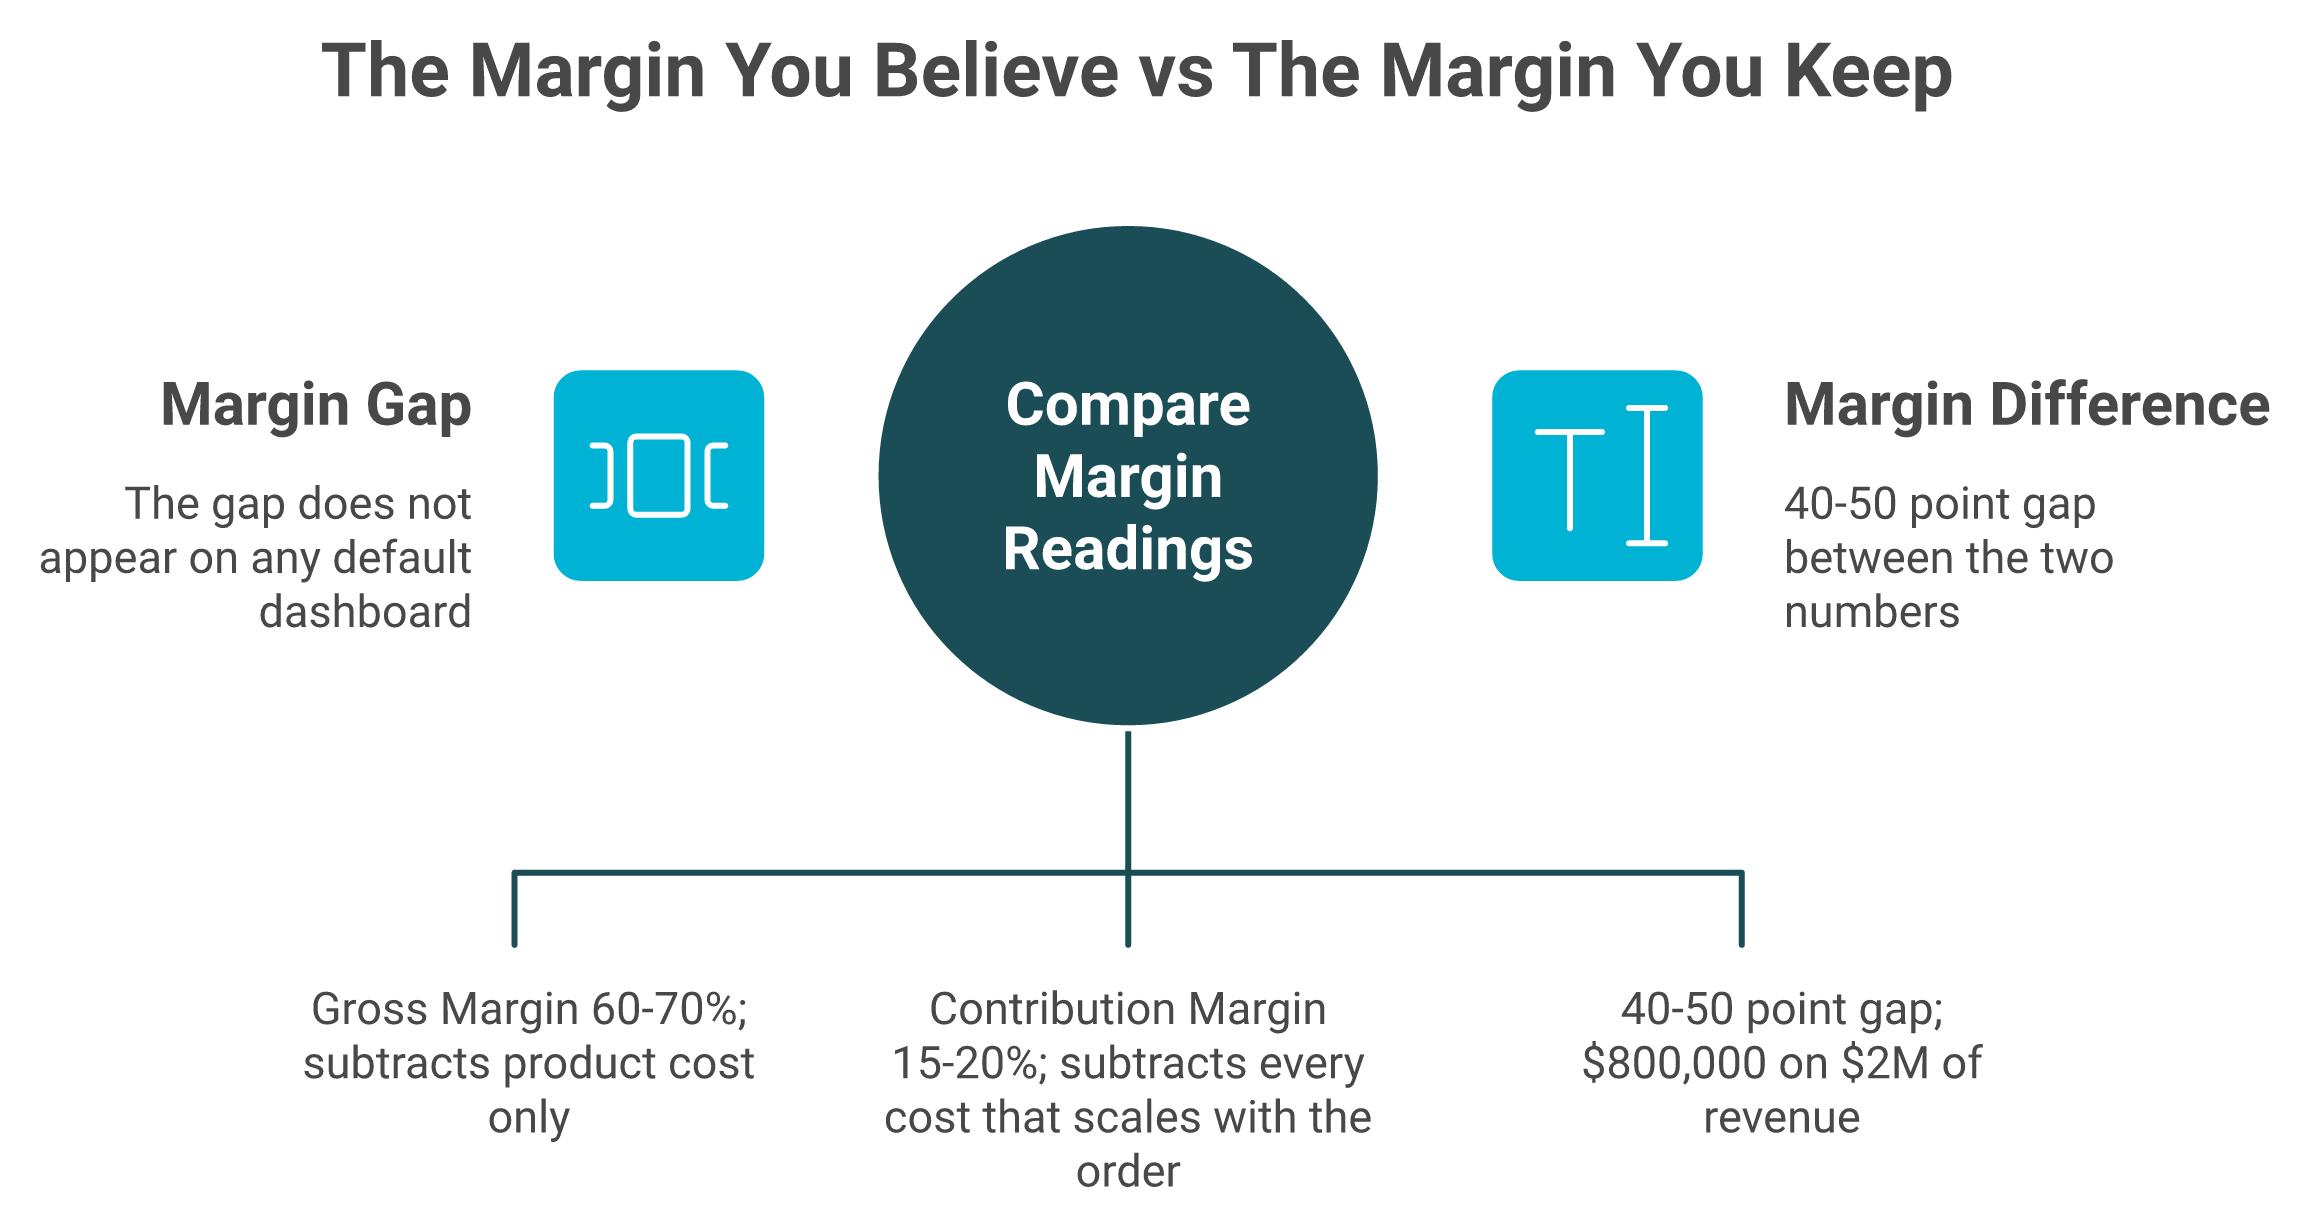
Gross margin only subtracts product cost. Across 33,000+ Shopify brands the median DTC business runs 60 to 70 percent gross margin and finishes at 15 to 20 percent true contribution margin.
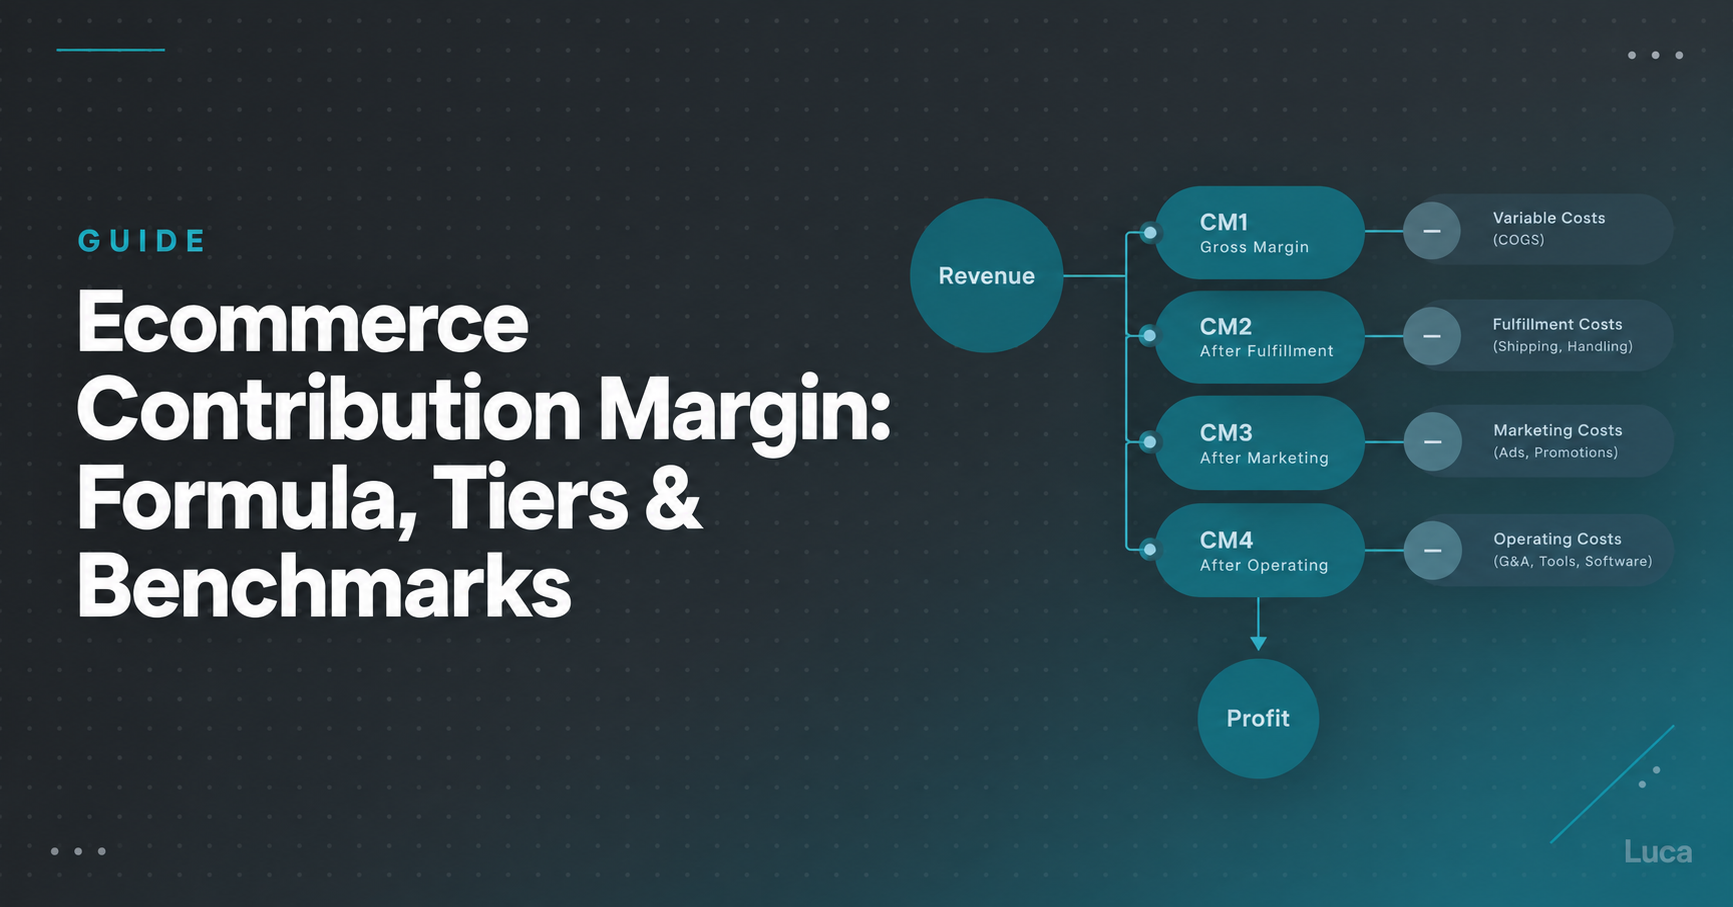
Contribution margin equals net revenue minus every cost that scales with an order: landed COGS, storage, pick and pack, shipping, fees, returns, support, and attributable ad spend.
CM1 is a sourcing metric, CM2 an operations metric, CM3 the only tier that tells you whether scaling paid acquisition makes money. CM4 strips variable overhead.
One $49.99 SKU at 72 percent gross margin carried $71.30 of true cost and lost $21.31 per order, reaching 23 percent contribution margin after four fixes.
Healthy sits at 20 to 35 percent, strong at 35 to 50 percent, danger below 15 percent. Contribution margin tracks media efficiency more sharply than vertical does.
Your real floor is monthly fixed costs divided by net revenue. Review CM3 weekly in dollars, SKU economics monthly, and landed cost quarterly.
Q1. Why is your gross margin lying to you about which products make money? [toc=1. The Gross Margin Lie]
A founder I spoke with last quarter slid her product sheet across the table and pointed at one line. Ceramic knife set. Seventy-two percent gross margin. Her best seller, two years running, the SKU every Meta dollar was pushed toward. Then we opened her 3PL invoices and her returns log, and the number stopped being seventy-two.
Gross margin only subtracts what it costs to make the thing. It says nothing about what it costs to sell, ship, process, and refund the thing. Across 33,000+ Shopify brands measured in Triple Whale's 2025 benchmark set, the median DTC business runs a 60% to 70% gross margin and finishes at a 15% to 20% true contribution margin. That 40 to 50 point gap is where stores quietly bleed, and it does not appear on any default dashboard.
💸 The gap is not a rounding error
Forty points of margin is not a reporting quirk. On $2 million of revenue, it is $800,000 of money you thought you had.
Gross margin is a sourcing metric. It answers one question: what did the factory charge me? Contribution margin is an operating metric. It answers the question that actually matters, which is whether the next order makes you money after every cost that scales with it. If you want the side-by-side version of that distinction, we broke it down in contribution margin vs gross margin.
The median DTC brand runs a 60 to 70 percent gross margin and finishes at 15 to 20 percent contribution margin. That gap is the article's whole subject.
⚠️ Blended averages are the mechanism
Here is why the gap hides so well. Most store owners look at store-wide averages: average shipping cost, average return rate, and average CAC (customer acquisition cost, the ad spend needed to win one customer). Averages are the perfect camouflage for an underwater product.
In the knife-set case, blended shipping across the catalog looked fine. That specific SKU shipped at three pounds dimensional weight in a fragile-rated box. Supply chain analyst Lara Kelly, who runs line-by-line SKU teardowns for DTC brands, puts it plainly: your blended average is lying to you. One high-weight, high-return SKU can sit at negative margin while the catalog average reads healthy.
Fulfillment alone is big enough to swing this. Kunle Campbell's work on DTC growth operations puts fulfillment at 12% to 20% of revenue for ecommerce brands. If you are averaging that cost across a catalog with mixed weights and return rates, you are averaging across the exact variable that decides which products survive. This is the same averaging problem that distorts ecommerce profit margins at the catalog level.
⭐ What this costs in practice
The pattern I keep seeing is not fraud or carelessness. It is a reporting default. Shopify's gross profit view uses the cost-per-item field, and that field does not include inbound freight or duties. So the first cost line is already understated before any of the harder ones get counted.
Operators feel this before they can measure it. In one long-running r/shopify thread on profit tracking, store owners describe stitching costs together in free spreadsheets, often leaving advertising out of the calculation entirely. They are not computing profit. They are computing a number that looks like profit.
✅ What you can compute by Monday
My honest read, after looking at a lot of these sheets, is that most brands do not have a margin problem. They have a visibility problem that becomes a margin problem about eighteen months in.
The fix is mechanical, and the rest of this article walks it: define net revenue correctly, count all nine variable cost lines, split the result into tiers, and run the math per SKU instead of per store. One afternoon of work usually finds the leak. Sometimes it finds two. If you want the broader frame first, start with the best way to track e-commerce unit economics.
Q2. What is the ecommerce contribution margin formula, and which costs belong in it? [toc=2. Formula & Cost Stack]
Contribution Margin = Net Revenue minus every cost that scales with an order. Net revenue is gross sales minus discounts, returns, refunds, and chargebacks. The variable costs are landed COGS, storage, pick and pack, outbound shipping, payment processing, platform and marketplace fees, allocated returns, allocated support, and attributable ad spend. Divide the result by net revenue to get CM%. What remains covers fixed costs, then profit.
📊 Start at net revenue, not gross sales
Most broken calculations break in the first line. If you start from gross sales, every discount code and every refund inflates your margin before you subtract a single cost.
Net revenue is what the customer actually paid you and kept. Gross sales, minus discounts, minus returns and refunds, minus chargebacks. Start there and the rest of the stack stays honest.
💰 The nine cost lines, with real numbers
Placeholder variables teach nobody. Here is the same $49.99 knife set from Lara Kelly's teardown, costed line by line.
Contribution Margin Cost Stack on a $49.99 Ceramic Knife Set
Line
Amount
What it includes
Net revenue
$49.99
Price actually collected
Landed COGS
$17.75
FOB $14.00, freight $2.40, duties at 7.5% ($1.05), brokerage $0.30
Storage
$0.65
Pallet fees across a 47-day average stay
Pick, pack, fulfillment
$4.10
Base pick/pack $2.20, fragile insert $0.80, box and materials $1.10
Outbound shipping
$8.40
3 lbs dimensional weight
Payment processing
$1.75
2.9% plus $0.30 per transaction
Allocated returns
$6.20
18% return rate, $34 loss per return, spread per unit
Allocated support
$1.45
42% of all tickets, $13,000 of salary, 9,000 units
Attributable CAC
$31.00
Product-specific ad spend
Total variable cost
$71.30
-
Contribution margin
-$21.31
A loss of roughly 43% per order
Two lines in that table are the ones I almost never see in a founder's spreadsheet: allocated returns and allocated support. Together they are $7.65 a unit, which is more than the outbound shipping everybody remembers to count.
⏰ Percentage tells you health, dollars tell you what to do
Both views matter, and they answer different questions. CM% is -42.6% here, which tells you the SKU is broken. CM dollars is -$21.31, which tells you that every additional order makes the problem worse by twenty-one dollars.
Three of these nine do not come out of the platform the way you expect. Landed COGS is understated because the cost-per-item field excludes inbound freight and duties. True label cost lives in the Shipping labels export, not the order record. Real processing fees live in Payouts, not in the order total.
Luca AI assembles this nine-line structure by connecting the sources that each line actually lives in: Shopify for net revenue and returns, the 3PL feed for storage and pick-pack, the carrier data for label cost, Meta and Google for attributable spend, and the support tool for ticket share. Luca normalizes those fields on ingestion, so the per-SKU stack is already built when you ask for it rather than rebuilt by hand each month. That is the ecommerce data integration layer doing the work before the question gets asked.
Q3. How is contribution margin different from gross margin and net profit? [toc=3. CM vs Gross vs Net]
Gross margin subtracts product cost only and answers a sourcing question. Contribution margin subtracts every variable cost, including fulfillment, fees, returns, and ad spend, and answers whether the next order is worth taking. Net profit subtracts fixed costs on top and answers whether the business works. Shopify's own gross-profit-by-product report is not contribution margin, and treating it as one is the single most common error on this topic.
🔍 Three metrics, three different decisions
These three numbers get used interchangeably in founder conversations, and they should not be. Each one belongs to a different decision and usually a different person.
Gross Margin vs Contribution Margin vs Net Profit
Metric
What it subtracts
The decision it drives
Who owns it
Gross margin
Product cost only (ideally landed)
Should we source this product, at this price, from this supplier?
Founder or sourcing lead
Contribution margin
Every variable cost: fulfillment, shipping, fees, returns, support, ad spend
Should we take, scale, reprice, or kill this order and this SKU?
Head of Growth with the CFO
Net profit
All of the above plus fixed costs: rent, salaries, software, retainers
I do not think this is a trap set on purpose. Platform reporting is built for bookkeeping, where product cost and revenue are the clean, auditable fields. Shipping labels, return losses, and ad spend sit in other systems, so they never make it into the product-level view. The report is correct about what it measures. It is just not measuring the thing you need. We walk through what the native reports do and do not cover in our Shopify analytics dashboard explainer.
✅ A simple test before you trust a margin number
Ask one question of any margin figure on your screen: does this number move when my return rate moves? If the answer is no, you are looking at gross margin.
Then ask a second: does it move when my CAC moves? If no, you are at best looking at CM2. That two-question check takes ten seconds and has saved more than one founder from scaling a loser.
Benchmarks only make sense once you know which of the three you hold. Eightx's CFO work on DTC unit economics treats a 20% CM3 as the working floor and under 15% as the point where paid acquisition starts buying customers at a loss. Compare that to a gross margin figure and you will reassure yourself about a store that is sliding. Pair the right metric with the right reporting rhythm using our guide to ecommerce KPIs.
Q4. What are CM1, CM2, CM3, and CM4, and which tier should run your decisions? [toc=4. CM1-CM4 Tiers]
CM1 is net revenue minus landed cost. CM2 is CM1 minus variable fulfillment: storage, pick and pack, outbound shipping, merchant fees, allocated returns, and allocated support. CM3 is CM2 minus attributable customer acquisition cost. CM4, where brands use it, also strips variable overhead such as app subscriptions and agency retainers. CM1 is a sourcing metric, CM2 is an operations metric, and CM3 is the only tier that tells you whether scaling paid acquisition makes money.
🪜 The ladder, on one real SKU
Tiering is not accounting theory. It is how you find which function owns the leak. Same knife set, walked down the ladder.
Storage, pick/pack, shipping, processing, returns, support ($22.55)
$9.69
19.4%
CM3
Attributable CAC $31.00
-$21.31
-42.6%
CM4
Variable overhead such as apps and retainers
Lower again
Lower again
Look at where the damage happens. CM1 is healthy. Nothing is wrong with the sourcing. The product dies between CM1 and CM3, which means the problem belongs to operations and media, not to the supplier.
🎯 Which tier owns which decision
CM1 answers sourcing questions. Supplier choice, order quantity, freight mode, and country of origin.
CM2 answers operations questions. Packaging, carrier mix, return policy, support load, and warehouse terms.
CM3 answers growth questions. Can this SKU absorb paid traffic, and at what CAC ceiling?
CM4 answers portfolio questions at larger scale, once app and agency costs vary meaningfully by product line.
My position: run weekly decisions on CM3 and sourcing decisions on CM1. CM2 is the diagnostic middle, useful for finding the leak but a poor number to manage by, because it cheerfully ignores the biggest variable cost most DTC brands carry. Tier-level reporting is also what makes ecommerce reporting usable by more than one function.
⭐ Most benchmark arguments are tier confusion
When two operators argue about whether 30% is a good contribution margin, they are usually quoting different tiers at each other. One means CM2. One means CM3. Both are right and the conversation is useless.
Eightx publishes CM1, CM2, and CM3 ranges separately for exactly this reason. Common Thread Collective's Q1 2026 channel benchmark, built on $1.01 billion of DTC revenue across 299 brands, reports contribution margin after media, which is a CM3-style figure. Before you compare yourself to any published number, check which costs sit inside it.
⚠️ The CM4 caution
I would not rush to CM4 below roughly $5 million in revenue. Allocating app fees and retainers per SKU takes real effort, and the answer rarely changes a decision at that stage. Operators in r/ecommerce profit-tracking threads are mostly still fighting to get CM2 right in a spreadsheet. Get CM3 trustworthy and monthly first. CM4 is a refinement, not a prerequisite. When the spreadsheet stops scaling, an AI data analyst for ecommerce is the next honest step.
Q5. Should customer acquisition cost sit inside contribution margin? [toc=5. CAC Inside CM?]
Yes, at CM3. Accountants argue that CAC is a marketing expense and belongs in operating overhead. Operators counter that if you must spend money to acquire a customer in order to sell that unit, it is a variable cost of that sale. You can argue about where it lands on the P&L. You cannot make good product decisions without it inside your SKU-level math.
📒 The accountant's case, stated fairly
The objection is not stupid, and I want to give it full weight. Ad spend is lumpy. It is often campaign-level, not product-level. Attribution is contested, which means any per-SKU CAC figure carries an error bar.
So the traditional view puts CAC under sales and marketing, below the gross profit line. On a formal income statement, that is defensible. It keeps product costing clean and auditable.
💸 The operator's case, and why it wins
Then you sit with a founder deciding whether to double a budget on one SKU, and the formal view falls apart. Supply chain analyst Lara Kelly puts the test simply: if you have to spend money to acquire a customer to sell that unit, it is a variable cost of that sale.
Here is the decision that changes. Take the knife set from earlier. At CM2, excluding CAC, it returns $9.69 per unit, roughly 19%. Include the $31.00 of attributable ad spend and it returns negative $21.31.
This is also why media reporting alone misleads. Nick Shackelford's position, covered in Digital Darts' breakdown of his media approach, is blunt: ROAS and CTR mean little on their own, and media buyers need the financial layer to see real profit per order.
ROAS (return on ad spend) tells you what the platform thinks it returned. It knows nothing about your freight, your 18% return rate, or your support load. A 2.4x ROAS can be excellent on one SKU and fatal on another. We take that apart in declining platform ROAS vs true profitability.
Operators feel this gap before they fix it. In long-running r/shopify threads on profit tracking, store owners describe building cost spreadsheets that leave advertising out entirely, then wondering why the bank balance disagrees with the margin column.
✅ The one legitimate exception
There is a real carve-out, and ignoring it would be dishonest.
Repeat and subscription orders. If the customer was acquired months ago, the acquisition cost belongs to that first order, not this one. Run these at CM2, then track blended CAC separately at the cohort level.
Wholesale and retail orders. No attributable paid spend, so CM2 is the right view. Trade spend and chargebacks take CAC's place.
Organic and referral-heavy SKUs. Keep them at CM2 if you can genuinely prove almost no paid traffic touched them. Most brands cannot.
My rule of thumb: run CM3 for anything you are deciding whether to advertise, and CM2 for anything you are deciding whether to keep making. That split has survived every argument I have had about it. Cohort-level CAC is easier to hold once ecommerce customer lifetime value sits beside it.
⏰ How to carry both numbers without losing your mind
Report both tiers side by side, every month, on the same row. CM2 tells you whether the product and the operation work. CM3 tells you whether growth works.
Faris and Cody Plofker make a related point about watching contribution margin in dollars rather than percentages, because ratios drift when spend drops. A low-spend month can lift your CM3 percentage while your total contribution dollars fall. Carry the dollar figure next to the percentage and that illusion disappears.
I could be reading the accounting objection too harshly. But I have never once seen a founder regret putting CAC into their product math.
Q6. What does it look like when a 72% gross margin bestseller loses $21 an order? [toc=6. SKU Teardown]
A $49.99 ceramic knife set at 72% gross margin carried $71.30 in true per-unit cost once landed freight, duties, 47 days of pallet storage, fragile pick and pack, dimensional shipping, merchant fees, an 18% return rate, 42% of all support tickets, and $31.00 of attributable CAC were counted. The net result was a $21.31 loss per order, on a product that had absorbed two years of scaling and hundreds of thousands of dollars in ad spend.
🏠 The situation: a $2.3M brand with a hero SKU
Maya runs a homegoods brand, mostly kitchen products, doing about $2.3 million a year. Growing fast, hustling hard, exhausted in the way that revenue growth hides.
When asked what was working, she pointed straight at the ceramic knife set. Factory cost $14.00, retail $49.99, 72% gross margin. Two years of ad budget had been aimed at it.
🔍 The complication: twenty minutes of line-by-line costing
The audit was not clever. It was arithmetic, pulled from four different places.
Where the Margin Was Hiding: Per-Unit Cost Teardown
Cost line
Per unit
Where it was hiding
Landed cost
$17.75
Freight, 7.5% duties, and brokerage on top of the $14.00 invoice
Storage
$0.65
47-day average stay in the warehouse
Pick, pack, fulfillment
$4.10
Fragile insert and custom box
Outbound shipping
$8.40
Three pounds dimensional weight
Payment processing
$1.75
2.9% plus $0.30
Allocated returns
$6.20
18% return rate at a $34 loss per return
Allocated support
$1.45
42% of all tickets, across 9,000 units
Attributable CAC
$31.00
Product-specific ad spend
Three lines did most of the damage: shipping, returns, and CAC. Together they were $45.60 on a $49.99 product.
💸 Why fulfillment is usually the quiet one
Shipping and fulfillment are the costs founders most often carry as a store-wide average. Kunle Campbell's work on DTC operations places fulfillment at 12% to 20% of revenue for ecommerce brands. On this SKU it ran closer to 26% once storage and the fragile packaging were counted.
The data was not missing. It sat in the 3PL invoices, the Shopify returns log, the support tool, and Meta. It had simply never been assembled in one row, which is the core failure that ecommerce data integration is supposed to solve.
⚙️ The resolution: four fixes, six months
Nothing exotic happened next. Four unglamorous moves, in order of speed.
Raised price from $49.99 to $59.99. Volume dipped slightly, and contribution rose immediately.
Added an instructional usage video on the product page. Returns fell from 18% to 9%, which also cut the support load.
Moved hero ad spend to a high-margin cutting board set, dropping attributable CAC on the knife set.
Re-engineered the box to reduce dimensional weight, saving $0.80 per unit.
Six months later, the knife set ran at a 23% contribution margin. Same product. Same factory. Same customer.
⭐ The part that should bother you
Nobody here was careless. Maya ran a real business with real reporting. The number was wrong because it lived in four systems that never spoke to each other.
Luca AI sits as an AI layer over the warehouse holding those four feeds, so a per-SKU contribution margin assembles itself rather than being rebuilt by hand. Ask it which SKUs fell below 15% CM3 last month, and it names the cost component that moved. The decision stays yours. That is the difference between a dashboard and an AI data analyst for ecommerce.
Q7. What is a good ecommerce contribution margin, and what do the benchmarks say? [toc=7. CM Benchmarks]
Healthy sits at 20% to 35% of net sales, strong at 35% to 50%, and below 15% is a danger zone where one bad month turns negative. Across 299 DTC brands running $1.01 billion of revenue and $231 million of paid media in Q1 2026, aggregate contribution margin was 29.3% at a median 4.23x MER. The same dataset splits sharply by media efficiency: 17.7% under 3x MER versus 52.8% above 15x.
📊 Read the dataset before you read the number
Any benchmark without a sample size and a date is a vibe. So here are the two I trust most, with their provenance stated.
💰 Contribution margin tracks media efficiency, not just vertical
This is the finding most benchmark posts skip, and it is the most useful one. MER (marketing efficiency ratio, total revenue divided by total ad spend) sorts contribution margin more cleanly than category does.
Median Contribution Margin by MER Bucket, Q1 2026
MER bucket
Median contribution margin
Under 3x
17.7%
3x to 5x
roughly mid-20s
5x to 8x
39.4%
Over 15x
52.8%
Read that spread carefully. A brand at 2.8x MER is not in a different industry from a brand at 6x. It is in a different financial reality. Tracking that spread month to month is a job for AI marketing analytics for ecommerce.
🧾 Vertical ranges, with the drag named
Vertical still matters, mostly because each category has a signature cost that eats the margin. Treat these as working ranges at CM3, not laws.
Typical CM3 Range by Ecommerce Vertical
Vertical
Typical CM3 range
Primary drag
Beauty and personal care
18% to 28%
High CAC, heavy discounting
Subscription consumables
22% to 34%
Churn and repeat-order shipping
Apparel
10% to 22%
Return rates of 20% to 30%
Home and furniture
10% to 20%
Freight weight and damage claims
Food and beverage
4% to 14%
Cold chain and spoilage
Consumer electronics
5% to 12%
Thin landed margin, support load
Two structural costs explain most of this. Fulfillment runs 12% to 20% of revenue for ecommerce brands. And AOV (average order value) sets the ceiling. Operators who sell at a $30 AOV can make money, but as one ecommerce teardown channel argues, profitability at scale usually needs the $80 to $100 range to absorb ads, fees, chargebacks, and refunds. Benchmarks like these belong in your standing set of ecommerce KPIs, not in a one-off audit.
⚠️ Channel CM3 is where the spread gets violent
Blended CM3 hides channel-level disasters. Channel analyses built on Northbeam's 2025 review data put fully loaded Meta CM3 as low as negative figures for some brands, while email and SMS run far higher because acquisition cost is near zero.
That is not an argument against paid. It is an argument for knowing which channel is subsidizing which, which is the whole purpose of cross-channel analytics.
✅ An average is not your floor
Here is my honest caution on all of this. A 29.3% aggregate is a reference point, not a target. Your floor depends on your fixed costs, which the next section computes.
Luca AI measures contribution margin against a store's own prior periods rather than against an industry average, because the trend in your numbers tells you more than the gap to someone else's.
Q8. What contribution margin do you need to cover your own fixed costs? [toc=8. Your CM Floor]
A store's contribution margin floor is its monthly fixed costs divided by its monthly net revenue. A brand carrying $120,000 of fixed costs on $500,000 of net revenue needs a 24% CM3 just to break even, regardless of what any industry benchmark says. Luca AI tracks contribution margin dollars against that computed floor each period and flags variance in either direction, including months that come in above target.
🧮 Four steps to your own number
Total your true fixed costs for last month. Rent, salaries, software, retainers, insurance, and debt service. Anything that does not move with order volume.
Take last month's net revenue. Gross sales minus discounts, returns, refunds, and chargebacks.
Divide fixed costs by net revenue. That percentage is your break-even contribution margin.
Add the profit you intend to keep. If you want a 10% net margin, your CM3 target is the break-even figure plus 10 points.
Cyndi Thomson's work on ecommerce bookkeeping makes a related point worth stealing: verify these inputs against bank and card statements, not against your inventory software, which often never reconciles. The same discipline underpins any honest cash flow forecast for e-commerce.
⏰ Watch the dollars, not just the ratio
Ratios flatter you in quiet months. Cut ad spend in half and your CM3 percentage climbs while your contribution dollars fall. Rent does not care about your percentage.
So carry both. The percentage tells you health per order. The dollar total tells you whether fixed costs get covered this month. Faris and Plofker argue for exactly this dollar-first habit over MER-style ratio targets.
💰 The twist: beating your target is also a problem
Here is the part that surprises people. Coming in far above your contribution margin target is not a win.
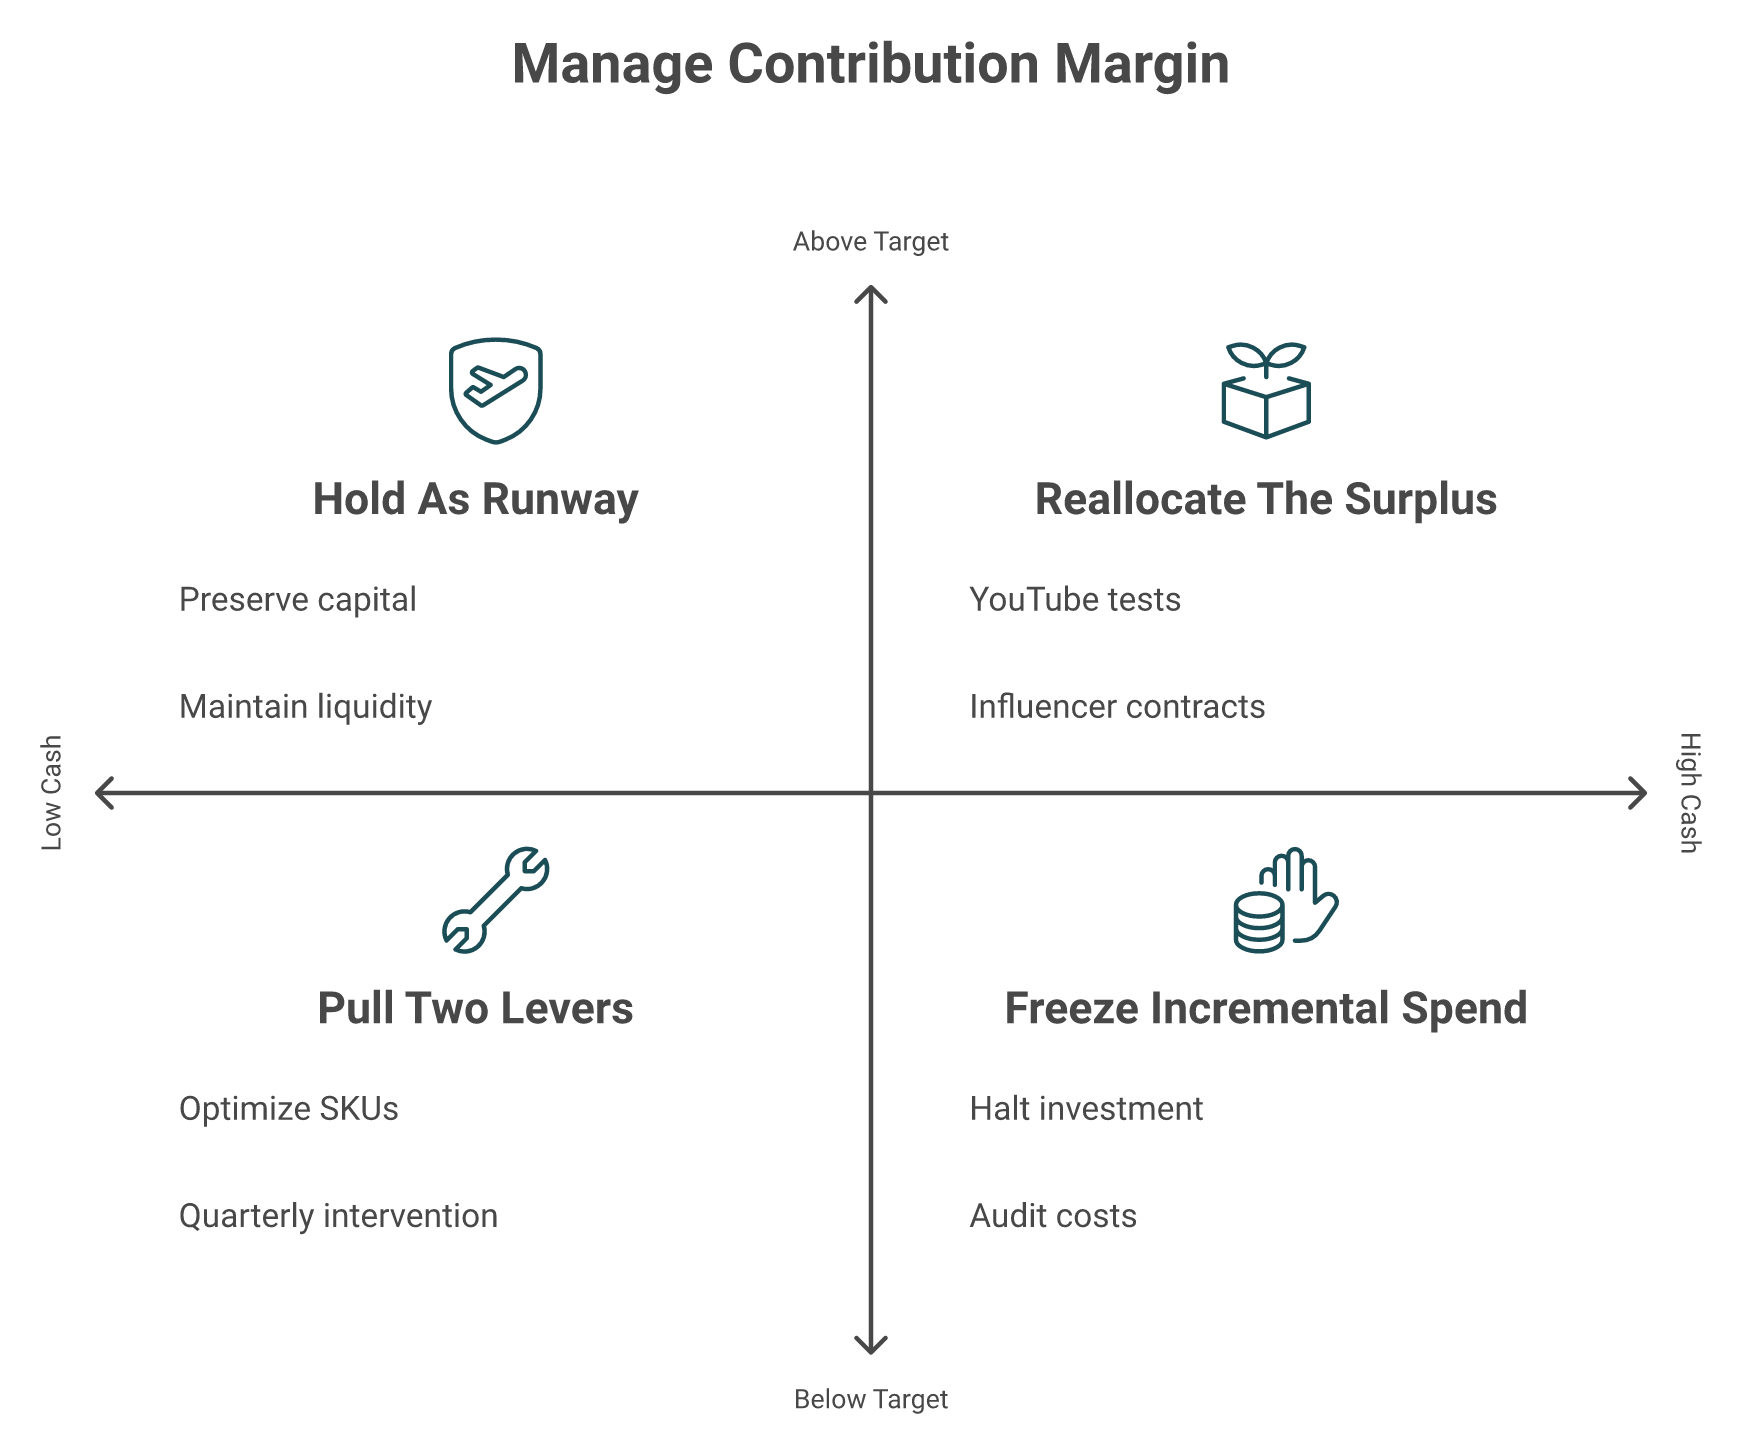
One agency team reported being 255% above their contribution margin target and treated it as a miss. Their read was that overperforming that hard meant they had underspent on growth and left demand on the table. The surplus was not profit. It was unbought future revenue.
Their protocol was to reallocate the surplus into long-lead acquisition: YouTube tests, email lead generation, and influencer contracts that build next quarter's pipeline rather than this month's checking balance. That reallocation decision sits at the center of any real ecommerce growth strategy.
⚠️ Where the surplus argument breaks
I would not apply this blindly below $3 million in revenue. At that stage, a cash buffer is a strategy, not laziness. Operators in r/ecommerce profit-tracking threads are often still working out which costs belong in the calculation at all.
My read: hold three months of fixed costs in cash first. Reallocate surplus above that line. Below it, the surplus is your runway.
Your floor is fixed costs divided by net revenue. What you do next depends on where you land against that floor and how much cash sits behind you.
🏦 When the move clears but the cash lands late
Sometimes the floor math says yes and the timing says no. The inventory order is due now, and the cash arrives in 60 days.
Luca AI also underwrites growth capital, and on a capital decision only capital terms matter. Judge it the way you would judge any lender: cost of capital as a flat fee you can quote against a revenue-based financing or term-loan offer, time from request to disbursal measured in days, repayment that flexes with sales, and no equity or personal guarantee.
Q9. How do you calculate contribution margin per SKU in Shopify without lying to yourself? [toc=9. Shopify SKU Workflow]
Pull net sales from Analytics then Finances Summary, real payment fees from Payouts rather than order totals, true label cost from the Shipping labels export matched to order IDs, and landed COGS including inbound freight and duties, which Shopify's cost-per-item field excludes and which alone can inflate CM1 by 5 to 15 points. Build one row per SKU with nine cost columns, allocate returns and support by actual share, then reconcile every figure against bank statements. Luca AI assembles the same nine columns from connected Shopify, 3PL, ad platform, and support data, and reports per-SKU contribution margin on a schedule you set.
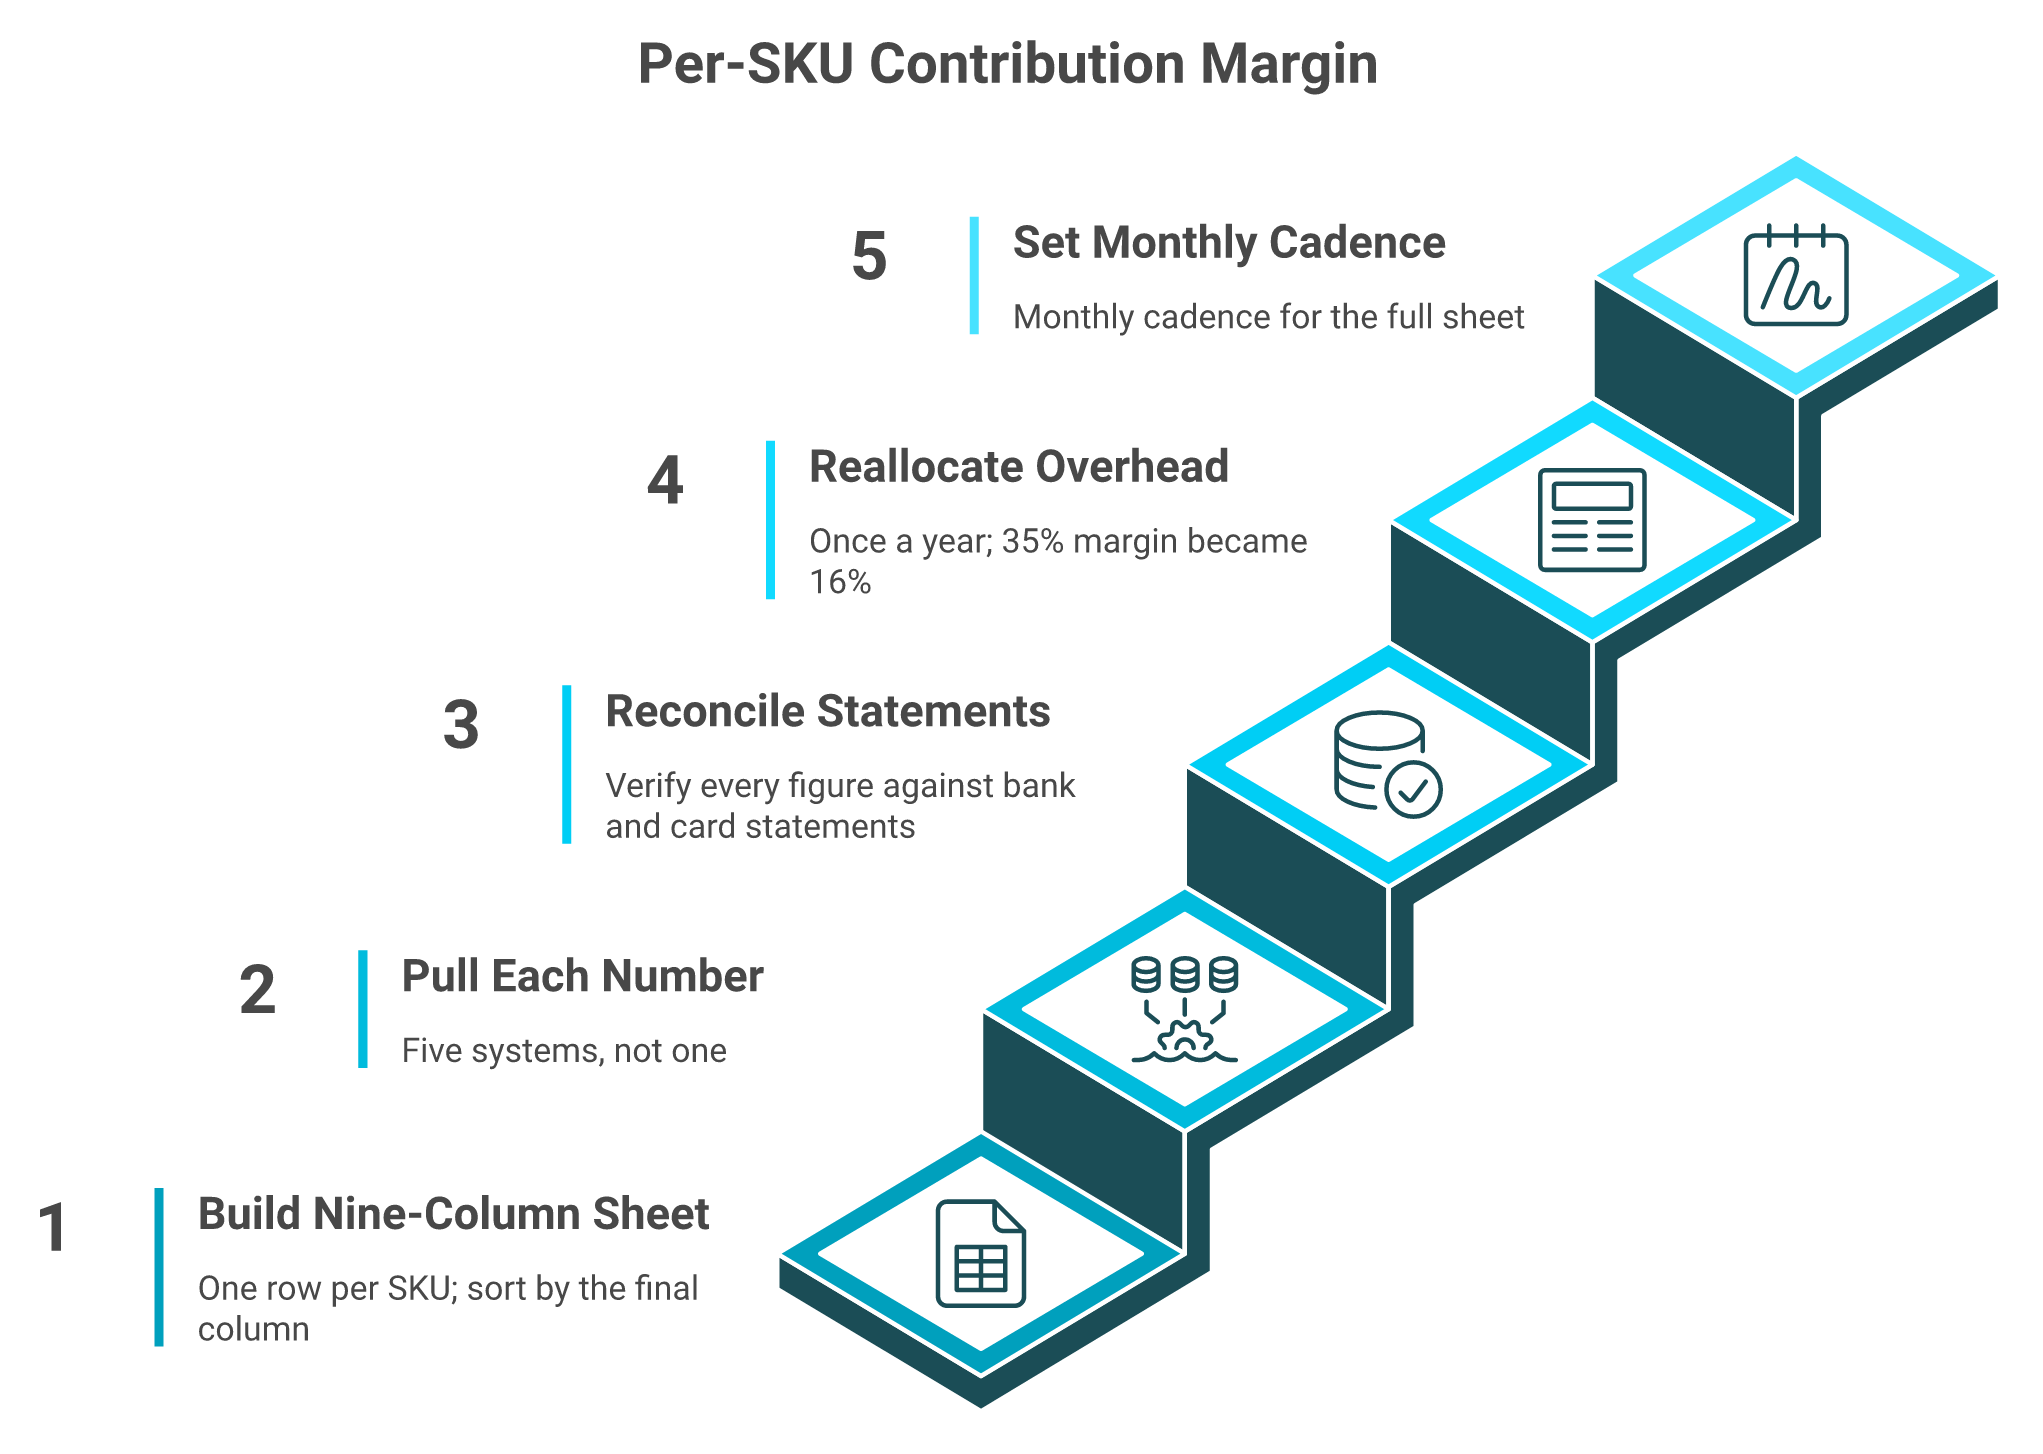
🧾 Step 1: Build the nine-column sheet
Open a spreadsheet. One row per SKU, nine columns across. Lara Kelly's version is the one I keep recommending, because it is simple enough that people actually maintain it.
The columns: net revenue, landed cost, storage, pick and pack, outbound shipping, payment processing, allocated returns, allocated support, and attributable CAC. Sort by the final column when you are done. The sort is where the surprise lives. If you would rather start from a structured view than a blank sheet, our guide to tracking e-commerce unit economics lays out the same columns.
🔍 Step 2: Pull each number from the right place
The nine-column sheet only tells the truth if each figure comes from the system that actually holds it, and if it reconciles to the bank.
This is where most sheets go wrong, so be specific about sources.
Net sales: Analytics, then Reports, then Finances Summary. Not gross sales.
Landed COGS: your supplier invoice plus freight, duties, and brokerage. Do not use the cost-per-item field alone, because it excludes inbound freight and duties.
Storage and pick/pack: your 3PL invoice, divided by units shipped for that SKU.
Outbound shipping: the Shipping labels export, matched to order IDs, then netted against shipping revenue collected.
Payment processing: the Payouts report, which shows actual fees after chargebacks and currency conversion.
Returns: return rate times the full loss per return, not just the refund amount.
Support: ticket share for that SKU times your monthly support cost, divided by units.
CAC: product-level or campaign-level spend, attributed as honestly as you can.
Pulling five exports every month is also the argument for proper ecommerce data integration once your catalog grows.
⚠️ Step 3: Reconcile before you trust it
Cyndi Thomson's warning on this is the most practical line in ecommerce bookkeeping: do not pull cost numbers from inventory software unless you have verified them against your financial statements. Many inventory systems never reconcile to bank or card accounts, so stale costs sit there quietly.
Two more input disciplines are worth copying from Kunle Campbell's operations work. Use median rather than mean for lead times, because one delayed container distorts the average. And strip shipping charges and discounts out of AOV before you use it for anything. Both inputs feed straight into ecommerce inventory management decisions.
💸 Step 4: Check your overhead assumption once a year
One seller interviewed in Thomson's book described a product he believed carried a 35% margin. After overhead was allocated properly, including HR and costs his reporting tools never showed, it was 16%. Some products turned out to be unprofitable.
Run that allocation annually. It is not a monthly job, and it does change which products you back. It is also the fastest way to find out whether your headline ecommerce profit margins survive contact with reality.
⏰ Step 5: Set the cadence and stick to it
Monthly is the right rhythm for the full sheet. Operators in r/shopify profit-tracking threads tend to build the sheet once, then let it rot for a quarter. A stale sheet is worse than no sheet, because you will trust it.
Luca AI is what the nine-column sheet becomes when it stops being manual. The sheet works at 30 SKUs and breaks at 300, because nothing tells you when a 3PL pick fee or a carrier's dimensional rate quietly moved. Luca surfaces which cost component drove the change and pushes the per-SKU report into Slack or email, which is the practical version of automated ecommerce reporting. The sheet is still the right answer at $200,000 a year.
Q10. Which levers actually move contribution margin, and when do you kill the SKU? [toc=10. Levers & Thresholds]
Order the levers by time to impact: reprice first, cut return rate second through usage content and sizing, re-engineer packaging and dimensional weight third, raise AOV through bundling fourth, and renegotiate landed cost last. On thresholds, below 10% CM3 you are scaling losses and must intervene within the quarter, 15% to 20% is workable only if retention carries it, and above 25% you can outspend competitors. Kill only after the levers fail, including when you have already paid sample fees.
🎯 The decision table
Bad CM numbers paralyze people because the number does not say what to do. So convert it into a rule and stop deliberating.
CM3 Thresholds and the Decision Each One Forces
CM3 result
What it means
Decision
Negative
Every order deepens the hole
Pause paid traffic on the SKU this week
0% to 10%
Scaling losses
Intervene within the quarter, pull at least two levers
Speed matters more than elegance when cash is leaking. Here is the order, with what each returned on the knife set from earlier.
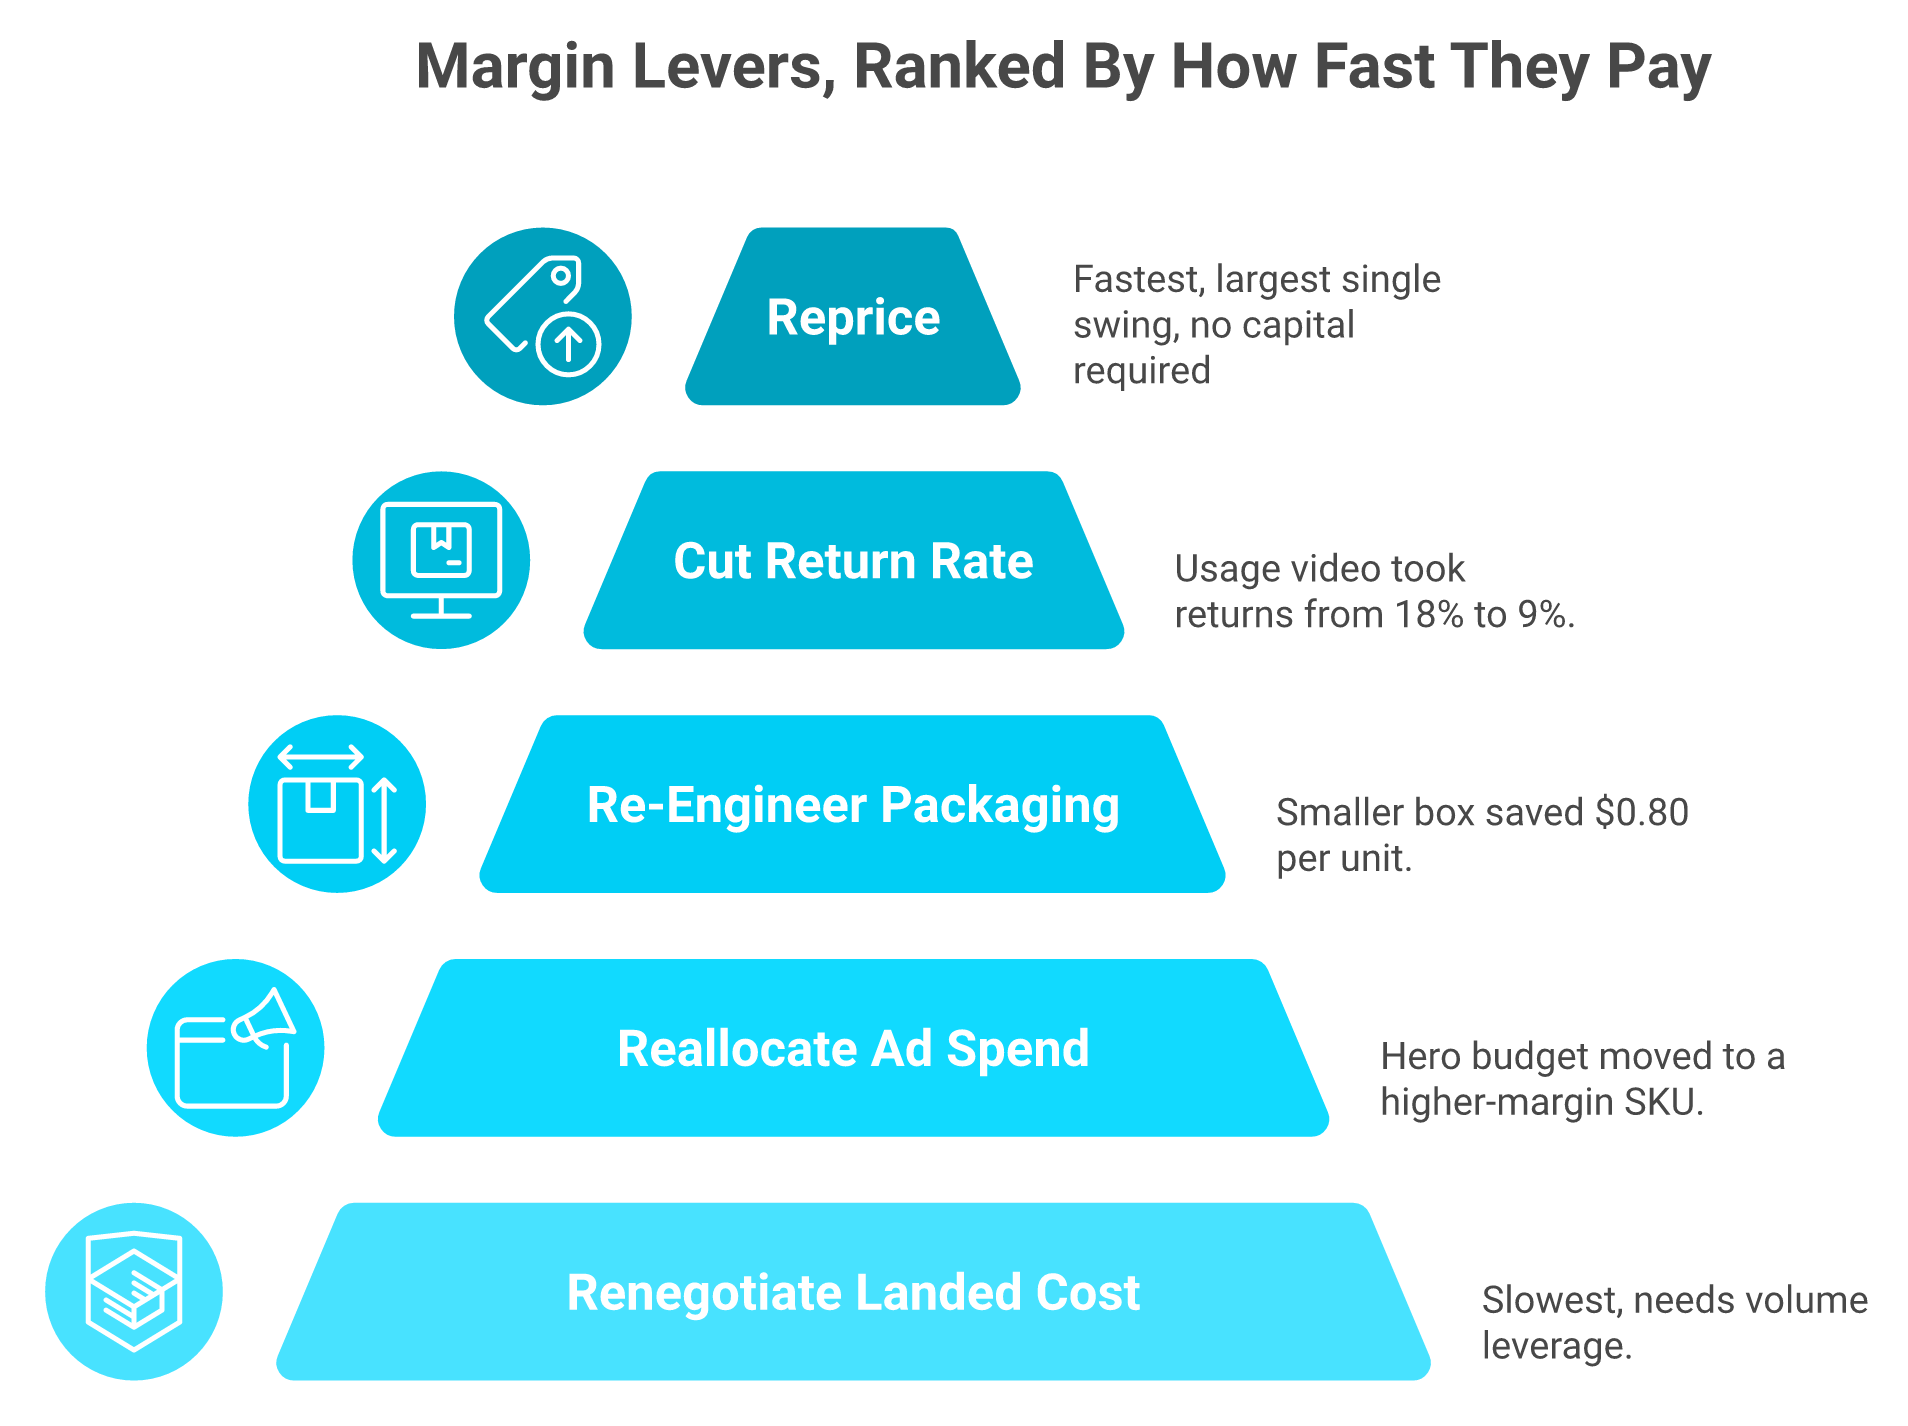
Reprice. $49.99 to $59.99. Instant, no capital required, and the largest single swing.
Cut returns. An instructional usage video took returns from 18% to 9%, which also cut the support allocation.
Re-engineer packaging. A smaller box saved $0.80 per unit on dimensional weight.
Reallocate ad spend. Moving hero budget to a higher-margin cutting board set dropped attributable CAC on the knife set.
Renegotiate landed cost. Slowest, needs volume leverage, and usually requires a new purchase order cycle.
Most founders start at number five, because talking to the factory feels like the real fix. It is the last one that pays. Ranking levers by payback is the unglamorous core of any ecommerce growth strategy.
Repricing pays first and renegotiating the factory pays last, which is the reverse of the order most operators work in.
💰 Decide before you order, not after
The strongest discipline I have seen on this comes from the reverse-engineering formula in Thomson's book: expected retail price minus required profit margin equals your total product and delivery budget. You evaluate supplier quotes, packaging, and fulfillment against that budget before you commit.
A blunter version of the same math also appears there. If a product costs $7 landed, it generally needs to sell above roughly 2.5 times that, around $17.50, just to break even once variable costs load in.
⚠️ Small fee changes break thin-margin stores
This is why thresholds matter more at low margin. One European wine retailer described a 4% payment and transaction cost increase as unaffordable, because card fees and platform commission already consumed the margin.
If your CM3 sits at 12%, a four-point cost shift is a third of your margin. There is no clever campaign that fixes that, and no ecommerce analytics dashboard that makes it look better.
❌ When to stop, sunk cost and all
One seller in Thomson's book put it plainly. Sample fees were paid, the logo was printed, the product was ready, and he still walked away because the numbers did not clear.
That is the discipline. Kill the SKU when two or more levers have been pulled and CM3 still sits under 10%, when the return rate is structural rather than fixable, or when a price increase would push you out of your category's range. Money already spent is not a reason to spend more.
Q11. Why do your dashboards show green while contribution margin goes negative? [toc=11. Why Dashboards Miss It]
Three systems conspire. Blended P&Ls average shipping, return rates, and CAC across the catalog, which hides individual SKUs at severe losses. Ad platform dashboards report self-attributed returns while ignoring fulfillment, processing, returns liability, and support load. Inventory software that never reconciles to bank and card statements accumulates stale component costs and missing freight lines. Luca AI addresses this as an AI layer over the connected data warehouse, resolving a return-rate spike, a support-ticket cluster, and a 3PL fee change into one contribution margin answer rather than three separate charts.
📉 Failure one: the blended average
Averages are not neutral. They actively conceal the thing you are looking for.
Lara Kelly's diagnosis of the knife set was exactly this: blended shipping cost across the catalog looked fine, while that one SKU shipped at three pounds dimensional weight in a fragile box. The store-level number was true and useless at the same time. Per-SKU visibility is what turns profitability analysis into something actionable.
📱 Failure two: self-attributed platform returns
Ad platforms grade their own homework. That is not a scandal, it is just what the tool is built to do.
Most inventory tools are open systems. Anyone can edit a cost field, and nothing forces agreement with your bank feed.
Thomson's work on ecommerce bookkeeping calls this out directly: these systems do not reconcile back to bank and credit card statements, so transcription errors, stale component costs, and missing freight lines accumulate. Three quarters later, your COGS column is fiction.
⚠️ The common root: nothing reasons across the silos
Each tool is locally correct. The founder is left doing the integration by hand, usually at 11pm on a Sunday.
That is the actual job description buried inside most DTC operating weeks. Operators in r/ecommerce threads on profit tracking end up circulating free spreadsheets precisely because no single tool owns the whole picture.
Blended P&L vs Dashboard Analytics vs Luca AI
What you need
Blended P&L
Dashboard analytics
Luca AI
Per-SKU variable cost view
Averaged away
Partial, marketing-weighted
Assembled from connected sources
Root cause of a margin change
Not attempted
Charts you interpret
Named influencing component
Simulation before a change
No
Rarely
Yes, scenario-level
Proactive alert on drift
No
Threshold alerts on channel metrics
Alerts across cost, margin, and inventory
✅ What changed, and the honest limit
The shift is not that AI makes prettier charts. It is that reasoning can now happen across the sources instead of inside each one, which is the premise behind agentic BI.
Luca AI was built against this failure mode, as an AI layer over the data warehouse rather than AI bolted onto a dashboard. It predicts from history, simulates a change before you make it, and names the leaking areas alongside the ones already working. The honest limit: Luca does not fit enterprises with in-house data teams, or stores too early to have data worth reasoning against.
Q12. How often should you review contribution margin, and what should trigger action? [toc=12. Review Cadence & Triggers]
Review blended CM3 weekly as a dollar figure, full SKU-level economics monthly, and landed cost assumptions quarterly or whenever a supplier, carrier, or 3PL reprices. Trigger action on four events: blended CM3 under 15%, any top-ten SKU under 10%, a return rate moving more than three points, or a fulfillment cost line drifting outside its normal range. Luca AI monitors operator-defined thresholds like these continuously and pushes the alert to Slack, email, or in-app with the contributing metric identified.
⏰ The three rhythms
Different numbers rot at different speeds, so they need different cadences.
Contribution Margin Review Cadence and Ownership
Cadence
What you review
Who owns it
Weekly
Blended CM3 in dollars, plus ad spend and return rate
Head of Growth
Monthly
Full per-SKU sheet, all nine cost columns
Founder with finance
Quarterly
Landed cost, carrier rates, 3PL terms, and overhead allocation
Founder or CFO
Weekly in dollars is the one people skip, and it is the cheapest. It takes fifteen minutes and it catches the month you are about to lose. Put it beside your standing top ecommerce KPIs so it never gets dropped.
🚨 The four triggers
A cadence without a trigger is just a meeting. Set these four thresholds and treat them as non-negotiable.
Blended CM3 under 15%. You are one soft month from negative. Freeze incremental spend until you know why.
Any top-ten SKU under 10%. Your revenue concentration is working against you. Pull two levers this quarter.
Return rate moves more than three points. Returns carry shipping, processing, and unresaleable inventory. A three-point move is real money.
A fulfillment cost line drifts. Pick fees, dimensional rates, and storage creep without announcement.
💰 Watch the dollar figure, not the percentage alone
I will keep saying this because it keeps being the thing that fools people. A slow month with low ad spend produces a flattering CM3 percentage and a shrinking contribution dollar total.
Here is the structural flaw in review-based management. A review is a snapshot, and cost drift happens between snapshots.
A carrier reprices in week two. Your 3PL adjusts pick fees mid-month. You find out at the monthly close, six weeks after the margin started leaking. Lara Kelly's advice to update the SKU sheet monthly is right, and it is still a lagging system by design. Forward-looking cover comes from predictive analytics for ecommerce, not from a tidier close.
✅ What to automate, and what to keep human
Automate the watching. Keep the deciding.
Luca AI runs the part of this cadence nobody sustains, which is the monitoring between reviews. Set the four thresholds once, and Luca scans the connected data and pushes the alert with the contributing metric already named, the way an AI data analyst for ecommerce would. The weekly review still happens. It just stops being the first place you find out.
If you run this cadence for one quarter, you will find at least one SKU you were wrong about. Tell me which one it was.
FAQ's
What is ecommerce contribution margin and how do you calculate it?
Ecommerce contribution margin is net revenue minus every cost that scales with an order. Net revenue means gross sales minus discounts, returns, refunds, and chargebacks, so starting from gross sales is the most common early mistake.
The variable cost stack we count is:
Landed COGS including inbound freight, duties, and brokerage
Storage based on how long inventory actually sits
Pick, pack, and fulfillment including packaging materials
Outbound shipping at dimensional weight, netted against shipping revenue
Payment processing and platform or marketplace fees
Allocated returns at the full loss per return, not just the refund
Allocated support based on real ticket share
Attributable ad spend
Divide the result by net revenue for CM percent. What remains covers fixed costs, then profit. On a real $49.99 SKU we walked through, those lines totalled $71.30, leaving a loss of $21.31 per order on a product with a 72 percent gross margin.
Luca AI assembles that same stack from connected Shopify, 3PL, ad platform, and support data, so the per-SKU number exists before you go looking for it. If you want the fuller frame, we set it out in our guide to the best way to track e-commerce unit economics.
What is a good contribution margin for an ecommerce store?
A healthy ecommerce contribution margin sits at 20 to 35 percent of net sales. Strong is 35 to 50 percent. Below 15 percent is a danger zone, because one soft month turns the number negative.
Published data backs those bands. Across 299 DTC brands running $1.01 billion of revenue and $231 million of paid media in Q1 2026, aggregate contribution margin was 29.3 percent at a median 4.23x MER (marketing efficiency ratio, revenue divided by ad spend).
The more useful finding is that media efficiency sorts contribution margin more sharply than category does:
Under 3x MER: 17.7 percent median contribution margin
5x to 8x MER: 39.4 percent
Above 15x MER: 52.8 percent
Vertical still matters because each category has a signature drag. Apparel carries 20 to 30 percent return rates. Food and beverage carries cold chain. Home and furniture carries freight weight and damage.
An average is not your floor, though. Your floor is your monthly fixed costs divided by your net revenue. Luca AI measures contribution margin against your own prior periods rather than an industry average, because your trend tells you more than someone else's median. We keep the wider metric set in our rundown of ecommerce KPIs.
What is the difference between contribution margin and gross margin?
Gross margin subtracts product cost only, so it answers a sourcing question: was this the right supplier at the right price? Contribution margin subtracts every variable cost, including fulfillment, shipping, payment fees, returns, support, and ad spend, so it answers an operating question: is the next order worth taking?
The gap between the two is large and systematic. The median DTC brand runs a 60 to 70 percent gross margin and lands at a 15 to 20 percent true contribution margin. That 40 to 50 point collapse is where stores quietly bleed.
Two quick tests separate them on any screen:
Does the number move when your return rate moves? If not, it is gross margin.
Does it move when your CAC moves? If not, it is at best CM2.
Net profit goes one step further and subtracts fixed costs such as rent, salaries, software, and retainers. It answers whether the business works at this revenue level.
Shopify's gross-profit-by-product report is not contribution margin, and treating it as one is the most common error we see. We compare the two side by side in contribution margin vs gross margin.
Does contribution margin include advertising and customer acquisition cost?
Yes, at the CM3 layer. The tiers work like this:
CM1: net revenue minus landed cost (FOB, freight, duties, brokerage)
CM2: CM1 minus storage, pick and pack, outbound shipping, merchant fees, allocated returns, and allocated support
CM3: CM2 minus attributable customer acquisition cost
CM4: CM3 minus variable overhead such as app subscriptions and agency retainers
Accountants argue that CAC is a marketing expense belonging in operating overhead. Operators counter that if you must spend money to acquire a customer in order to sell that unit, it is a variable cost of that sale. The decision proves the point: the SKU we tore down returned $9.69 per unit at CM2, roughly 19 percent, and negative $21.31 once $31.00 of attributable ad spend was counted.
There are honest exceptions. Repeat and subscription orders, wholesale, and genuinely organic SKUs belong at CM2, with blended CAC tracked at cohort level.
Our rule: CM3 for anything you are deciding whether to advertise, CM2 for anything you are deciding whether to keep making. The same logic drives our view on declining platform ROAS vs true profitability.
How do you calculate contribution margin per SKU in Shopify?
Build one row per SKU with nine cost columns, then pull each figure from the place it actually lives:
Net sales: Analytics, then Reports, then Finances Summary. Not gross sales.
Landed COGS: supplier invoice plus freight, duties, and brokerage. The cost-per-item field excludes inbound freight and duties, which alone can inflate CM1 by 5 to 15 points.
Storage and pick/pack: your 3PL invoice divided by units shipped for that SKU.
Outbound shipping: the Shipping labels export matched to order IDs, netted against shipping revenue.
Payment processing: the Payouts report, which shows real fees after chargebacks and conversion.
Returns and support: allocated by actual return rate and actual ticket share.
CAC: product or campaign level spend, attributed as honestly as you can.
Reconcile every figure against bank and card statements before you trust it, because most inventory systems never reconcile and quietly carry stale costs. Then sort by the final column. The sort is where the surprise lives.
That sheet works at 30 SKUs and breaks at 300. Luca AI keeps the same nine columns current across connected sources and pushes the per-SKU margin report into Slack or email on a schedule, which is what automated ecommerce reporting is for.
Enjoyed the read? Join our team for a quick 15-minute chat — no pitch, just a real conversation on how we’re rethinking Ecommerce with AI - Luca
Loading Schedule...
Your AI Co-Founder is here.
Here’s why:
Shopify, Meta, Xero - one brain.
"Should I scale?" Answered with real data.
Growth capital. No applications. One click.
Thank you! Your submission has been received! Please book a time slot for the Meeting
Oops! Something went wrong while submitting the form.