Ecommerce Data Management: The Architecture That Unifies Product, Customer, Order, and Marketing Data Across Channels
mins read
In this article
TL;DR
Ecommerce data management is reconciliation, making Shopify, Meta, Klaviyo, and accounting tools agree on one number, not storage or dashboards. Five core challenges break data: silos, manual entry, multi-channel complexity, slow time-to-market, and security exposure, each draining real cash. Five streams must agree: product, customer, transactional, behavioral, and inventory, with trip-wires like under 2% duplicate profiles. Most brands break at the unglamorous middle of the lifecycle, normalize and govern, not at the dashboard. At 3 to 5M, you need a warehouse, connectors, and a query layer, not an enterprise PIM or MDM. Data is AI-ready at over 80% identity coverage; start this week by deduplicating before centralizing.
Q1. What is ecommerce data management, really (beyond the textbook definition)? [toc=1. What It Really Means]
A founder doing roughly €3M a year on Shopify told me last month that her Monday started the same way it always does. Open Shopify. Open Meta. Open Klaviyo. Export each into a sheet. Then sit there trying to make three different revenue numbers agree before the team standup. That ritual is the actual problem. The data exists. It just refuses to agree with itself.
Ecommerce data management is the practice of unifying the data your store generates so every tool reports the same number. It is not storage, and it is not dashboards. It is reconciliation: making Shopify, Meta, Klaviyo, and your accounting tool agree on what "revenue" and "customer" mean, so you decide on facts instead of a group chat and a gut feeling before peak season.
🧩 You don't have a storage problem, you have an agreement problem
Most guides define this term as "collecting, organizing, storing, and analyzing your data." That definition is technically right and practically useless. You already store your data. Shopify holds it. Meta holds it. Your 3PL holds it. Storage was never the bottleneck.
The bottleneck is agreement. One operator described his early setup to me, and it stuck: "It was so Excel based, exports from Shopify, exports from the returns system. It makes me shudder now." That shudder is the real subject of this article. The pain is data "scattered across multiple programs requiring manual synthesis" just to see one honest number. If that sounds familiar, our breakdown of why e-commerce founders are drowning in data goes deeper on the root cause.
📊 What "disagreement" actually looks like in your stores
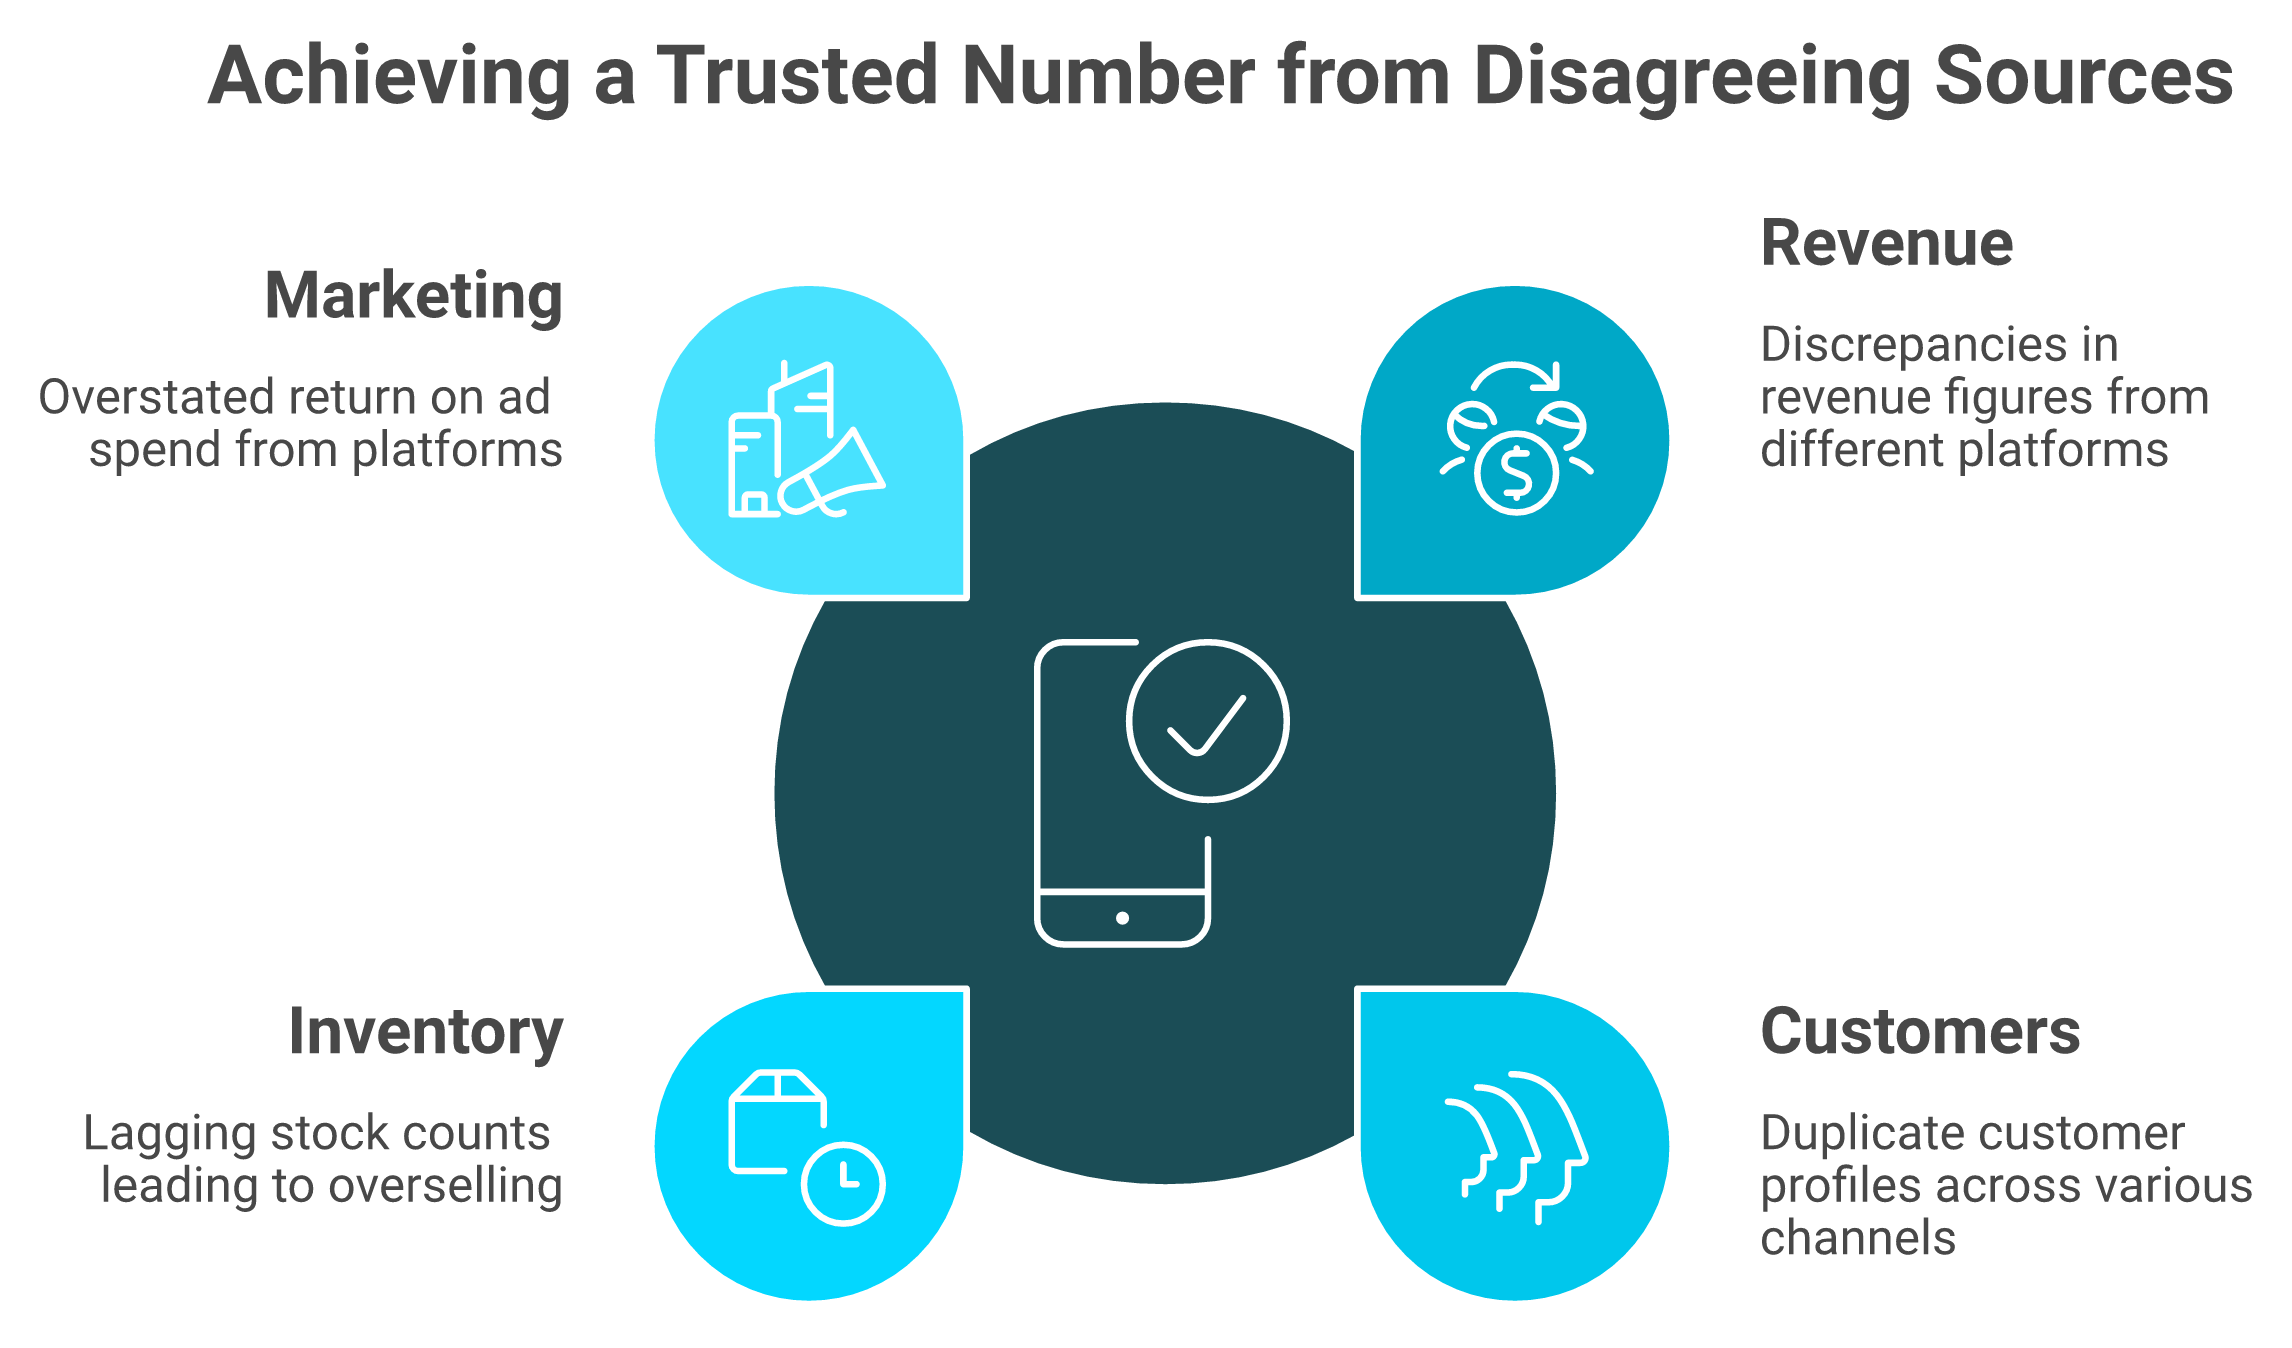
Four sources of data drift apart in predictable ways. Each one quietly distorts a decision you make with real money.
Ecommerce data management is reconciliation: four disagreeing sources resolved into one number every tool reports.
Revenue: Shopify says one figure, Meta claims more, Stripe shows another after fees.
Customers: the same buyer appears three times across email, Shopify, and Amazon.
Inventory: your stock count lags reality, so you oversell during a peak window.
Marketing: platform-reported ROAS overstates what actually drove the sale.
When 83% of shoppers will abandon a site over incomplete or wrong product data, these gaps are not cosmetic. They cost cash. A unified Shopify analytics dashboard is where this reconciliation starts to become visible.
🎯 Why agreement is the whole game
Every downstream decision, what to scale, what to reorder, what to cut, depends on one trustworthy number. If your inputs disagree, your decisions are guesses wearing a spreadsheet costume. Get agreement first, and forecasting, attribution, and cash planning all get easier.
I'll be honest about my read here. The operators who win this are not the ones with the fanciest dashboard. They are the ones who decided that "one number, trusted by everyone" was worth fixing before anything else. We will trace exactly where that agreement breaks, stage by stage, later in this guide. You can also see how data analysis and deep industry research compresses that work.
Q2. What are the 5 core challenges that break ecommerce data (and what they cost you)? [toc=2. The 5 Core Challenges]
A few years back, an operator told me his gross margin looked healthy right up until the day his bank balance said otherwise. He was profitable on the spreadsheet and broke in reality. That gap is where most ecommerce data problems live, and it almost always traces back to the same five failures.
Five challenges break ecommerce data: siloed tools that each see one fragment, manual entry that corrupts quality, multi-channel complexity that multiplies versions of the truth, slow time-to-market from messy catalogs, and security or compliance exposure. The cost is concrete: disagreeing ROAS, profitable-on-paper-but-broke-in-reality cash gaps, and stockouts during peak nobody flagged in time.
⚠️ The five failures, and the money each one drains
Here is the contrarian part. Most founders make decisions on gross margin, and gross margin is a lie. The eight costs sitting between the supplier invoice and your actual profit are where the business quietly bleeds. Silos are the reason you cannot see those eight costs in one place.
Data silos. Each tool sees one fragment. Shopify sees orders, Meta sees ads, and Xero sees cash. Nobody sees the whole, so you triangulate by hand every week.
Manual entry and poor quality. Hand-keyed SKUs and copy-paste exports introduce errors. Feed dirty data into any decision, and the decision is dirty too.
Multi-channel complexity. Sell on Shopify and Amazon, and the "same" customer and product exist in two conflicting versions. Truth multiplies.
Slow time-to-market. Messy catalog data delays launches. With 83% of shoppers abandoning over incomplete product info, every delay and gap is lost revenue.
Security and compliance exposure. Customer and payment data spread across many tools widens your breach surface and your regulatory risk.
💸 The blended-average trap
The most expensive failure hides inside averages. One founder, call her Maya, had no idea her shipping cost was crushing one product, because she looked at blended shipping across all SKUs, not the actual cost for that specific SKU. The blended number looked fine. The real number was bleeding her. Getting this right is the heart of tracking your e-commerce unit economics.
Speed compounds this. A one-second delay in page load can slash conversions by 7%. When your data is slow or wrong, you do not just lose clarity. You lose the buyer mid-checkout. This is also why declining platform ROAS rarely reflects true profitability.
These five challenges are not separate bugs. They are symptoms of one thing: there is no single point where your data is captured, cleaned, and reconciled. There is a lifecycle behind all five, and that is what breaks. We will walk it next. Mapping your e-commerce tech stack first makes the lifecycle easier to fix.
Q3. What are the 5 data streams you must manage (product, customer, transactional, behavioral, inventory)? [toc=3. The 5 Data Streams]
When I sit with operators, the "aha" moment is almost never about a tool. It is about a number they trusted that turned out to be hiding something. One founder put it plainly: "One category did 20,000 in sales this year. Another only did five. A category that crept up had completely masked that we lost a major one." Nobody saw it, because the streams were never reconciled.
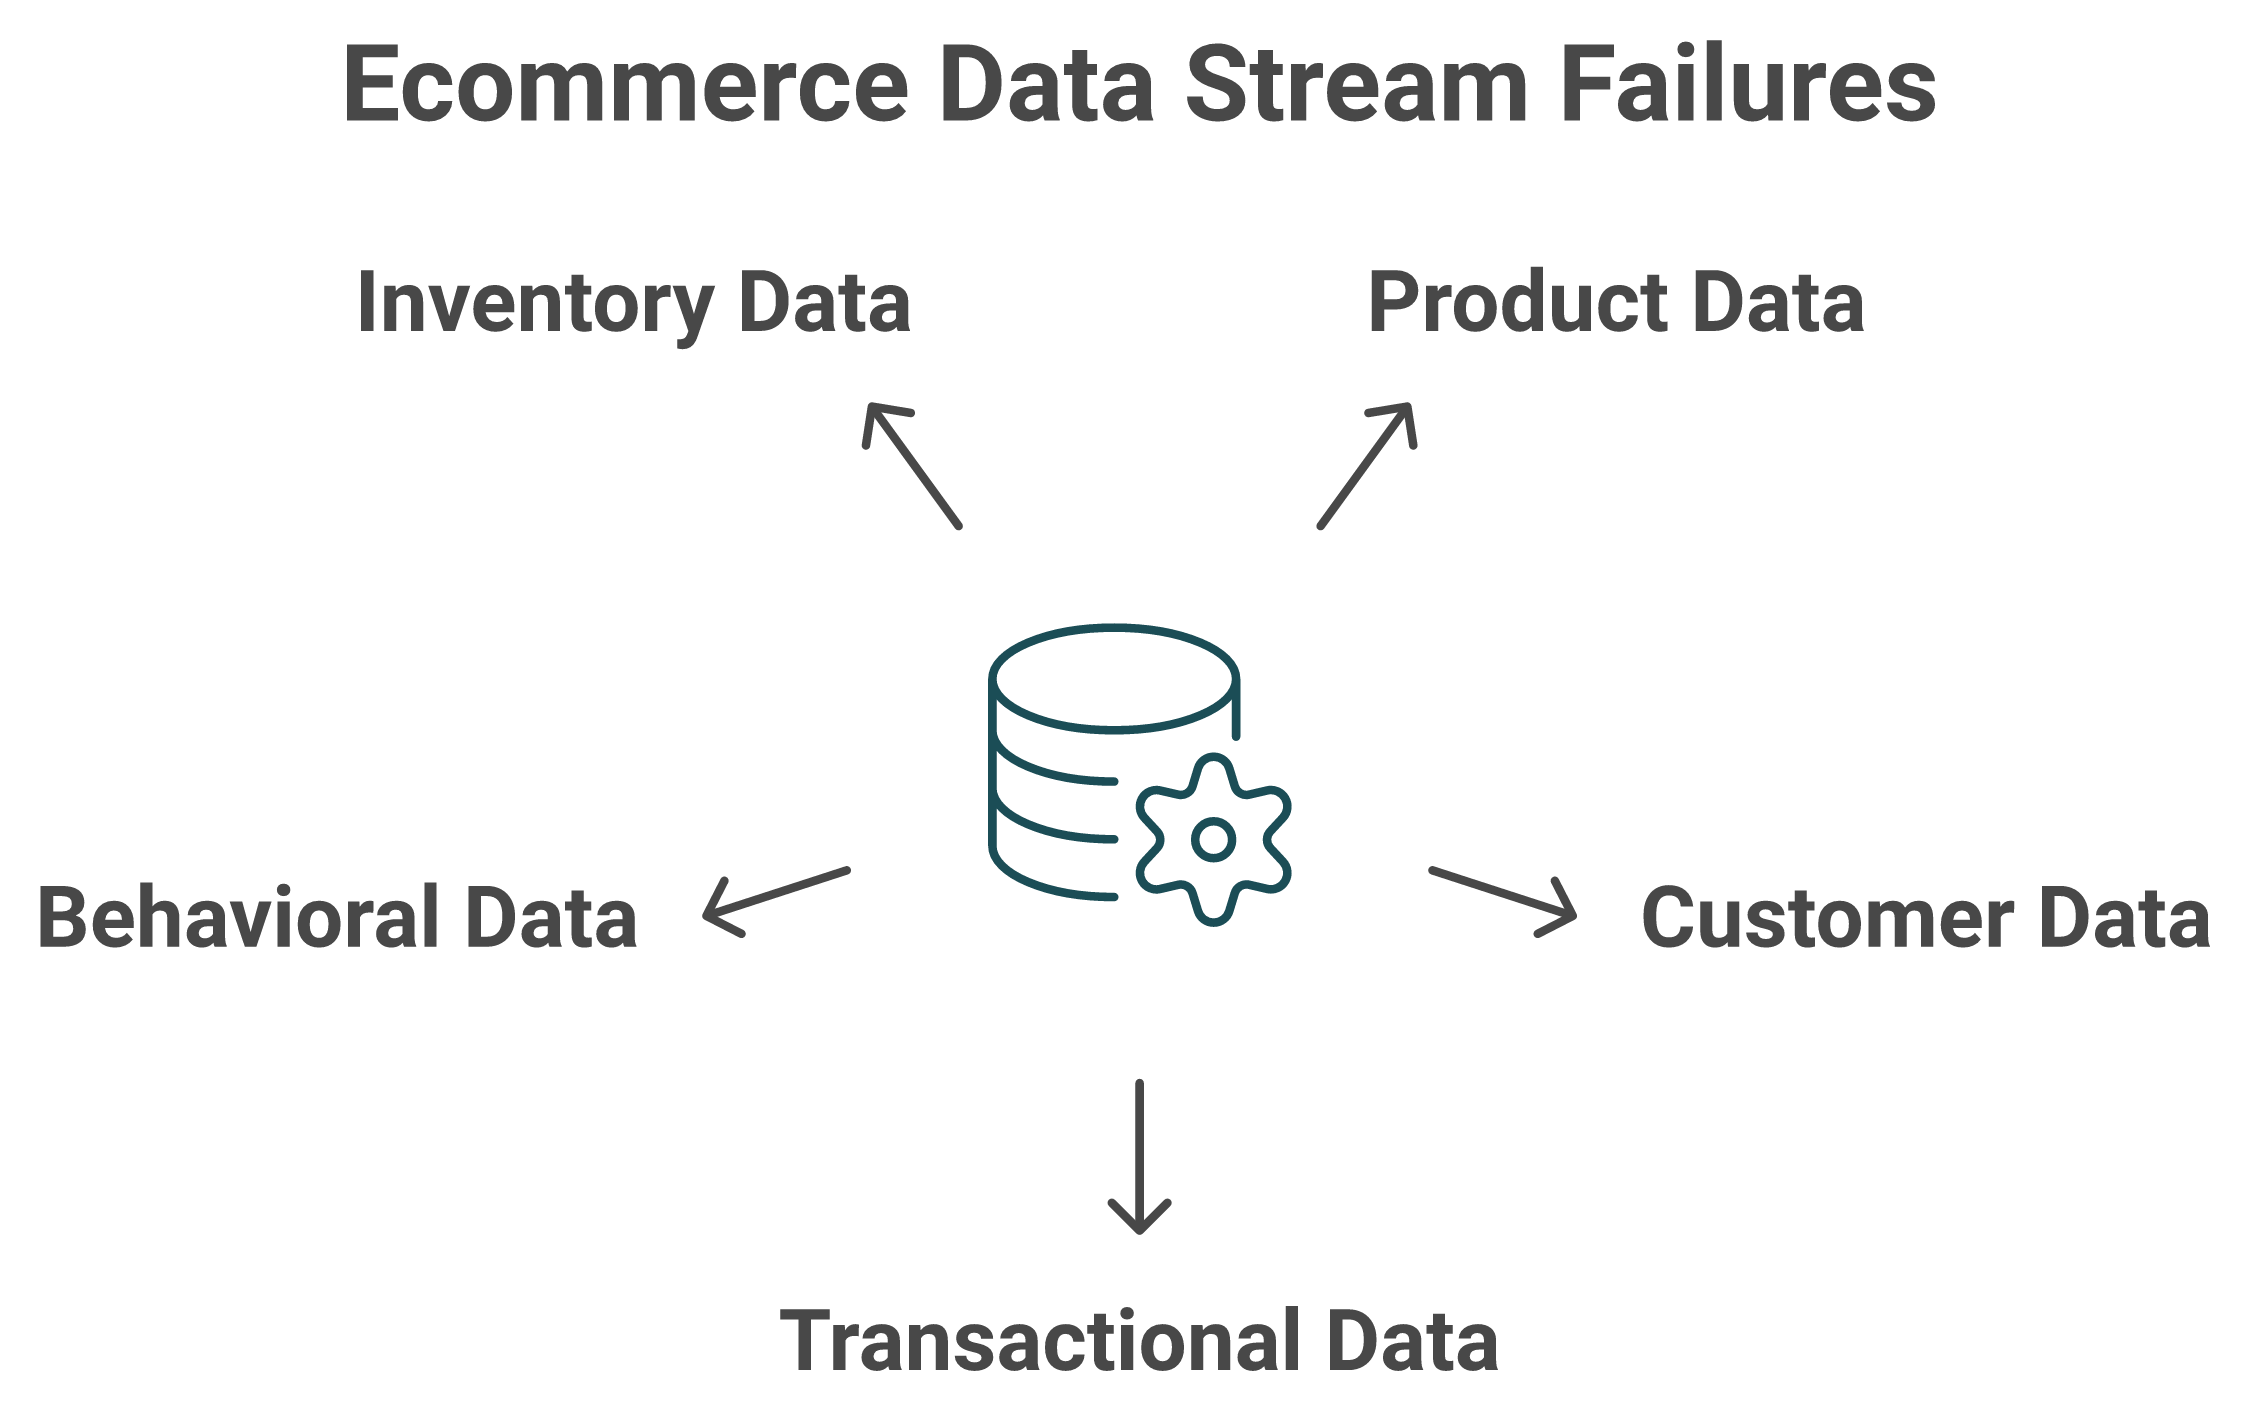
Five streams must agree: product data (SKUs, attributes), customer data (identity, segments), transactional data (orders, payments, returns), behavioral data (sessions, clicks, funnels), and inventory data (stock, fulfillment). Each fails in a signature way: duplicate profiles inflate LTV, inconsistent SKU attributes trigger returns, blended shipping hides true margin, and platform-reported behavior overstates performance.
📋 The five streams, where they break, and your trip-wire
Each stream has a signature failure and a quality threshold that tells you it is drifting. I'll give you the thresholds we use as a working scorecard. They are opinionated, and I could be off by a point or two depending on your stage, but they hold up well below €10M. For the customer side, our guide to ecommerce website analytics covers the behavioral stream in detail.
The five data streams that must agree, each with the signature failure that quietly distorts decisions.
The 5 Ecommerce Data Streams and Their Quality Trip-Wires
Data stream
What it holds
Signature failure
Quality trip-wire
Product
SKUs, titles, attributes, images
Inconsistent attributes trigger returns and listing rejections
SKU attribute gaps above 5%
Customer
Identity, segments, contact, consent
Duplicate profiles inflate your customer count and LTV
Duplicate profiles above 2%
Transactional
Orders, payments, refunds, returns
Blended costs hide which SKU actually loses money
Net margin unknown per SKU
Behavioral
Sessions, clicks, funnels, events
Platform-reported behavior overstates real performance
Conversion source mismatch across tools
Inventory
Stock levels, fulfillment, supplier data
Lagging counts cause peak-season stockouts
Refresh slower than 24 hours
🔍 Why precision in transactional data pays off most
The transactional stream is where the real money hides, because that is where landed cost lives. One operator broke a single shipment down for me: freight ran about $2.40 per unit, duties at 7.5% added roughly $15, and customs brokerage spread to about 30 cents per unit. Those numbers never show up in a blended margin report. Strong sales performance tracking surfaces exactly these gaps.
Get specific per SKU, and the picture changes. The product you thought was your hero may be your worst-margin line once true landed cost lands. Tight product management keeps the product stream clean before it ever reaches your reports.
When any one stream breaches its trip-wire, the cost is not abstract. It is a stockout in week one of peak, a refund spike from bad attributes, or an ad budget poured into a product that loses money on every order.
Q4. What does the ecommerce data lifecycle look like, and where do most brands break? [toc=4. The Data Lifecycle]
Here is a take the category mostly avoids. Buying a fancier dashboard does not fix your data, because the break almost never happens at the dashboard. It happens two or three stages upstream, in the plumbing nobody wants to look at. I watched a brand spend six figures migrating from Klaviyo to Bloomreach, "a really expensive and difficult migration," purely to get a single point of truth around the customer. The lesson was about the middle of the lifecycle, not the front end.
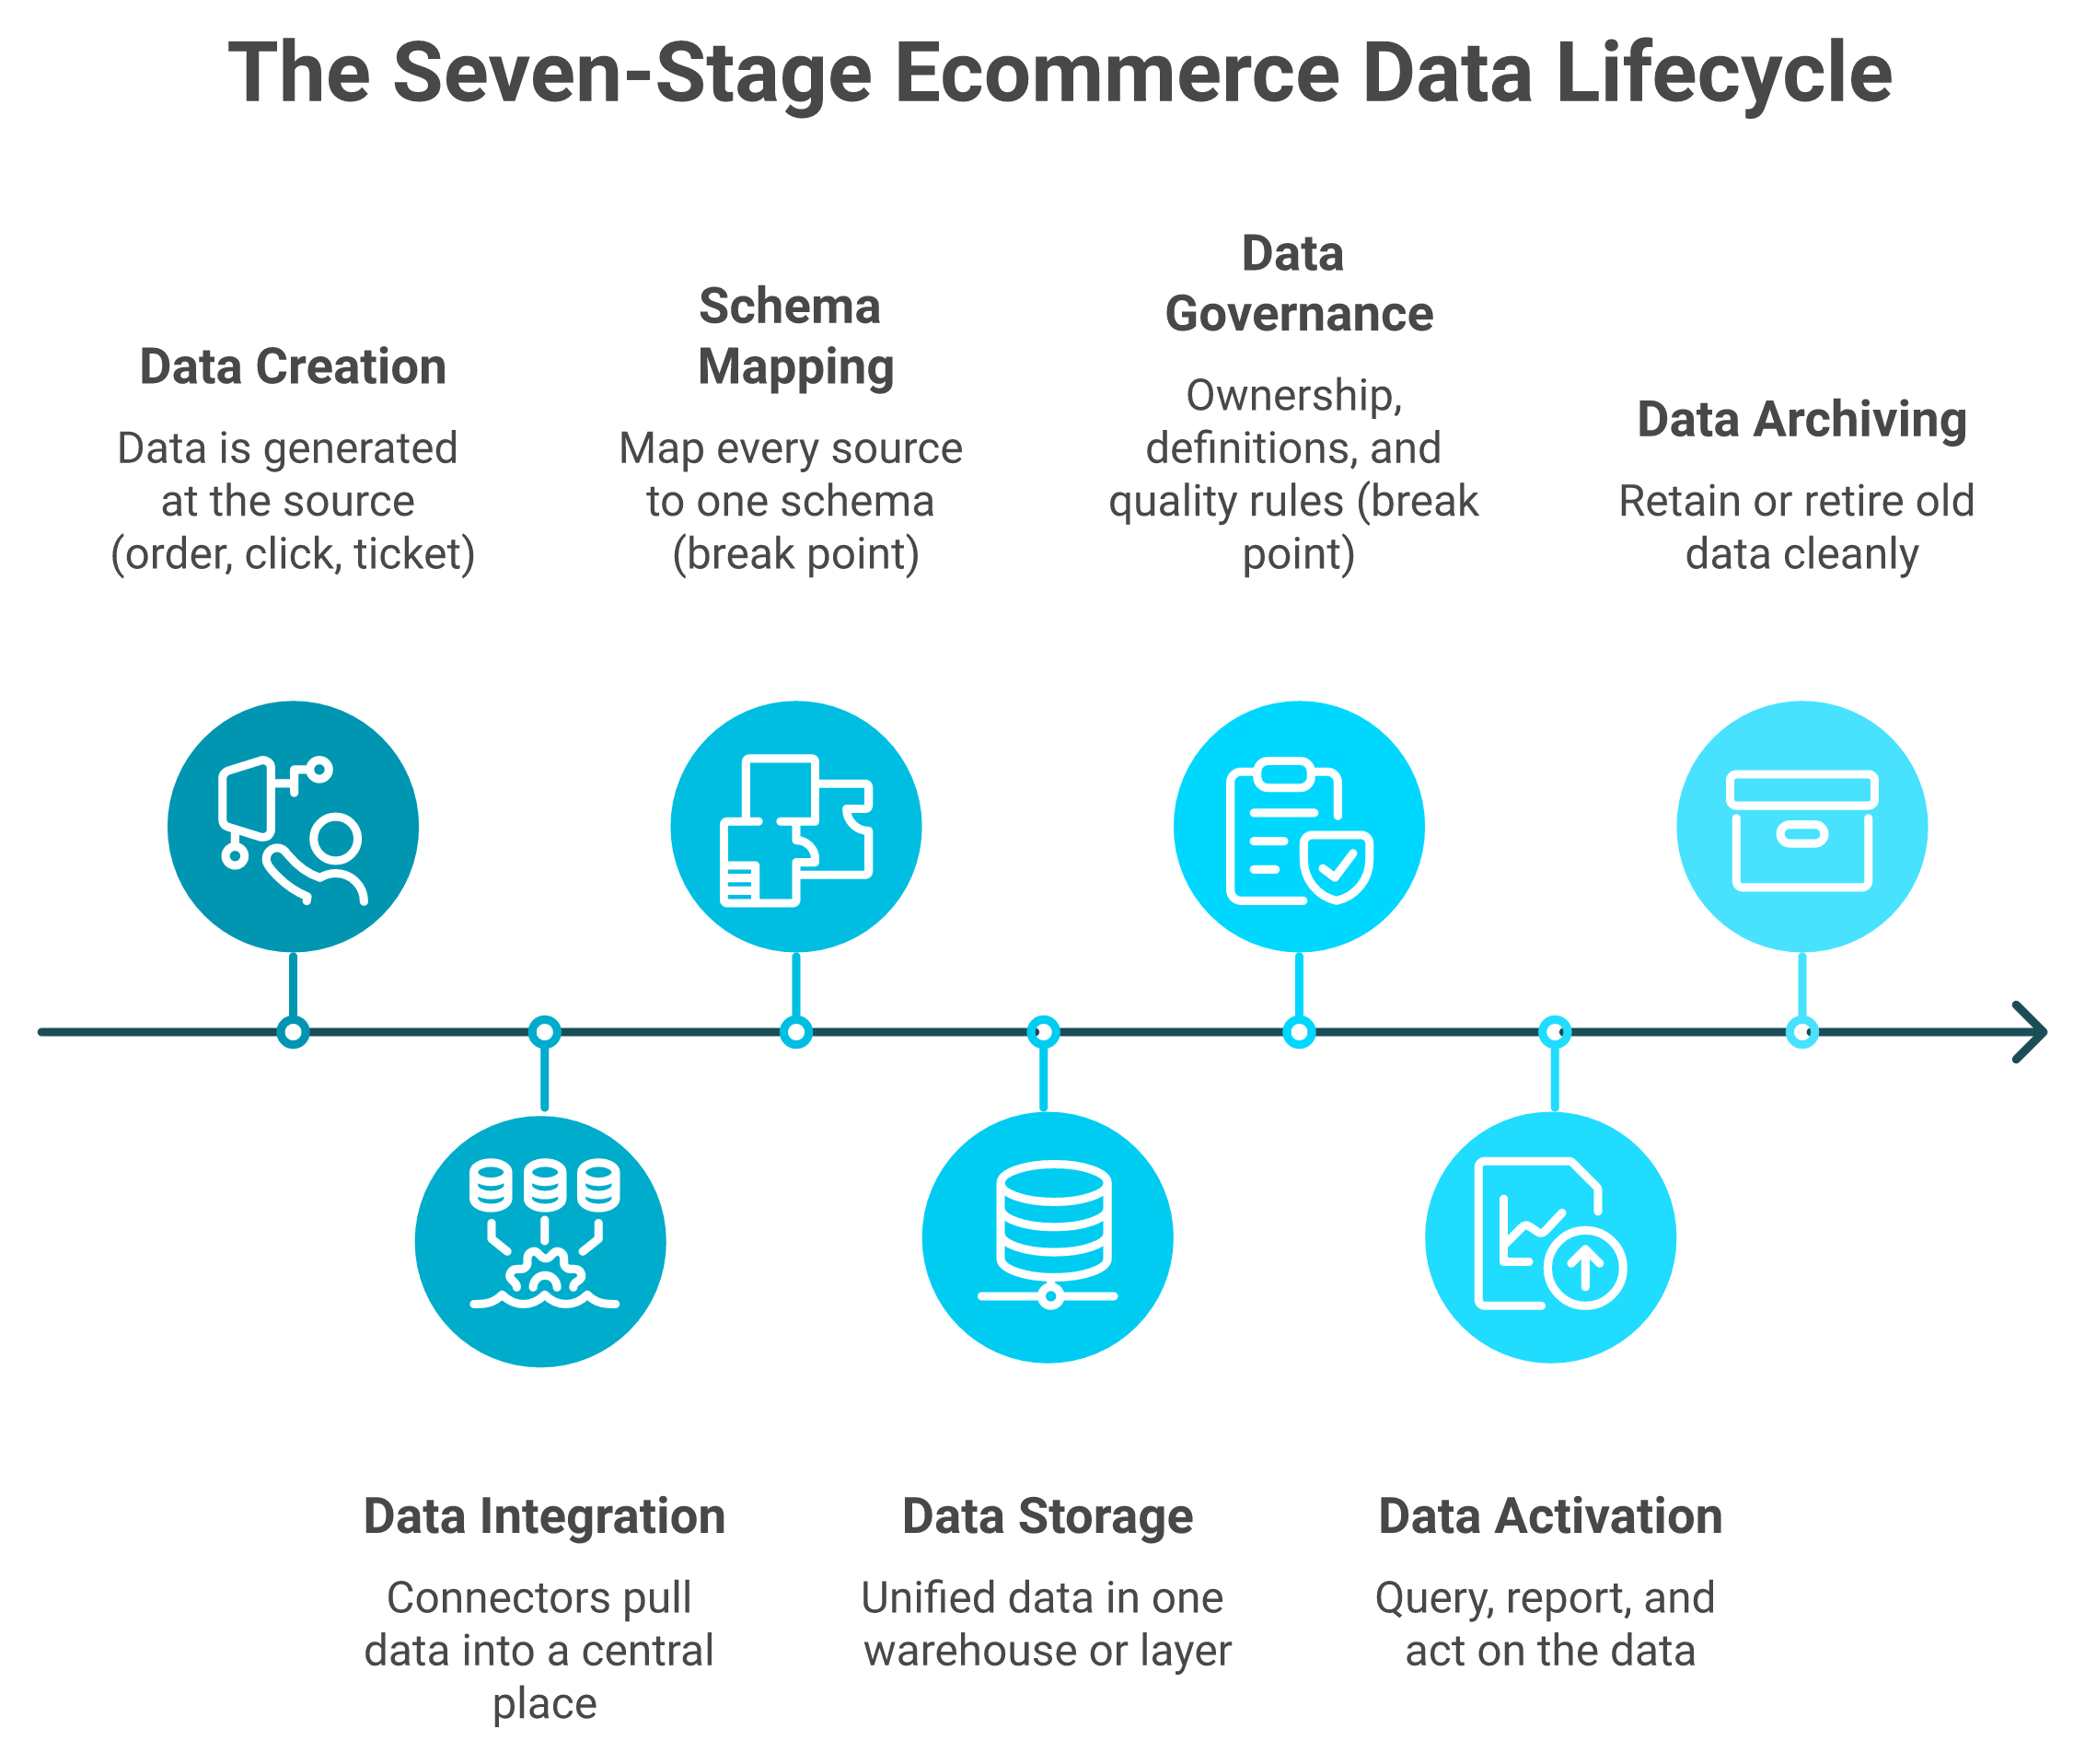
The lifecycle runs in seven stages: capture, ingest, normalize, store, govern, activate, and archive. Most brands break at normalize and govern, the unglamorous middle, where Shopify, Amazon, and Meta data is piped into one layer, customer identities are deduplicated, and everything is mapped to a common schema. Get the middle right, and one number becomes trustworthy.
🔄 The seven stages, and the two where brands break
Walk it once, and the break points become obvious.
The seven-stage data lifecycle: most brands break at normalize and govern, the unglamorous middle.
Capture. Data is created at the source (order placed, ad clicked, ticket opened).
Ingest. It flows out of each tool through connectors into a central place.
Normalize. Every source is mapped to one schema, so "revenue" means one thing. Most brands break here.
Store. The unified data sits in one warehouse or layer.
Govern. Ownership, definitions, and quality rules are set. Most brands break here too.
Activate. You query, report, and act on the data.
Archive. Old data is retained or retired cleanly.
Stages three and five are unglamorous, so they get skipped. That skip is the entire problem. A unified ecommerce management software approach closes those two gaps first.
🏗️ The architecture underneath a single source of truth
A working setup is simpler than vendors make it sound. Automated connectors pull from Shopify, Amazon, Meta, Klaviyo, and your accounting tool. An identity-resolution step deduplicates customers first (this is the step everyone skips). Everything is normalized to a common schema, then sits in one queryable layer. The right ecommerce analytics platforms handle this layer for you.
The durable principle: own the data, rent the intelligence. One team built a $10M proprietary algorithmic engine, and when LLMs arrived, they were "10 times better" than what was built, rendering the in-house system obsolete overnight. Own the data you control. Rent the intelligence that keeps improving.
🤖 Standardization beats sophistication
The unglamorous truth is that AI only works on a clean, standardized dataset. As one operator put it, the only way agentic tools work "is if there's a decent data set, standardized as much as possible." This is exactly the layer Luca is built for. As an AI layer over your data warehouse, Luca normalizes and standardizes your sources on ingestion, so you skip the data-cleanup year and ask questions of clean data in plain English instead of wrestling exports.
That is where most operators are losing time right now. Not in capture. In the messy, standardizing middle nobody wants to own.
Q5. Do you need a PIM, a CDP, a warehouse, or an MDM, and when? [toc=5. PIM vs CDP vs Warehouse vs MDM]
A founder doing about €4M on Shopify asked me last quarter whether he needed an MDM. A vendor had quoted him six figures for one. He runs roughly 50 SKUs on two channels. He did not need an MDM. He needed to stop being sold one.
At €3-5M on Shopify with around 50 SKUs, you most likely need a cloud warehouse plus automated connectors plus a query layer, not an enterprise PIM or MDM. A PIM (product information management tool) earns its keep with heavy SKU counts and multichannel catalogs. An MDM (master data management system) only past €20M or five-plus channels. Match the tool to the stage, not the hype.
🧭 The four categories, side by side
Here is the honest breakdown, with the "skip if" column most vendor pages leave out. Mapping these against your e-commerce tech stack keeps the decision grounded.
PIM vs CDP vs Warehouse vs MDM by Stage
Tool
What it does
Adopt when
Skip if
Rough cost/yr
PIM
Centralizes product/catalog data
1,000+ SKUs, 4+ sales channels
Under ~200 SKUs on 1-2 channels
€5K-€40K
CDP
Unifies customer profiles, segments
Heavy retention, many touchpoints
Email/SMS handled in one tool
€15K-€60K
Warehouse
One queryable store for all data
You need a single source of truth
Still on spreadsheets under €1M
€3K-€20K
MDM
Governs master records enterprise-wide
€20M+, 5+ channels, multiple teams
You are a single-brand operator
€50K+
The market pressure is real. The PIM category alone is projected to grow from $15.62B in 2024 toward $31.98B by 2029, about a 15.4% compound annual growth rate. Growth that fast means a lot of sales reps need you to buy.
⚠️ The over-engineering trap
A bigger system is not a better system. One operator described his expensive "business in a box" setup bluntly: it "took about 45 minutes to find one document," and searching it was "quite painful." That is what premature infrastructure feels like. The right ecommerce management software should reduce friction, not add it.
Think of it like vessels. A billion-dollar company is a cargo ship, slow and heavy by design. A sub-€10M brand is a jet ski, agile and fast. Bolting cargo-ship infrastructure onto a jet ski just makes it sink.
💰 What to buy at each stage
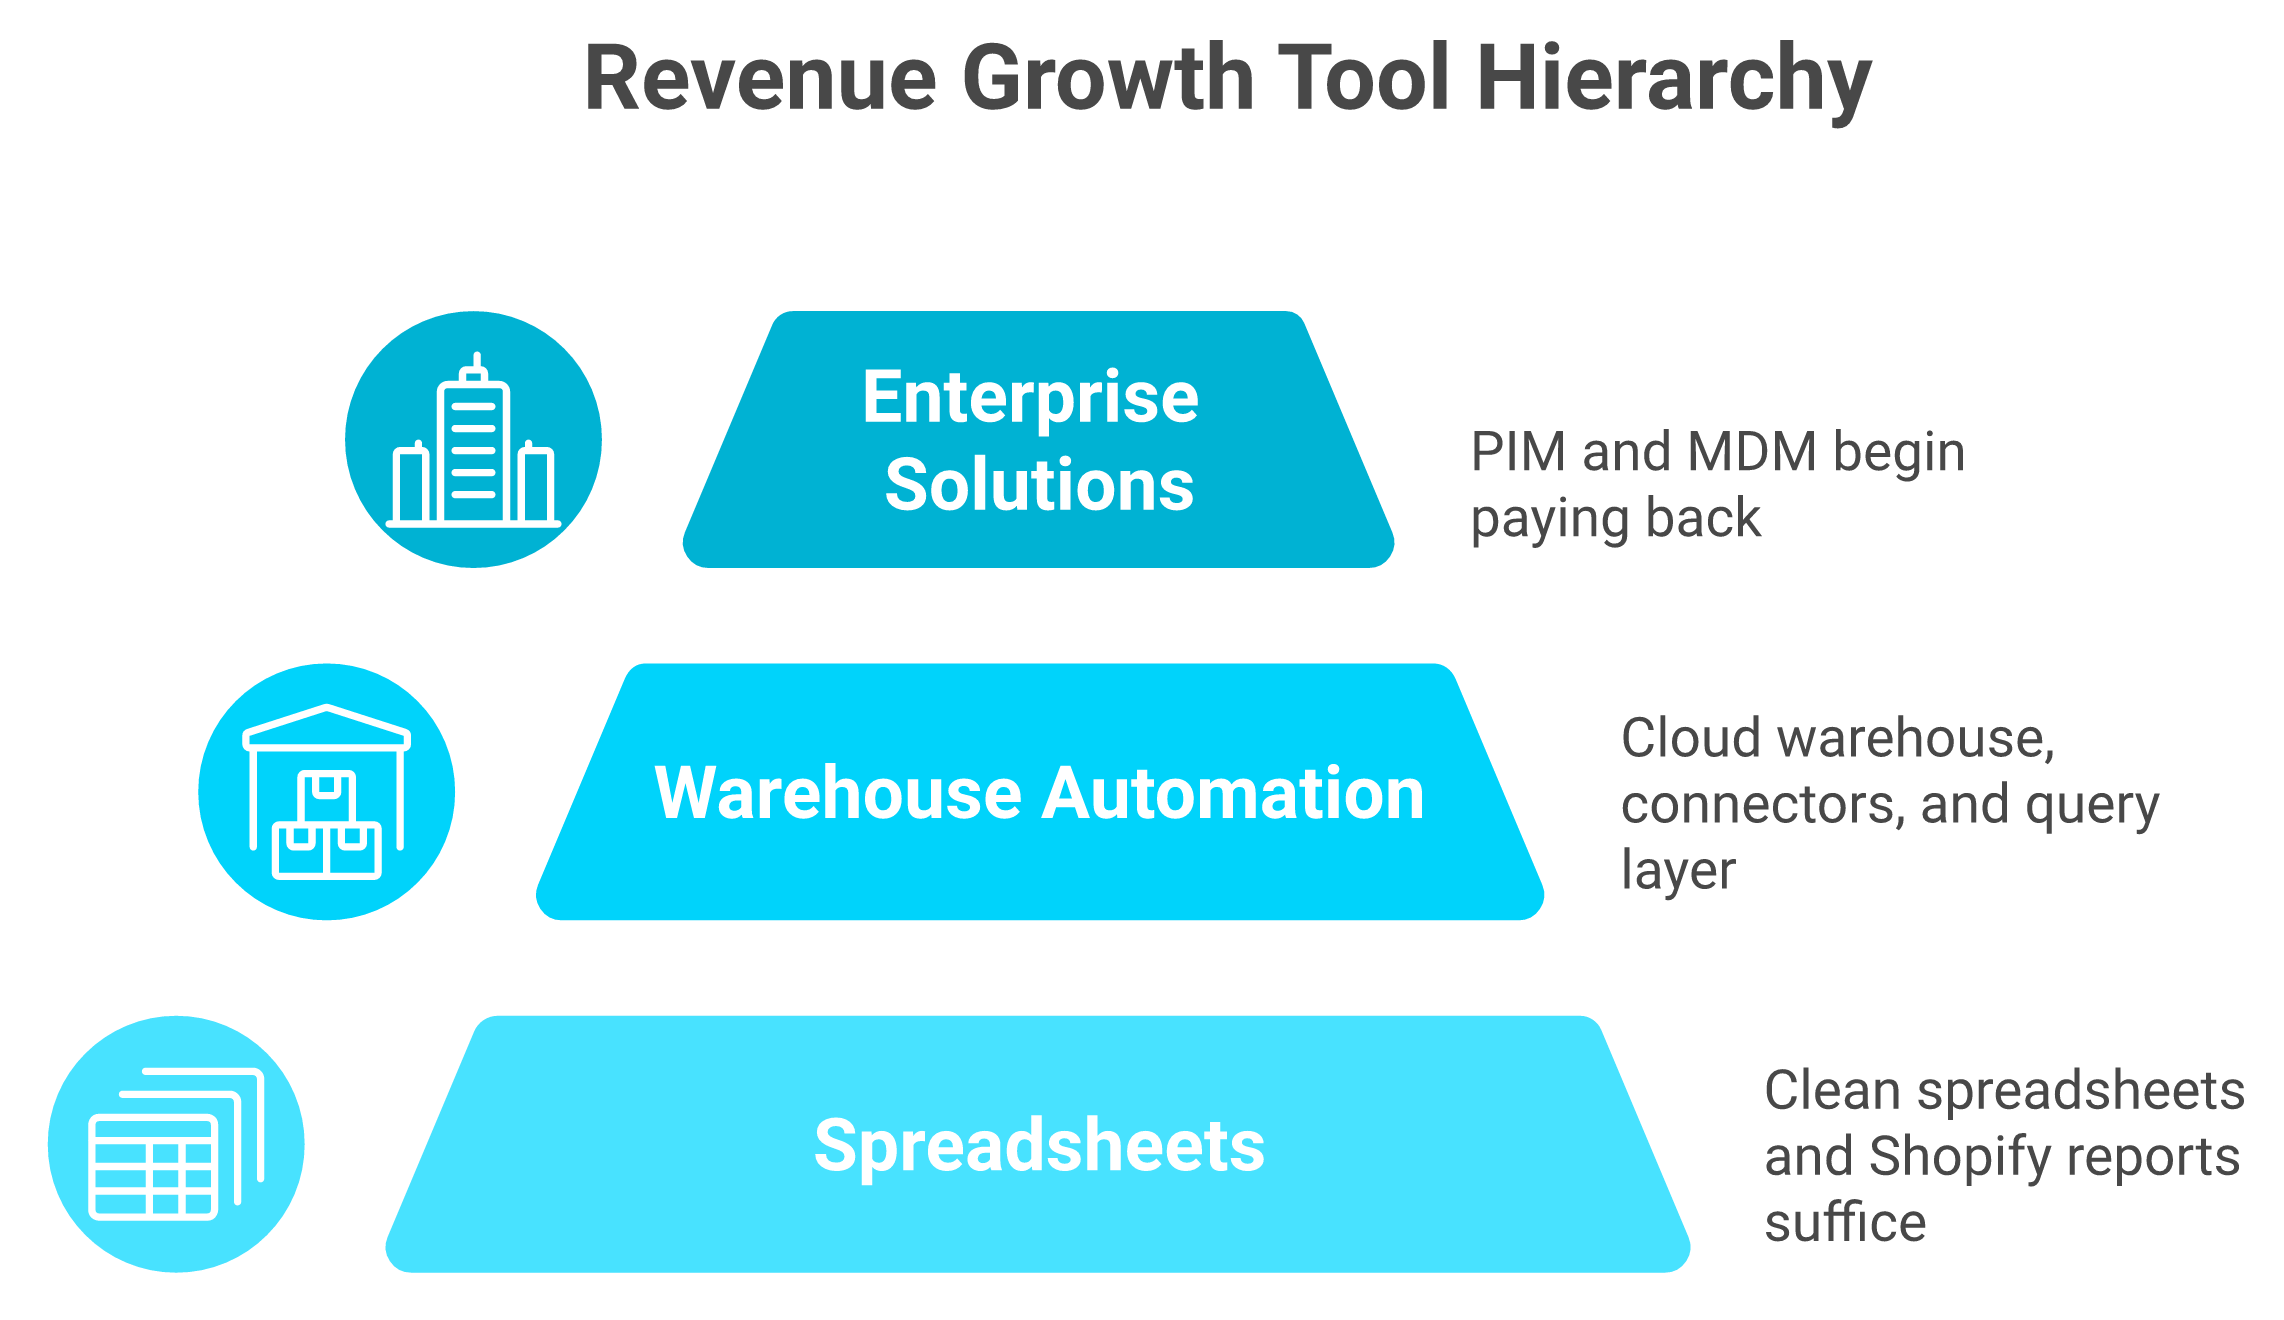
Match the tool to the stage: spreadsheets, then a warehouse and connectors, and only later a PIM or MDM.
Under €1M: skip all four. Clean spreadsheets and Shopify reports are enough.
€3-5M (most readers): a warehouse, automated connectors, and a query layer. That is it.
€20M+ or 5+ channels: now PIM and MDM start to pay back.
"We worked with Clearco for a couple of years... Despite no change in our cash position or risk profile, we started facing stricter demands that made little sense." Melissa Clearco Trustpilot Verified Review
That review is about financing, not tooling, but the lesson transfers: a vendor's incentives are not your stage. Luca sits in a different lane than these four categories. It is not a PIM (a catalog system) or a lender. It is the AI query and intelligence layer that sits over your unified data and reasons across it in plain English, doing the work you would otherwise hire a junior analyst for. For a closer look, compare the ecommerce analytics platforms in this space.
Q6. How do you turn unified data into decisions you can act on by Monday? [toc=6. From Data to Decisions]
Most dashboards get built to show off, not to decide. I'll say the quiet part out loud: a lot of teams build dashboards for technical showmanship. Dashboards were meant to pull out the decisions normal people cannot get from raw data, not to impress a board with chart density.
Once data agrees, replace the Monday Excel export with standing questions: surface why ROAS dipped, recalculate true CAC including fulfillment, simulate a price change, and find which SKUs are quietly carrying the business. The payoff is cohort-level vigilance without building a cohort-level dashboard, and answers in five minutes that used to take two days.
⏰ Five questions that turn data into money
Here are the five workflows I would set up first, ranked by payoff. Each ladders straight to cash, not vanity. Strong marketing analysis and automation sits behind most of them.
Root-cause a ROAS dip. Ask why return on ad spend fell, across channels, in one query instead of five tabs.
Recalculate true CAC. Customer acquisition cost including fulfillment and fees, not the platform's flattering version.
Simulate a price change. Model a 10% price move against margin before you touch the store.
Find your hidden carriers. Surface which SKUs quietly drive profit, and which masked SKUs are dying.
Schedule the report. Push a weekly CAC report with charts and reasoning to Slack or email automatically.
⚡ Why speed here is the actual edge
One operator told me he now calculates net profit for a South Africa delivery in five minutes. Before, he needed an expert and waited two days for an email. That is the shift: from data assembly to decision-making. Tighter financial management is the direct payoff.
This is exactly where Luca earns its keep. As an AI layer over your data warehouse, Luca extracts the relevant data for a specific question, predicts from your history, simulates scenarios, finds the root cause, and flags the influencing components behind an outlier. It then pushes customized reports to Slack or email on whatever schedule you set, scanning 24/7, so you do not have to. This is what agentic AI for ecommerce founders looks like in practice.
"Triple Whale has been instrumental... but the data discrepancies between it and the ad platforms can be frustrating to reconcile." Verified User Triple Whale G2 Verified Review
I could be wrong on the exact ranking for your store. But the principle holds: stop assembling data on Monday morning, and start asking it questions instead.
Q7. How do you know your data is AI-ready (the maturity model)? [toc=7. The AI-Readiness Maturity Model]
Plenty of founders bolt AI onto a dirty dataset and then blame the AI. One operator nailed why the output disappoints: "We're prompting it on horrendous data sets... it's no wonder it comes out with stuff that isn't quite right. Pure laziness." The model was fine. The data was not.
Data is AI-ready when you have a unified layer, semantic labeling (tagging data so machines know what each field means), and over 80% customer identity coverage. Most brands sit at stage two: centralized but still dirty. The climb runs spreadsheets, then connected dashboards, then a unified warehouse, then an AI-ready single source of truth. You cannot skip stages, because feeding AI uncleaned data produces confidently wrong answers.
A late-2025 survey of 402 Shopify Plus brands found most could not answer a cross-functional question in under five minutes without a human analyst. That is the AI-readiness gap in one stat.
🤖 The real trip-wire: identity coverage
You are AI-ready when over 80% of your customers resolve to a single identity and your fields are labeled clearly. Below that, AI guesses. One brand abandoned its inventory system's native AI forecasting after about six months because it was unreliable, then just extracted the data into a general AI tool instead. The best AI tools for Shopify owners avoid this trap by cleaning data first.
This is the layer Luca is built to remove friction from. It normalizes and standardizes your data on ingestion, so you skip the cleanup year and reach AI-readiness without rebuilding your stack by hand. Plug in, then ask.
"Setup took some effort to get our data sources mapped correctly, but once done the insights were genuinely useful." Verified User Triple Whale G2 Verified Review
My read right now is that most brands are stuck at stage two and think they are at stage four. Score yourself honestly before you trust a single AI answer.
Q8. How do you govern and secure ecommerce data at SMB scale (without enterprise overhead)? [toc=8. Governance & Compliance]
Governance is where most small brands freeze. They picture a 50-page enterprise policy, decide they do not have time, and do nothing. That is the wrong reaction. A one-page document beats a perfect framework nobody writes.
An SMB does not need a DAMA framework (the enterprise standard for data management). You need a one-page data dictionary, a simple RACI for who owns each source, tiered refresh SLAs, and the compliance non-negotiables: GDPR consent handling, PCI for payment data, and encryption. Governance here means consistency and trust, not bureaucracy that nobody reads.
📋 The SMB governance starter kit
Three artifacts cover 90% of what you need. None takes more than an afternoon. Consistent data analysis and deep industry research depends on these basics being in place.
Data dictionary. One page defining each key metric, so "revenue" means the same thing to marketing and finance.
RACI. A short list of who owns, maintains, and can change each data source (Shopify, Meta, and Klaviyo).
Refresh SLAs. Tiered rules for how fresh each dataset must be (inventory hourly, finance daily).
🔒 The compliance floor you cannot skip
Three things are non-negotiable, whatever your size. GDPR governs how you collect and store EU customer consent. PCI DSS (Payment Card Industry Data Security Standard) governs how you handle card data. And encryption protects data both at rest and in transit.
There is a governance angle people miss: concentration risk. As one operator put it, any brand over-reliant on a single platform is "sitting on a single point of failure." Spreading your data and your channels is a form of risk management, not just marketing.
For ecommerce specifically, governance also means knowing where your customer data lives across every connected tool. When Luca connects your sources into one layer, that map gets clearer, because consistent definitions live in one place instead of scattered across eight logins. Lightweight always beats nothing here. You can review how we handle this in our privacy policy.
Q9. Build vs buy: should you wire this stack yourself or use an AI layer over your data? [toc=9. Build vs Buy]
Here is the take the category avoids. Building your own data stack is rarely the flex founders think it is. I watched a brand proudly wire its own warehouse, then spend every Monday reconciling it by hand. They built a second job, not a single source of truth.
Building it yourself means a warehouse, connectors, an identity-resolution job (matching duplicate customer records into one), and 8-12 hours a week reconciling, with a real data hire eventually. Buying an AI layer over your warehouse means asking questions in plain English, getting root-cause and forecasts in seconds, and scheduled reports pushed to Slack. DIY wins only if you already have a data team. For a fuller view, compare the ecommerce analytics platforms available today.
⚖️ The honest trade-off, side by side
I will not pretend buying always wins. It does not. Here is the real comparison, and it mirrors how we frame the broader e-commerce tech stack decision.
DIY Warehouse Stack vs an AI Layer Over Your Data
Factor
DIY warehouse stack
AI layer over your data
Data consistency
You build and maintain it
Normalized on ingestion
Query effort
SQL, or wait for an analyst
Plain English, seconds
Time cost
8-12 hrs/week reconciling
Near zero after setup
Proactive reporting
You build every alert
Scheduled, auto-pushed
Best for
Teams with a data hire
Lean operators under €10M
🚂 The two train tracks problem
Think of your business as two train tracks. One rail is inventory. The other is cash. They have to run in parallel, because the moment they diverge, you derail. Keeping both visible is the core of solid financial management.
A DIY stack usually watches one rail well and the other badly. That gap is where brands run profitable and broke at the same time. One operator told me they cut from ten developers to two by buying intelligence instead of building it, calling it a huge unlock for profitability. This is the heart of the intelligence capital thesis.
✅ Where Luca fits, and where it does not
This is the natural home for Luca. As an AI layer over your data warehouse, Luca extracts the data behind a question, predicts from history, simulates scenarios, finds root cause, surfaces the influencing factors, and pushes scheduled reports to Slack or email. It replaces the junior analyst you would otherwise hire to babysit a DIY build. That is what agentic AI for ecommerce founders delivers in practice.
The drawback of analytics-only tools is accuracy and reasoning, not features. Faulty attribution data costs real money, as one documented case showed a brand $70K in hidden revenue until they switched to source-of-truth tools. If you are weighing options, our roundup of Triple Whale alternatives goes deeper.
"Triple Whale's attribution delivers wrong data, and support ignores tracking problems and doesn't address underlying attribution issues." Verified User Triple Whale G2 Verified Review
"A great software to use to build custom reports, see all analytics from multiple sources in one place, and track ecommerce performance WoW, MoM, and YoY." Verified User Polar Analytics G2 Verified Review
Buy if you are lean and want answers. Build only if you already have the team to maintain it.
Q10. Where do you start this week (the starting sequence)? [toc=10. Your Starting Sequence]
Most founders try to boil the ocean. They map a 12-month data platform and stall in week one. The win this week is smaller and far more useful: one number you actually trust.
Start in order: audit which tool owns which number, deduplicate customer identities first, centralize sources into one layer, set three standing alerts (ROAS, inventory, and CAC), then score yourself against the quality thresholds. Skip PIM and MDM for now. The goal this week is one trustworthy number, not a finished data platform.
🗺️ The five moves, in order
Sequence matters here. Dedupe before you centralize, centralize before you tool, and tool before you bolt on AI. Stronger marketing analysis and automation follows naturally once the order is right.
Audit ownership. Write down which tool owns which number, so you stop arguing about whose revenue figure is right.
Deduplicate identities. Merge duplicate customer profiles first, because everything downstream inherits this error.
Centralize sources. Pipe your tools into one layer, so "revenue" finally means one thing.
Set three alerts. ROAS dips, inventory below threshold, and CAC spikes. Let the data ping you.
Self-score. Check yourself against the thresholds (under 2% duplicates, under 5% SKU gaps, and sub-24-hour refresh).
🔭 Why a unified view beats a zoomed-in metric
There is a reason order matters. When you stare at one metric, you miss the painting. It is like studying a Van Gogh through a magnifier fixed on one square inch. You see texture, but you miss the whole canvas. A unified Shopify analytics dashboard restores the full view.
This pays off in ways you cannot predict. One brand ran five cohort analyses and found product category diversity, not purchase frequency, was its number-one driver of customer lifetime value, with body-care purchases lifting LTV 50 to 100%. They rebuilt their entire back-end marketing around that one unified insight, the kind that improves how you track e-commerce unit economics.
💬 What I am sitting with
Luca can collapse moves three through five into one layer over your warehouse, so centralizing, alerting, and self-scoring happen in a single chat instead of a quarter-long project. That is the part I would hand off first. You can see the full picture in our overview of what an AI co-founder for e-commerce actually does.
Here is the question I keep turning over for the next 18 months. As AI gets cheaper, the moat stops being the model and becomes the cleanliness of your data. So what is the one number in your store you still cannot trust today? Tell me what it is, and I will tell you where it is probably breaking.
FAQ's
What is ecommerce data management and why does it matter?
We define ecommerce data management as the practice of unifying every data stream your store generates so that each tool reports the same number. It is not storage, and it is not dashboards. It is reconciliation.
The real problem is rarely where founders think. You already store your data in Shopify, Meta, and your 3PL. The bottleneck is agreement, getting those sources to define "revenue" and "customer" identically.
It matters because every downstream decision depends on one trustworthy number:
Scaling ad spend on a ROAS figure that disagrees across tools wastes cash.
Reordering on a lagging inventory count causes peak-season stockouts.
Blended margins hide which SKU is actually losing money on every order.
When your inputs disagree, your decisions become guesses wearing a spreadsheet costume. We built Luca as an AI layer over your warehouse precisely to remove that friction, so you ask questions in plain English instead of reconciling exports every Monday. Our breakdown of why founders drown in data goes deeper on the root cause.
What are the five data streams every ecommerce brand must manage?
We see five streams that must agree before any analysis is trustworthy. Each one fails in a signature way, and each has a quality trip-wire you can self-check against.
Behavioral data (sessions, clicks, funnels): platform-reported behavior overstates real performance.
Inventory data (stock, fulfillment): lagging counts cause peak stockouts. Trip-wire, refresh slower than 24 hours.
The transactional stream is where the most money hides, because that is where landed cost lives. Freight, duties, and brokerage rarely appear in a blended margin report, yet they decide whether your hero product is actually profitable.
We help operators keep these streams clean and connected through unified data analysis and deep industry research, so a breach in any stream surfaces before it costs you a stockout or a wasted ad budget.
Do I need a PIM, CDP, warehouse, or MDM for my store?
We match the tool to your stage, not to the vendor's pitch. Most operators between 3 and 5M get sold infrastructure they do not need yet.
Under 1M: skip all four. Clean spreadsheets and Shopify reports are enough.
3 to 5M (most readers): a cloud warehouse, automated connectors, and a query layer. That is it.
20M+ or five-plus channels: now a PIM (product information manager) and an MDM (master data manager) start paying back.
A PIM earns its keep with heavy SKU counts and multichannel catalogs. A CDP suits heavy retention with many touchpoints. An MDM only makes sense for enterprise-scale, multi-team operations.
Bolting cargo-ship infrastructure onto a jet-ski-sized brand just slows you down. We position Luca in a different lane entirely, as the AI query and intelligence layer over your unified data, doing the work you would otherwise hire a junior analyst for. For deeper comparisons, see our guide to ecommerce analytics platforms.
How do I know if my ecommerce data is AI-ready?
We consider data AI-ready when three things are true: you have a unified layer, semantic labeling (fields tagged so machines know what they mean), and over 80% customer identity coverage. Below that threshold, AI guesses.
Most brands sit at stage two of a four-stage climb, centralized but still dirty. The progression runs:
Spreadsheets with manual reconciling.
Connected dashboards that still disagree.
A unified warehouse with duplicates remaining.
An AI-ready single source of truth, clean, labeled, and deduplicated.
You cannot skip stages. Feeding AI uncleaned data produces confidently wrong answers, which is why some brands abandon native forecasting after months of unreliable output.
The honest read is that most operators are stuck at stage two but believe they are at stage four. We built our approach to AI to normalize and standardize your data on ingestion, so you reach readiness without rebuilding your stack by hand. Plug in, then ask.
Where should I start with ecommerce data management this week?
We tell operators not to boil the ocean. The win this week is one number you actually trust, not a finished platform. Sequence matters, so follow this order:
Audit ownership. Write down which tool owns which number.
Deduplicate identities. Merge duplicate customer profiles first, because everything downstream inherits this error.
Centralize sources. Pipe your tools into one layer so "revenue" means one thing.
Set three alerts. ROAS dips, inventory below threshold, and CAC spikes.
Self-score. Check against the thresholds (under 2% duplicates, under 5% SKU gaps, sub-24-hour refresh).
Dedupe before you centralize, centralize before you tool, and tool before you bolt on AI. Skip PIM and MDM for now.
We can collapse the centralize, alert, and self-score steps into a single layer over your warehouse, turning a quarter-long project into one chat. See what an AI co-founder for e-commerce actually handles for you.
Enjoyed the read? Join our team for a quick 15-minute chat — no pitch, just a real conversation on how we’re rethinking Ecommerce with AI - Luca
Loading Schedule...
Your AI Co-Founder is here.
Here’s why:
Shopify, Meta, Xero - one brain.
"Should I scale?" Answered with real data.
Growth capital. No applications. One click.
Thank you! Your submission has been received! Please book a time slot for the Meeting
Oops! Something went wrong while submitting the form.
.svg)
.svg)


.webp)
.svg)
.webp)

.png)
