Ecommerce Working Capital Explained: Types, Providers, Cash Conversion Mechanics, Capital Structure and Sales Cycle
12
mins read
In this article
TL;DR
Ecommerce working capital bridges the gap between paying suppliers and collecting customer revenue; the cash conversion cycle quantifies that gap in days.
CCC has three levers (DIO, DSO, DPO); reducing it by 15 to 30 days can free $100K to $200K for a $200K/month brand without external financing.
Ten+ providers now compete beyond banks; the right choice depends on revenue stage, sales cycle archetype, and whether the provider's incentives align with yours.
Multi-channel brands must map per-channel CCC independently; a blended average hides cash traps in longer-cycle channels like wholesale.
Financing red flags include daily-debit MCAs, disguised factor rates, hidden personal guarantees, and revenue share with no cap that punishes growth.
Building a layered capital stack (supplier terms, platform capital, RBF, LOC) and evolving it by stage is the difference between 6% and 18% blended cost.
1. What Is Ecommerce Working Capital and How Is It Calculated? [toc=Working Capital Calculation]
Ecommerce working capital is the difference between a business's current assets and current liabilities but for online brands, the calculation carries unique structural complexity that brick-and-mortar retailers never face. Inventory is purchased weeks or months before a single sale, payment processors hold settled funds for 2 to 14 days, and marketplace payouts add further lag: Amazon disburses every 14 days, while Shopify Payments settles in 2 to 3 business days.
This creates a persistent cash gap. A DTC brand may show $500K in monthly revenue on its P&L while its bank account holds a fraction of that because cash is simultaneously locked in inventory, pending payouts, and prepaid ad spend.
Working Capital = Current Assets - Current Liabilities
Working Capital Ratio = Current Assets / Current Liabilities
What changes in ecommerce is the benchmark. A healthy working capital ratio for online businesses falls between 1.2 and 2.0. Below 1.0 signals insolvency risk because liabilities exceed assets, and the brand cannot cover short-term obligations. Above 2.5 typically indicates idle capital that could be redeployed into inventory or marketing for growth.
Ecommerce benchmarks skew lower than traditional retail because of faster inventory turns and digital-first cost structures. A fashion DTC brand turning inventory every 45 days operates with structurally different capital dynamics than a department store turning inventory every 120 days.
⚠️ Where Most Founders Lose Accuracy
The challenge is not the formula. It is tracking components in real time across disconnected systems. Inventory values live in Shopify or Amazon Seller Central, payables sit in Xero or QuickBooks, receivables are split across two or three payment processors, and cash balances require daily bank reconciliation.
Manually assembling these numbers across platforms is where accuracy breaks down. By the time a founder builds a month-end spreadsheet, the number is already outdated. Luca AI calculates working capital ratios in real time by pulling directly from connected commerce and accounting platforms, delivering a live, accurate figure rather than a static month-end estimate.
2. Why Do Ecommerce Businesses Face Working Capital Crunches? [toc=Working Capital Crunches]
The core paradox of ecommerce working capital is counterintuitive: cash crunches are most severe in growing businesses, not failing ones. A brand scaling from $1M to $3M annual revenue must finance 3x the inventory, 3x the ad spend, and 3x the ful fillment costs before seeing 3x the cash inflow. Revenue appears on the P&L immediately; cash arrives weeks or months later. Profitability on paper coexists with an empty bank account.
This is the growth cash trap and it affects brands at every stage.
"Right now, the issue isn't demand or ads, it's cash flow. We've built systems that work, but mistakes and bad timing nearly broke the business." Anonymous, r/ growmybusiness Reddit Thread
The most dangerous cash crunches happen in growing businesses. Revenue triples on paper while your bank account hits its lowest point because costs scale before cash arrives.
⏰ Six Root Causes Behind the Crunch
Seasonal demand spikes Q4 holiday, Prime Day, and Black Friday require inventory commitments 60 to 120 days before sales, creating massive cash outflows in July to September while revenue arrives in November to January.
Supplier payment terms tightening New or smaller brands receive net-15 or prepay requirements, while established competitors negotiate net-60. The cash gap widens before a single unit ships.
Rising customer acquisition costs Meta CPMs have increased 40 to 60% compared to Q4 2024 levels, and CPCs are up 30 to 50% across most niches, requiring substantially more upfront marketing spend per customer.
Marketplace fee structures Amazon's 15% referral fee + FBA costs + advertising fees mean up to 40% of GMV never reaches the seller.
Return rates Fashion ecommerce averages 25% return rates; apparel-heavy brands see even higher. Refunds process to customers in days, but COGS recovery takes weeks.
Platform settlement delays Amazon holds funds up to 14 days post-delivery confirmation, and some processors place reserves on high-growth accounts.
💸 Even the Biggest Brands Face It
Gymshark's founder Ben Francis launched the brand from his parents' garage in 2012, delivering pizza by day and sewing clothes by night. During rapid scaling phases, Gymshark managed cash flow constraints by achieving a negative cash conversion cycle, paying suppliers slower than it collected from customers, which effectively let supplier credit finance growth. The company's £49M inventory increase in a single year drove operating cash flow negative by £32M, requiring careful debt management to sustain.
The cash crunch is not a sign of poor management. It is a structural feature of the ecommerce business model that must be engineered around. Each of these six triggers directly lengthens the cash conversion cycle, the single metric that quantifies exactly how long cash stays locked up between outflow and inflow.
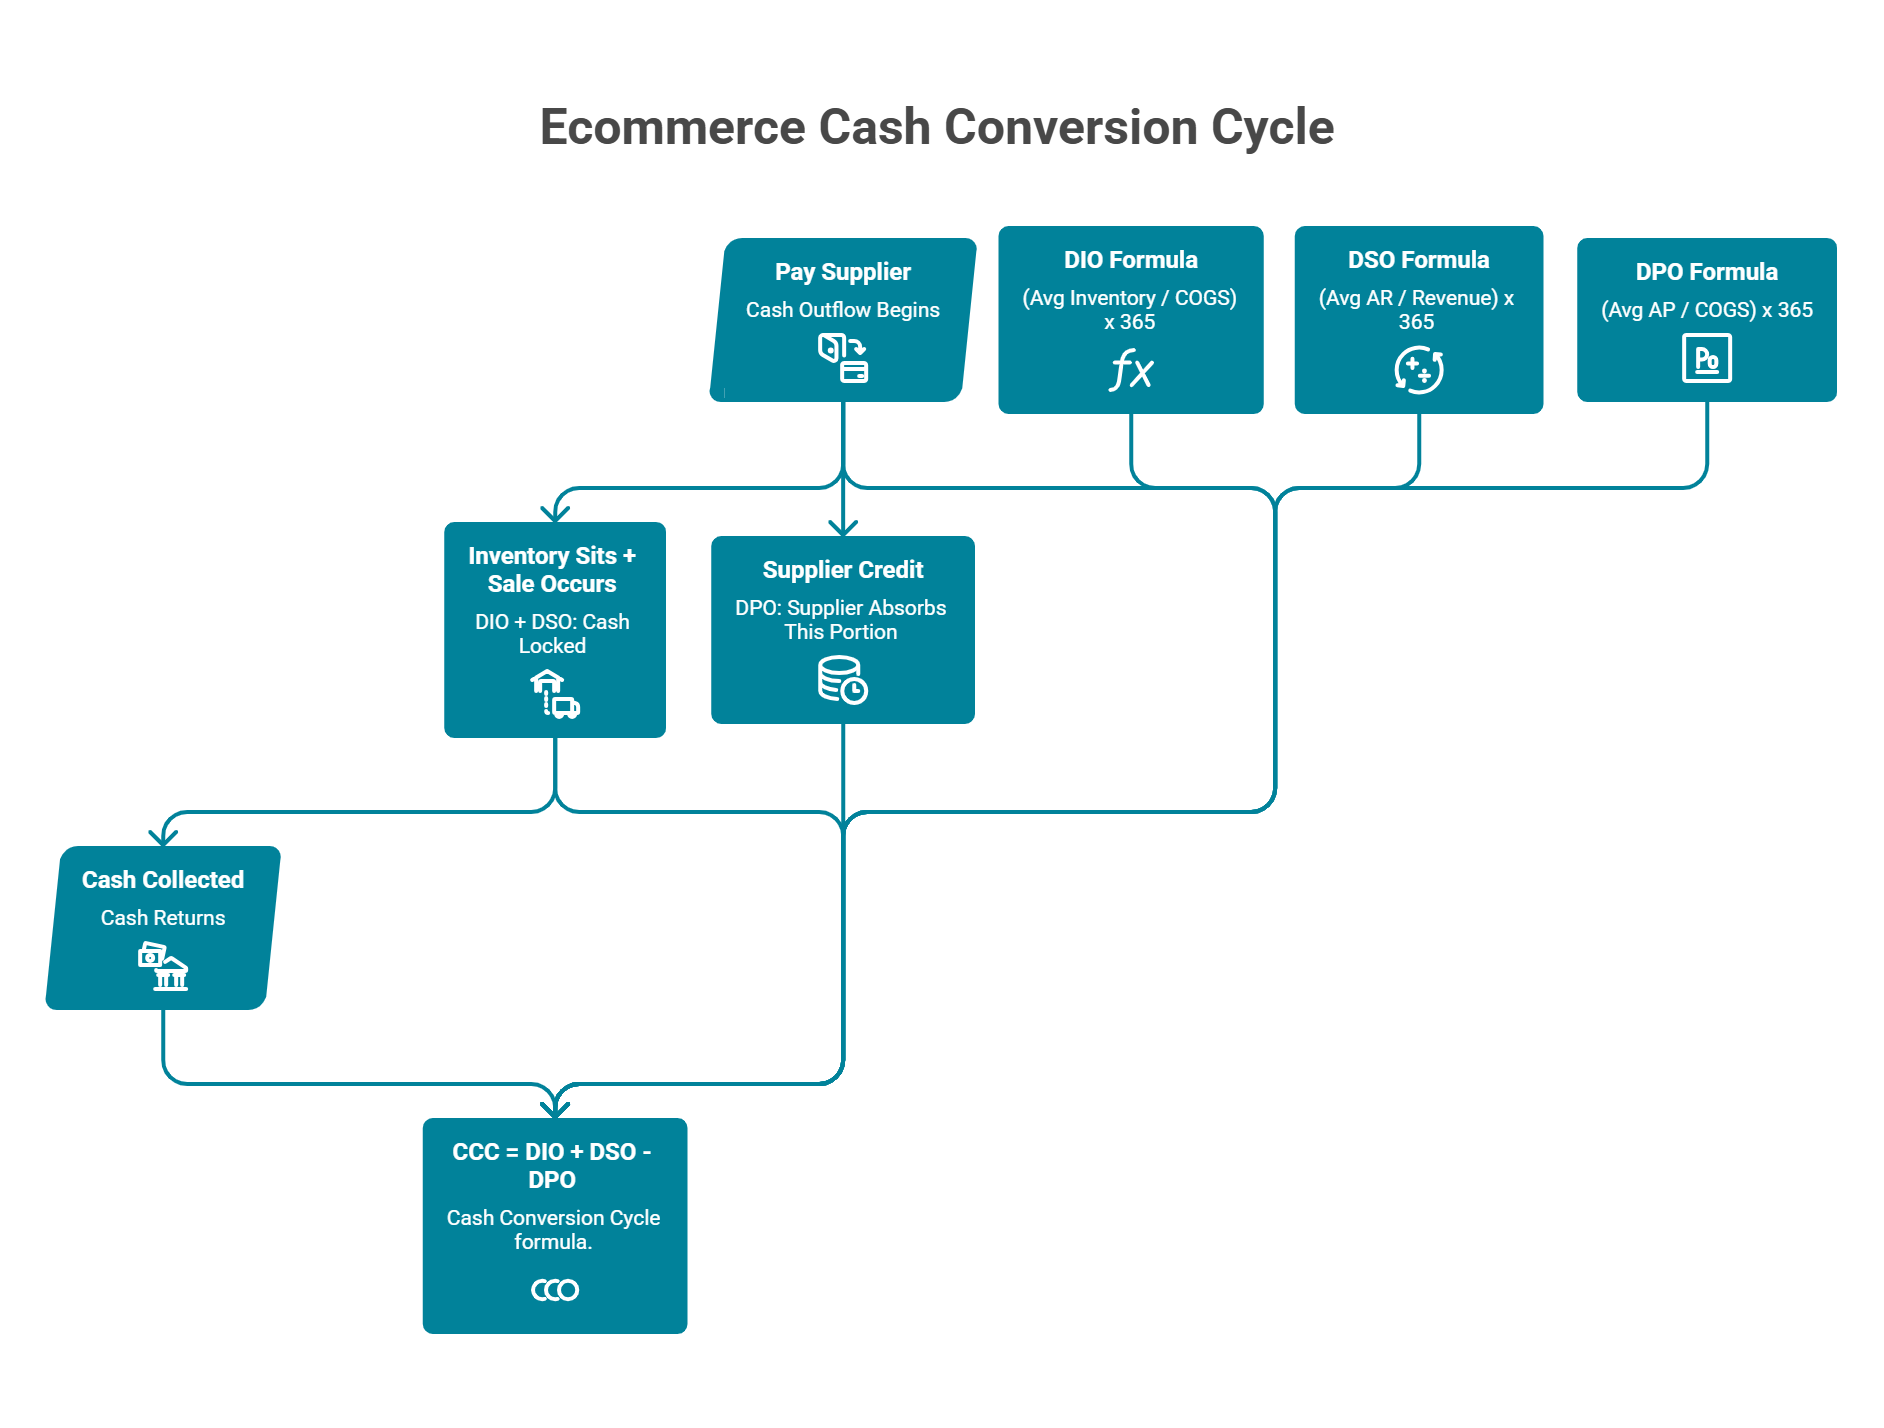
3. How Does the Cash Conversion Cycle Work in Ecommerce? [toc=Cash Conversion Cycle]
The Cash Conversion Cycle (CCC) is the single metric that quantifies the time gap between when you pay for inventory and when that cash comes back as collected revenue. Every ecommerce business model produces a different CCC, and that number, not top-line revenue, determines how much working capital you actually need.
✔ The CCC Formula
CCC = Days Inventory Outstanding (DIO) + Days Sales Outstanding (DSO) - Days Payable Outstanding (DPO)
DIO = How long inventory sits before selling. Formula: (Average Inventory / COGS) x 365
DSO = How long after a sale until cash hits your account. Formula: (Average Accounts Receivable / Revenue) x 365
DPO = How long you take to pay suppliers. Formula: (Average Accounts Payable / COGS) x 365
In plain terms: DIO + DSO tells you how long cash is locked up. DPO tells you how much of that gap your supplier absorbs. The difference is how many days you must finance out of pocket.
The CCC quantifies the exact number of days your cash stays locked between outflow and inflow. Every additional day requires proportionally more working capital.
💰 Three Worked Examples
Example 1: DTC Skincare Brand Orders $80K in inventory with a 75-day manufacturing lead time and 45-day sell-through. Shopify Payments settles in 3 days. Supplier terms: net-30.
DIO = 120 days | DSO = 3 days | DPO = 30 days
CCC = 93 days
At $100K/month revenue, this brand needs ~$310K in working capital at any given time.
Example 2: Amazon FBA Seller 21-day average inventory turn in Amazon's warehouse. 14-day Amazon payout cycle. Negotiated net-60 supplier terms.
DIO = 21 days | DSO = 14 days | DPO = 60 days
CCC = -25 days (negative: the supplier effectively finances operations)
Example 3: Subscription Box Business 30-day inventory cycle. Customers prepay monthly subscriptions (0-day DSO). Supplier terms: net-30.
DIO = 30 days | DSO = 0 days | DPO = 30 days
CCC = 0 days (cash-neutral)
CCC Comparison by Ecommerce Business ModelBusiness Model DIODSODPOCCCWC Needed per $100K/mo Revenue Capital UrgencyDTC Skincare120 days3 days30 days93 days~$310K🔴 HighAmazon FBA21 days14 days60 days-25 days~$0 (supplier-financed)🟢 LowSubscription Box30 days0 days30 days0 days~$0 (cash-neutral)🟢 Low
⚠️ Why CCC Matters More Than Revenue
Every additional day of CCC requires proportionally more working capital. A brand that reduces CCC from 90 days to 60 days frees up one full month of operating cash, often $50K to $200K for a mid-stage brand. Gymshark achieved a negative CCC during its early scaling years, meaning cash from customers arrived before supplier payments were due, effectively turning supplier credit into growth capital.
This is why CCC, not revenue, is the metric that determines how much capital you actually need and how urgently you need it. Forecasting cash flow accurately requires tracking CCC in real time, not estimating it quarterly.
4. What Are the Main Types of Ecommerce Working Capital Financing and What Do They Actually Cost? [toc=Financing Types and Costs]
Six primary financing types serve ecommerce brands, each using a different cost structure, making honest comparison deliberately difficult. Flat fees, factor rates, APR, and revenue-share percentages are designed to obscure true cost. The table below normalizes everything to effective annualized APR for a genuine apples-to-apples comparison.
💰 Master Comparison Table
Ecommerce Working Capital Financing ComparisonType How It Works Stated Cost Effective APR Speed to Fund Collateral Best For Biggest RiskRevenue-Based Financing (RBF)Advance repaid via % of daily/weekly revenue6-12% flat fee15-35% (on 6-mo terms)1-7 days None typically Scaling proven channels Slow months = higher margin consumption Inventory Financing Lender advances 50-80% of inventory value1-4% monthly12-48% annualized1-4 weeksInventory itself Large PO or seasonal stock-up Liquidation risk if product doesn't sell Business Line of Credit Revolving facility; draw as needed8-25% APR8-25% (true APR)2-8 weeks Varies Ongoing operational flexibility Lengthy approval; may require PG Merchant Cash Advance (MCA)Lump sum repaid via factor rate x daily sales1.2-1.5 factor rate⚠️ 40-150%1-3 days Future receivables Emergency capital Extremely expensive; daily debits Purchase Order Financing Funder pays supplier directly against confirmed POs 1.5-3.5% per 30 days 18-42% annualized 1-2 weeksThe PO itselfLarge wholesale/retail orders Only works with confirmed purchase orders Platform Capital (Shopify, Amazon) Embedded offers based on platform sales dataVaries6-17% (Amazon); 10-17% (Shopify)1-5 daysFuture platform sales Quick, simple access Limited to that platform's ecosystem
✔ Deep Dive: RBF and Inventory Financing
Revenue-Based Financing advances capital with repayment as a fixed percentage of daily or weekly revenue until a predetermined payback amount is reached. The advantage: repayment flexes naturally with sales volume. The risk: during slow months, that fixed percentage consumes a disproportionate share of margin, and most RBF providers have no mechanism to adjust pricing based on improved performance.
Inventory Financing uses existing or incoming inventory as collateral, with lenders advancing 50 to 80% of inventory value. It directly ties capital to the asset being funded. The risk: it requires formal inventory valuation, is typically slower to set up, and carries liquidation risk if the product doesn't sell through.
"I had the same thing happen to me in July. I believe it was an AI error." -u/nwkrkhe, r/shopify Reddit Thread
"Good value for money? No. Quick money in a pinch? Yes." -u/nkl7e6h, r/shopify Reddit Thread
💸 The Effective APR Transparency Test
When a provider quotes "8% fee," the critical follow-up is: over what term, with what repayment schedule? A flat 8% fee repaid over 4 months carries an effective APR of approximately 24%. The same 8% fee repaid over 12 months comes closer to 8% annualized. One Clearco user calculated the real cost firsthand:
"6% for 4 months extension does not sound like a lot. Since you have to pay back weekly immediately, you will have less than half of the money on average available over the 4 months. That puts you to 12% / 4 months x 12 months = 36% APR. In the best case." -Julian Fernau Trustpilot Verified Review
The table above normalizes all costs to annualized APR for honest comparison. This single calculation, converting stated fees to effective APR, is the most important step most founders skip when evaluating financing offers and their impact on unit economics.
5. Which Ecommerce Working Capital Providers Should You Evaluate in 2026? [toc=Capital Providers Evaluation]
The ecommerce capital market has matured past the era of "take whatever's available." Founders now have 10+ viable providers beyond traditional bank loans, each with different cost structures, speed, and incentive models. The right choice depends on funding size, repayment flexibility, and critically whether the provider's revenue model aligns with your business outcomes or works against them.
Below is an honest evaluation of the providers worth considering.
⭐ #1: Luca AI: Dynamic Pricing, Right-Sized Capital
Luca offers non-dilutive capital with three structural advantages that separate it from traditional RBF providers:
✔ Dynamic pricing Your rate adjusts based on real-time business performance. A strong Q2 means cheaper capital in Q3, unlike static rates locked at application time.
✔ Optimal sizing Luca recommends the right advance amount, not the maximum. Its subscription-based revenue model means it does not profit from pushing larger advances.
✔ Many-small-advances model Instead of one $300K lump sum with capital sitting idle, Luca encourages frequent smaller draws ($10K to $50K) so total cost stays lower and no capital goes unused.
No personal guarantees. Instant deployment. One-click funding.
💰 Provider Comparison Table
Ecommerce Working Capital Providers Comparison 2026
Provider
Funding Range
Typical Cost
Speed
Repayment Model
Key Strength
Key Limitation
Luca AI
$10K to $500K+
Dynamic (performance-based)
Hours
Revenue share, automated
Dynamic pricing adapts with performance
Newer entrant; building brand awareness
Shopify Capital
$200 to $2M
~10 to 17% effective APR
1 to 5 days
% of daily sales
Fast, seamless for Shopify merchants
Limited to Shopify ecosystem; no rate negotiation
Amazon Lending
$1K to $750K
6 to 16% APR
1 to 5 days
Fixed monthly installments
Integrated into Seller Central
Invitation-only; Amazon sellers exclusively
PayPal Working Capital
$1K to $300K
Single fixed fee
1 to 3 days
% of PayPal sales
Very fast; no credit check
Only repays from PayPal transactions; expensive at scale
Most articles skip this: pure lending businesses generate revenue by deploying capital at the highest possible fee. When a founder requests $300K, the lender has no structural reason to say "you only need $150K." Luca AI's subscription revenue model decouples capital recommendations from capital deployment revenue the system recommends the right amount, not the most profitable amount for the provider.
Real-world feedback on the traditional providers confirms the gap:
"Really disappointing experience. I have used Wayflyer on a number of occasions to help with Q4 stock purchasing and working capital requirements only to be told we no longer fit their criteria." -Joshua Hannan Wayflyer Trustpilot Verified Review
"We had a signed agreement with 8fig for three preset rounds of funding at pre-agreed rates. They only funded the first round, which was at the highest cost, and then backed out of the rest at the last minute." -Melissa 8fig Trustpilot Verified Review
"Pretty expensive product at 35 to 40% APR. Even worse support... 6% for 4 months does not sound like a lot. Since you have to pay back weekly immediately, you will have less than half of the money on average available. That puts you to 36% APR." -Julian Fernau Clearco Trustpilot Verified Review
✔ Honest Guidance
Choose Shopify Capital for speed and simplicity under $50K if you sell exclusively on Shopify. Choose Wayflyer for large single advances ($200K+) when you have existing financial modeling capability. Choose Luca AI when you want dynamically-priced capital that adjusts to your business performance, right-sized advances that minimize idle capital, and a provider whose incentives are aligned with your outcomes not their deployment targets.
6. How Do You Choose the Right Capital Type for Your Business Stage and Sales Cycle? [toc=Capital Type by Stage]
Choosing the wrong capital type does not just cost a higher fee it creates repayment pressure during slow periods, ties up cash that should be deployed, and can trap brands in debt cycles. Yet most founders choose based on speed or availability alone, not structural fit with their business model.
❌ Three Common Mistakes
Taking whatever is offered fastest
Maximizing the advance amount "just in case"
Choosing based on a comparison article that does not account for your specific CCC or growth stage
The right approach: match capital type to two axes your current business stage and your dominant sales cycle archetype.
💰 Capital Structure Matrix
Capital Structure Matrix by Business Stage and Sales Cycle
Business Stage
Short-Cycle DTC (CCC 30 to 60 days)
Long-Lead Wholesale (CCC 90 to 150 days)
Subscription/Recurring (CCC 0 to 15 days)
Marketplace-Dependent (CCC varies)
Pre-$1M
Platform capital (Shopify Capital) + negotiate net-30 supplier terms
PO financing for confirmed orders + personal savings bridge
Minimal need use cash from prepaid subscriptions
Amazon Lending for inventory top-ups
$1M to $5M
Small RBF advances for campaign scaling + supplier term negotiation
Inventory financing for long lead times + layered RBF for marketing
LOC as safety net; reinvest subscription cash flow
Platform capital + small RBF for channel expansion
$5M to $20M
Revolving LOC as base + RBF for proven campaign bursts
Inventory financing + LOC + PO financing for large orders
LOC for strategic reserves + RBF for acquisition experiments
LOC as base layer + RBF for new channel launches
$20M+
Full capital stack: LOC + trade credit + targeted RBF draws
Multi-source stack: LOC + inventory facility + PO financing + trade credit
LOC + strategic RBF for expansion into new verticals
Channel-specific capital allocation with dynamic draw schedules
✔ Two Cells Walked Through
$1M to $5M + Long-Lead Wholesale: Your CCC is 90+ days. Inventory financing covers the long manufacturing and shipping lead time, while small RBF advances fund marketing spend during the 90-day wait. Blended capital cost: ~15%. Without this layered approach, the founder either overpays on a single large MCA or misses the wholesale window entirely.
$5M to $20M + Marketplace-Dependent: Amazon's 14-day payout creates a predictable CCC. Use a revolving LOC as the base layer for ongoing operations; add RBF specifically for new channel launches where CCC is uncertain. This prevents expensive capital from sitting idle during predictable cycles.
⏰ Decision Flowchart
If CCC > 60 days Consider inventory financing or PO financing as the primary layer
If CCC < 30 days A LOC or small RBF advances are sufficient
If seasonal variance > 40% Layer seasonal capital on top of a base facility
If multi-channel Map per-channel CCC and fund each gap independently
✔ How Luca AI Automates the Match
Luca's capital layer automates this matching by pricing each advance dynamically based on real-time business health. As your stage changes, your capital terms change with it no reapplication, no renegotiation. Capital that adapts as you scale, rather than a static facility sized for last quarter's business.
7. How Should Multi-Channel and Seasonal Ecommerce Brands Manage Working Capital? [toc=Multi-Channel Seasonal Management]
Consider this scenario: you sell across Shopify (DTC), Amazon (marketplace), and wholesale (B2B). Shopify settles in 2 days, Amazon in 14 days, wholesale accounts pay net-60. Return rates differ per channel 8% DTC, 25% Amazon, 3% wholesale. Fee structures differ 3% Shopify Payments, 15%+ Amazon referral and FBA fees, 0% wholesale but higher logistics costs.
You do not have one CCC. You have three running simultaneously. A blended "average" CCC masks the real cash dynamics: your wholesale channel might run a 95-day CCC while your DTC channel runs 35 days.
⏰ The Seasonal Compounding Problem
Now layer Q4 onto the multi-channel problem. You need to commit inventory spend in July to August for November delivery across all three channels each with different inventory requirements. FBA requires pre-positioned stock 30 days early, wholesale has MOQ commitments, and DTC can flex with on-demand ful fillment.
A brand doing $5M/year with 55% of revenue concentrated in Q4 needs roughly $400K to $600K in working capital deployed July to September against revenue that arrives November to January. As one ecommerce CFO mapped out: a brand targeting $850K in Q4 revenue required $180K in inventory investment against a $95K cash position an $85K gap that determines the entire quarter.
✔ Practical Strategies for Multi-Channel + Seasonal Brands
Map per-channel CCC independently Fund each channel's gap separately rather than using a blended estimate. Your Amazon CCC (35 days) needs different capital than your wholesale CCC (95 days).
Pre-negotiate supplier terms in Q1 Leverage is highest when demand is low. Extend from net-30 to net-60 before you actually need the extension.
Secure capital 90 days before seasonal need Not during the crunch. Inventory financing applications can take 30 to 45 days; supplier negotiations need 60+ days.
Stagger inventory purchases Multiple smaller orders rather than one large PO. This preserves cash flexibility and reduces overstock risk per channel.
Use historical per-channel sell-through data Right-size inventory by channel rather than ordering a single blended quantity. Last year's Amazon sell-through rate is not the same as last year's Shopify rate.
💰 How Luca AI Addresses Multi-Channel Complexity
Luca's capital layer lets you draw precisely the amount needed for each channel's gap a $40K draw for Amazon FBA inventory, a separate $80K draw for wholesale PO fulfillment each priced dynamically based on the risk profile of that specific deployment. No need to take one large lump sum and allocate manually. Smaller, targeted draws equal lower total cost.
8. How Can You Reduce Your Cash Conversion Cycle Without External Financing? [toc=Reduce CCC Operationally]
Three operational levers reduce CCC: (1) reduce DIO shorten the time inventory sits unsold, (2) reduce DSO collect cash faster, and (3) increase DPO extend supplier payment windows. The goal is to reduce CCC by 15 to 30 days, which for a $200K/month brand frees up $100K to $200K in working capital without borrowing a dollar.
✔ Lever 1: Reduce DIO (Target: 15 to 25 Days)
Implement ABC inventory analysis A-items (top 20% of SKUs driving ~80% of revenue) get tight reorder points and priority stocking. C-items get minimal stock or are moved to dropship.
Split orders into smaller, more frequent batches Instead of one large PO every 90 days, negotiate 3 smaller POs every 30 days. This keeps less cash trapped in unsold inventory.
Reduce SKU count The Ordinary built $500M+ in revenue on fewer than 40 core SKUs by keeping their product line focused and DIO tight. Best practice: set a maximum inventory-to-revenue ratio never hold more than 60 days of stock for any single SKU.
Use historical sell-through data to forecast demand Overstock is cash trapped in slow-moving product. A 20% reduction in slow-mover inventory directly improves DIO.
✔ Lever 2: Reduce DSO (Target: 3 to 7 Days)
Switch to faster-settlement payment processors where possible
Offer 2% early-payment discount on wholesale/B2B invoices (net-10 vs. net-30)
Minimize refund processing delays automate refund workflows to prevent cash from sitting in limbo
For marketplace sellers: consolidate disbursement schedules and explore Amazon's accelerated disbursement options
✔ Lever 3: Increase DPO (Target: +10 to +20 Days)
Negotiate extended terms as order volume grows net-30 to net-45 to net-60. Suppliers extend terms for reliable, growing accounts.
Use trade credit strategically treat extended payment terms as free financing
Explore supply chain financing where a third party pays suppliers early at a small discount while you repay on extended terms
💰 Combined Impact
Combined CCC Optimization Impact
Lever
Starting CCC
Improvement
New CCC
Reduce DIO
90 days
-20 days
70 days
Reduce DSO
70 days
-5 days
65 days
Increase DPO
65 days
+15 days (subtracted from CCC)
50 days
Working capital freed
-
-
~$133K per $100K monthly revenue
These operational optimizations should always be pursued before or alongside external financing. They permanently improve cash efficiency, while capital only bridges the gap. A brand that reduces CCC from 90 to 50 days may not need external capital at all or may need 40% less of it, materially reducing total financing cost.
9. What Are the Red Flags in Ecommerce Financing and What Happens When Working Capital Goes Wrong? [toc=Financing Red Flags]
Ecommerce financing risk comes from two directions: choosing the wrong financing product with predatory terms you did not fully understand, and failing to manage working capital proactively so consequences compound over time. Both can be avoided with the right knowledge. Here are the specific warnings for each.
⚠️ Five Financing Red Flags
Daily-debit MCAs that drain operating cash during slow weeks A $100K advance at a "10% fee" can translate to 60 to 150% effective APR when repayment is structured as daily fixed debits. During slow weeks, that daily debit consumes a disproportionate share of revenue, accelerating cash depletion.
Factor rates presented as interest rates A 1.3 factor rate on a 6-month term equals ~60% annualized, not 30%. Providers deliberately use factor rates because they appear lower than APR equivalents.
Personal guarantee requirements buried in agreements Your personal assets become collateral. One business owner reported discovering 17 unacceptable clauses after signing, including provisions allowing the lender to "enter your building and take your property in excess of what is owed".
Stacking penalties triggering cross-default If you hold multiple financing products, one default can trigger acceleration on all of them.
Revenue share with no cap If sales spike, you massively overpay. One Clearco user calculated that repaying weekly on a "6% for 4 months" offer actually resulted in 36% APR because average available capital was less than half the advance amount.
"Read their terms and contract carefully! They said their offer is not secured, which is false they still will file UCC. They can redirect your Shopify funds to their account." -Zachary Piech Trustpilot Verified Review
"These merchant cash advances are notorious for their exorbitant fees and daily repayment structures. At first, the daily payments seemed manageable..." -u/Dazzling_Kangaroo_76, r/smallbusiness Reddit Thread
❌ Five Consequences of Working Capital Mismanagement
Stockouts on top SKUs during peak season Brands report 15 to 30% revenue loss during even 10 days of stockout on a top-3 product. Once a best-seller goes out of stock during Black Friday, that revenue does not come back.
Missed scaling windows A 3.5x ROAS campaign decays to 1.8x by the time cash is available, costing tens of thousands in unrealized revenue.
Supplier relationship damage Requesting payment extensions or missing terms signals distress, often resulting in prepay-only requirements that worsen cash flow further.
Forced liquidation discounting Excess inventory from poor forecasting gets discounted 40 to 60%, destroying margins.
Growth stall The brand is profitable on paper but cannot fund its own growth, entering a cycle of undercapitalization.
"One of the worst companies I've ever dealt with. They trick you into signing a low APR contract, and then one month into the term, they hike up the rates by offering more funds." - Khalid Trustpilot Verified Review
Pure lending businesses profit from deploying more capital at higher fees. When the provider's revenue is decoupled from capital deployment, the system recommends what you actually need.
✔ How Luca AI Is Structurally Different
Luca AI's capital layer is designed to avoid these traps: no personal guarantees, no daily debits, no hidden factor rates. Dynamic pricing is transparent you see the exact cost before accepting. The many-small-advances model means you never overcommit to a single large draw that sits idle. And if business performance improves, your next draw is cheaper the rate works for you, not against you.
10. How Do You Build a Capital Stack That Scales With Your Ecommerce Business? [toc=Scalable Capital Stack]
Most ecommerce founders treat working capital as a single problem with a single solution take one advance from one provider when cash runs low. The most capital-efficient brands think differently: they build a layered stack where each layer serves a specific purpose at a specific cost. Supplier terms form the free base layer, platform capital handles quick gaps, RBF or inventory financing covers growth-driven needs, and a line of credit provides strategic reserves.
Building this stack intentionally is the difference between paying 6% blended for capital and paying 18%.
The most capital-efficient brands layer complementary sources by stage. Each new layer reduces blended cost while increasing total capital access.
❌ The Single-Source Trap
Traditional RBF providers encourage one relationship, one large advance, one repayment stream because that maximizes their revenue. But a $500K brand should not use the same capital structure as a $10M brand. Founders who do not evolve their capital structure end up overpaying: taking $300K at a flat 8% fee when they only need $80K this month and $120K next month, with $100K sitting idle costing 8% for doing nothing.
The reviews confirm this pattern. Multiple merchants report being pushed toward maximum advance amounts, only to find the provider unresponsive when they return for a second round.
💰 Capital Stack Progression Roadmap
Capital Stack Progression by Revenue Stage
Stage
Revenue
Recommended Stack
Blended Cost Target
Stage 1
$0 to $1M
Supplier terms negotiation (free) + Shopify Capital for occasional seasonal gaps
0 to 10%
Stage 2
$1M to $5M
Add RBF or inventory financing for growth capital; negotiate net-45/60 supplier terms; platform capital for small, fast needs
6 to 12%
Stage 3
$5M to $20M
Add a business LOC as strategic reserve; use RBF specifically for proven campaign scaling; PO financing for wholesale expansion; trade credit from key suppliers
5 to 10%
Stage 4
$20M+
Full capital stack with revolving facility, multiple capital sources, channel-specific capital allocation, and dynamic draw schedules based on per-channel ROI
4 to 8%
⏰ Why the Stack Must Evolve
At Stage 1, Shopify Capital's simplicity is a genuine advantage fast, no paperwork, no negotiation. But by Stage 3, relying solely on platform capital means overpaying by 5 to 10% annually compared to a properly constructed stack. The progression is not about replacing providers it is about layering complementary capital sources so no single provider captures excessive margin.
✔ Luca AI as the Adaptive Capital Partner
Luca is built for the stacking model. Instead of applying for a static facility that does not change for 6 to 12 months, Luca offers dynamic draws take $30K this week for inventory, $15K next week for a campaign test, $50K the following month for a wholesale PO. Each draw is independently priced based on current business health. Better performance equals cheaper capital.
Over 12 months, a brand deploying $500K total through Luca's many-small-draws model pays materially less than the same $500K taken as a single advance from a traditional RBF provider because no capital sits idle and pricing improves with performance.
💸 The Final Principle
The most expensive capital in ecommerce is not the advance with the highest fee. It is the capital you took without knowing whether you needed it, when you needed it, or how much was actually required. Right-sized, dynamically-priced, performance-adaptive capital is the structural advantage that separates brands that scale efficiently from brands that scale expensively.
FAQ's
What is ecommerce working capital and why does the cash conversion cycle matter?
Ecommerce working capital is the operational cash available to fund day-to-day activities like inventory purchases, marketing spend, supplier payments, and payroll after subtracting current liabilities from current assets. It is the financial oxygen that keeps an online store running between the moment you pay for inventory and the moment a customer's payment settles in your bank account.
The cash conversion cycle (CCC) is the metric that quantifies this gap. It measures how many days your cash is tied up before it returns as collected revenue. CCC is calculated as:
Days Inventory Outstanding (DIO): How long inventory sits before selling.
Days Sales Outstanding (DSO): How long after a sale before cash arrives.
Days Payable Outstanding (DPO): How long you can delay paying suppliers.
A longer CCC means more capital is trapped in the operating cycle. For a brand doing $200K/month, a 90-day CCC means roughly $600K is locked up at any given time. Reducing CCC by even 15 to 30 days can free $100K to $200K without borrowing. We built Luca AI's financial management layer to help founders monitor and optimize CCC in real time across every sales channel.
How do you choose the right working capital provider for your ecommerce business stage?
The right provider depends on two axes: your current revenue stage and your dominant sales cycle archetype (short-cycle DTC, long-lead wholesale, subscription, or marketplace-dependent). A pre-$1M brand has fundamentally different needs than a $5M to $20M operation scaling across multiple channels.
Pre-$1M: Platform capital like Shopify Capital for occasional gaps, plus negotiated net-30 supplier terms. Keep it simple and low-cost.
$1M to $5M: Layer small RBF advances for campaign scaling on top of extended supplier terms. Inventory financing covers long lead times.
$5M to $20M: Add a revolving line of credit as the base layer. Use RBF specifically for proven campaign bursts and PO financing for wholesale expansion.
$20M+: Full capital stack with revolving facility, trade credit, channel-specific allocation, and dynamic draw schedules.
The most expensive mistake is using the same capital structure at $5M that you used at $500K. We designed Luca AI's capital layer to evolve with your business, pricing each draw dynamically based on real-time performance so you never overpay for capital that does not match your current stage.
What are the biggest red flags to watch for in ecommerce financing agreements?
Ecommerce founders frequently encounter predatory terms disguised behind simple-sounding fees. Recognizing these red flags before signing can save your business from debt traps and cash flow crises.
Daily-debit MCAs: A $100K advance at a '10% fee' can translate to 60 to 150% effective APR when structured as fixed daily debits. During slow weeks, these debits consume a disproportionate share of revenue.
Factor rates disguised as interest rates: A 1.3 factor rate on a 6-month term equals roughly 60% annualized, not 30%. Providers use factor rates because they appear lower than APR equivalents.
Hidden personal guarantees: Your personal assets become collateral. Some founders discover clauses allowing lenders to seize property in excess of what is owed.
Stacking penalties and cross-default triggers: One default on any financing product can accelerate repayment on all of them simultaneously.
Revenue share with no cap: If sales spike, you massively overpay relative to the capital deployed.
We built Luca AI to be structurally different: no personal guarantees, no daily debits, no hidden factor rates, and transparent dynamic pricing where you see the exact cost before accepting any draw.
How can ecommerce brands reduce their cash conversion cycle without external financing?
Three operational levers reduce CCC without borrowing: reducing Days Inventory Outstanding (DIO), reducing Days Sales Outstanding (DSO), and increasing Days Payable Outstanding (DPO). Together, these can free $100K to $200K per $100K in monthly revenue.
Reduce DIO (target 15 to 25 days improvement): Implement ABC inventory analysis so top SKUs get tight reorder points. Split large POs into smaller, more frequent batches. Cut slow-moving SKUs and never hold more than 60 days of stock for any single product.
Reduce DSO (target 3 to 7 days improvement): Switch to faster-settlement processors. Offer 2% early-payment discounts on B2B invoices (net-10 vs. net-30). Automate refund workflows to prevent cash sitting in limbo.
Increase DPO (target 10 to 20 days improvement): Negotiate extended supplier terms as volume grows. Use trade credit as free financing. Explore supply chain financing where a third party pays suppliers early at a discount.
These optimizations permanently improve cash efficiency. A brand reducing CCC from 90 to 50 days may need 40% less external capital. We recommend pursuing these levers before or alongside using AI-powered cash flow forecasting to model the precise impact on your working capital position.
How should multi-channel and seasonal ecommerce brands manage working capital differently?
If you sell across Shopify, Amazon, and wholesale, you do not have one cash conversion cycle. You have three running simultaneously with different settlement timelines, return rates, and fee structures. A blended 'average' CCC masks the real cash dynamics where wholesale might run a 95-day cycle while DTC runs 35 days.
Seasonal brands face a compounding problem on top of multi-channel complexity. A $5M/year brand with 55% of revenue in Q4 needs $400K to $600K deployed July through September against revenue arriving November through January.
Map per-channel CCC independently and fund each gap separately rather than using a blended estimate.
Pre-negotiate supplier terms in Q1 when leverage is highest and demand is low.
Secure capital 90 days before seasonal need, not during the crunch.
Stagger inventory purchases with multiple smaller orders to preserve flexibility and reduce overstock risk per channel.
We designed Luca AI's sales performance layer to let brands draw precisely the amount needed for each channel's gap, with each draw priced dynamically based on that deployment's specific risk profile. Smaller, targeted draws equal lower total cost.
Enjoyed the read? Join our team for a quick 15-minute chat — no pitch, just a real conversation on how we’re rethinking Ecommerce with AI - Luca
Loading Schedule...
Your AI Co-Founder is here.
Here’s why:
Shopify, Meta, Xero - one brain.
"Should I scale?" Answered with real data.
Growth capital. No applications. One click.
Thank you! Your submission has been received! Please book a time slot for the Meeting
Oops! Something went wrong while submitting the form.
.svg)
.svg)

.jpg)

.png)
.png)

.svg)
.webp)

.png)
